Momentum Indicator Crossover Strategy
The Momentum Indicator Crossover Strategy is a trading approach based on the combination of Exponential Moving Average (EMA) and Relative Strength Index (RSI) signals. Designed to leverage buy and sell signals based…
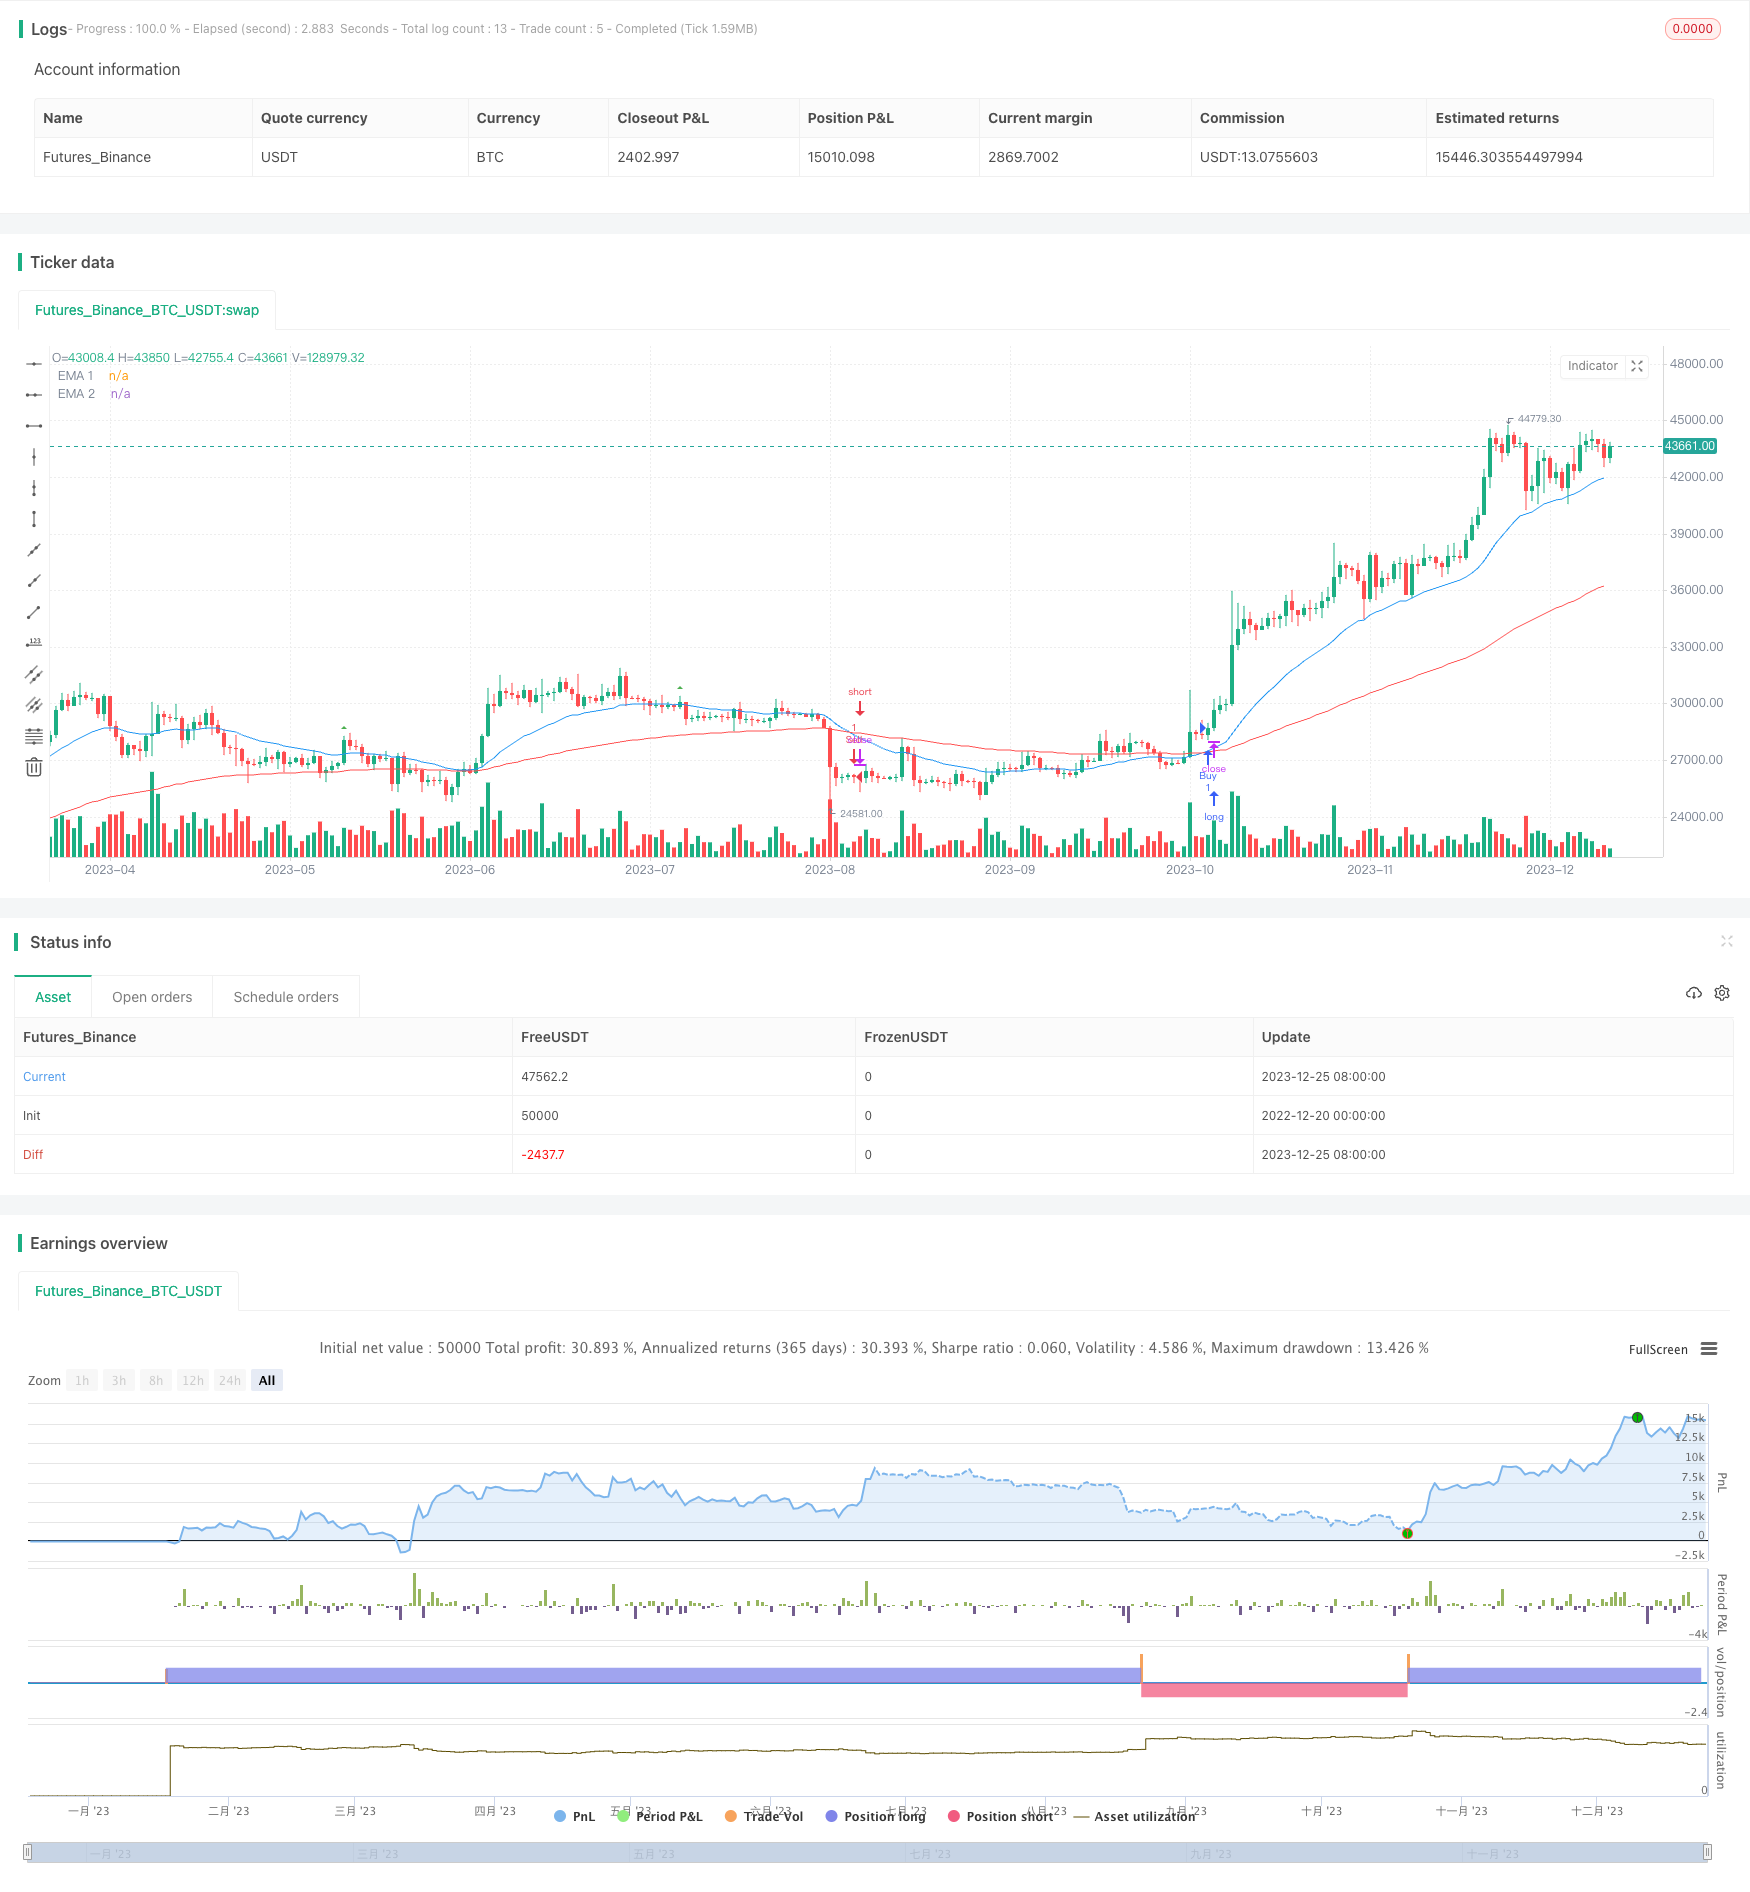
Overview
The Momentum Indicator Crossover Strategy is a trading approach based on the combination of Exponential Moving Average (EMA) and Relative Strength Index (RSI) signals. Designed to leverage buy and sell signals based on the crossover of two EMA lines, this strategy offers simplicity and effectiveness in managing trades in the financial markets.
Strategy Principle
The core of this strategy is the crossover system of fast and slow EMA lines. The strategy defines three EMA lines with different parameters: ema1, ema2 and ema3. Among them, ema1 represents short-term trend, ema2 represents medium-term trend, and ema3 represents long-term trend. When the short-term trend crosses above the medium-term trend, a buy signal is generated. When the short-term trend falls below the medium-term trend, a sell signal is generated.
To filter false signals, the strategy also defines two additional conditions: bodybar1 > bodybar2 and close > entrybar (for buy signal) or close < entrybar (for sell signal). This ensures that the recent two candlesticks meet the direction of the signal, and the price breaks through the entry point to avoid redundant entry.
In addition, the strategy incorporates the RSI indicator to evaluate overbought and oversold conditions. The overbought area of RSI is used to define excessive buying signals, while the oversold area is used to define excessive selling signals. This helps avoid wrong signals in overheated and over-cooled markets.
Advantage Analysis
The advantages of this strategy include:
- Simple and easy to use. Users do not need to grasp complex indicators.
- Flexible position sizing based on percentage of invested capital.
- EMA crossover combined with RSI filter improves signal reliability.
- Clear trading logic, easy to understand and adjust.
Risk Analysis
The risks of this strategy include:
- EMA crossovers cannot fully filter market noise and can easily generate false signals.
- Fixed parameter EMA lines cannot adapt to market changes in real time.
- No stop loss logic cannot control single loss.
- RSI filter conditions are too simple, possibly missing opportunities.
Optimization Directions
The strategy can be optimized in the following aspects:
- Set adaptive EMA parameters based on market volatility and trading products to improve parameter timeliness.
- Incorporate multiple filters such as MACD, Bollinger Bands, etc. to reduce false signals.
- Add tracking stop loss, take profit functions to control trading risks.
- Optimize RSI filter logic to improve overall strategy stability.
- Dynamically optimize strategy parameters with machine learning techniques.
Conclusion
The Momentum Indicator Crossover Strategy integrates the strengths of EMA and RSI and forms trading signals based on indicator crossovers. The strategy is simple and practical, suitable for beginners, and can also be expanded and optimized according to actual needs to improve strategy performance. With strict risk management, the strategy promises stable excess returns.
Parameters
| Name | Default | What it controls |
|---|---|---|
| v_input_1 | true | Position Size (%) |
| v_input_int_1 | 25 | EMA 1 |
| v_input_2_close | 0 | Source: close | high | low | open | hl2 | hlc3 | hlcc4 | ohlc4 |
| v_input_int_2 | 100 | EMA 2 |
| v_input_3_close | 0 | Source: close | high | low | open | hl2 | hlc3 | hlcc4 | ohlc4 |
| v_input_int_3 | 200 | EMA 3 |
| v_input_4_close | 0 | Source: close | high | low | open | hl2 | hlc3 | hlcc4 | ohlc4 |
| v_input_5 | 14 | RSI length |
Source Pine Script
/*backtest
start: 2022-12-20 00:00:00
end: 2023-12-26 00:00:00
period: 1d
basePeriod: 1h
exchanges: [{"eid":"Futures_Binance","currency":"BTC_USDT"}]
*/

//@version=5
strategy('EMA Crossover Strategy', shorttitle='EMA Crossover', overlay=true)


// Define input for position size as a percentage of equity
position_size_pct = input(1, title='Position Size (%)') / 100

//Input EMA
len1 = input.int(25, minval=1, title='EMA 1')
src1 = input(close, title='Source')
ema1 = ta.ema(src1, len1)
len2 = input.int(100, minval=1, title='EMA 2')
src2 = input(close, title='Source')
ema2 = ta.ema(src2, len2)
len3 = input.int(200, minval=1, title='EMA 3')
src3 = input(close, title='Source')
ema3 = ta.ema(src3, len3)
//End of format

//Format RSI
lenrsi = input(14, title='RSI length')
outrsi = ta.rsi(close,lenrsi)
//plot(outrsi, title='RSI', color=color.new(color.blue, 0), linewidth=1)

//hline(70, 'Overbought', color=color.red)
//hline(30, 'Oversold', color=color.green)
//End of format


bodybar1 = math.abs(close - open)
bodybar2 = math.abs(close[1] - open[1])
// Plot the EMAs
plot(ema1, color=color.new(color.blue, 0), title='EMA 1')
plot(ema2, color=color.new(color.red, 0), title='EMA 2')
//plot(ema3, color=color.new(#ffffff, 0), title='EMA 3')

// EMA Crossover conditions
emaCrossoverUp = ta.crossover(ema1, ema2)
emaCrossoverDown = ta.crossunder(ema1, ema2)

var entrybar = close  // Initialize entrybar with the current close


// Calculate crossovers outside of the if statements
emaCrossoverUpOccured = ta.crossover(close, ema1) and ema1 > ema2 and bodybar1 > bodybar2 and close > entrybar
emaCrossoverDownOccured = ta.crossunder(close, ema1) and ema1 < ema2 and bodybar1 > bodybar2 and close < entrybar

plotshape(series=emaCrossoverUpOccured, location=location.abovebar, color=color.new(color.green, 0), style=shape.triangleup, title='New Buy Order', size=size.tiny)
plotshape(series=emaCrossoverDownOccured, location=location.belowbar, color=color.new(color.red, 0), style=shape.triangledown, title='New Sell Order', size=size.tiny)

// Define trading logic with custom position size and RSI conditions
if emaCrossoverUp or emaCrossoverUpOccured
    strategy.entry('Buy', strategy.long)
    entrybar := close  // Update entrybar when entering a new buy position
    entrybar

if emaCrossoverDown or emaCrossoverDownOccured
    strategy.entry('Sell', strategy.short)
    entrybar := close  // Update entrybar when entering a new sell position
    entrybar
Published by ChaoZhang on the FMZ strategy square · last modified 2023-12-27. Collected in the Quant Trading Vault. Unvalidated research: re-test with your own data and costs before trusting it.
Build this with AgenKit
A spec is not a trading system. Paste this into your coding agent and AgenKit runs a specialist team — architecture, test-first build, risk gates, review — with paper trading on by default.
/agenkit build a production-grade trading bot with a backtest engine, risk controls and paper trading by default from strategies/Momentum-Indicator-Crossover-Strategy.md- npx agenkit install engineering-kit in your project
- Paste the command into your agent and approve each phase
- Get tests, backtest, risk controls and a paper-trading switch
Understand it first
Before you run this, read the lesson behind the idea and how to backtest it honestly. Specs like this one are the survivors of an unknown number of trials; deflate their results accordingly.
Related specs
- Advanced Multi Indicator Trend Following and Momentum Quantitative Trading StrategyPine Script · Momentum · 1h
- Momentum Indicator Aggregation Trading StrategyPine Script · Momentum · 1h
- Multi Indicator Trend Momentum Trading Strategy An Optimized Quantitative Trading System Based on Bollinger Bands Fibonacci and ATRPine Script · Momentum · 1h
- Multi Trend Momentum Crossover Strategy with Volatility Optimization SystemPine Script · Momentum · 1d
- Momentum Oscillation Crossing Bollinger Bands with Moving Average StrategyPine Script · Momentum · 1d
- Schaff Trend Cycle Momentum Following StrategyPine Script · Momentum · 1h