Momentum Inversion Tracking Strategy
This strategy uses the Parabolic SAR indicator to identify turning points in stock price trends and enters long or short positions when reversals occur. It can automatically detect upward and downward momentum in…
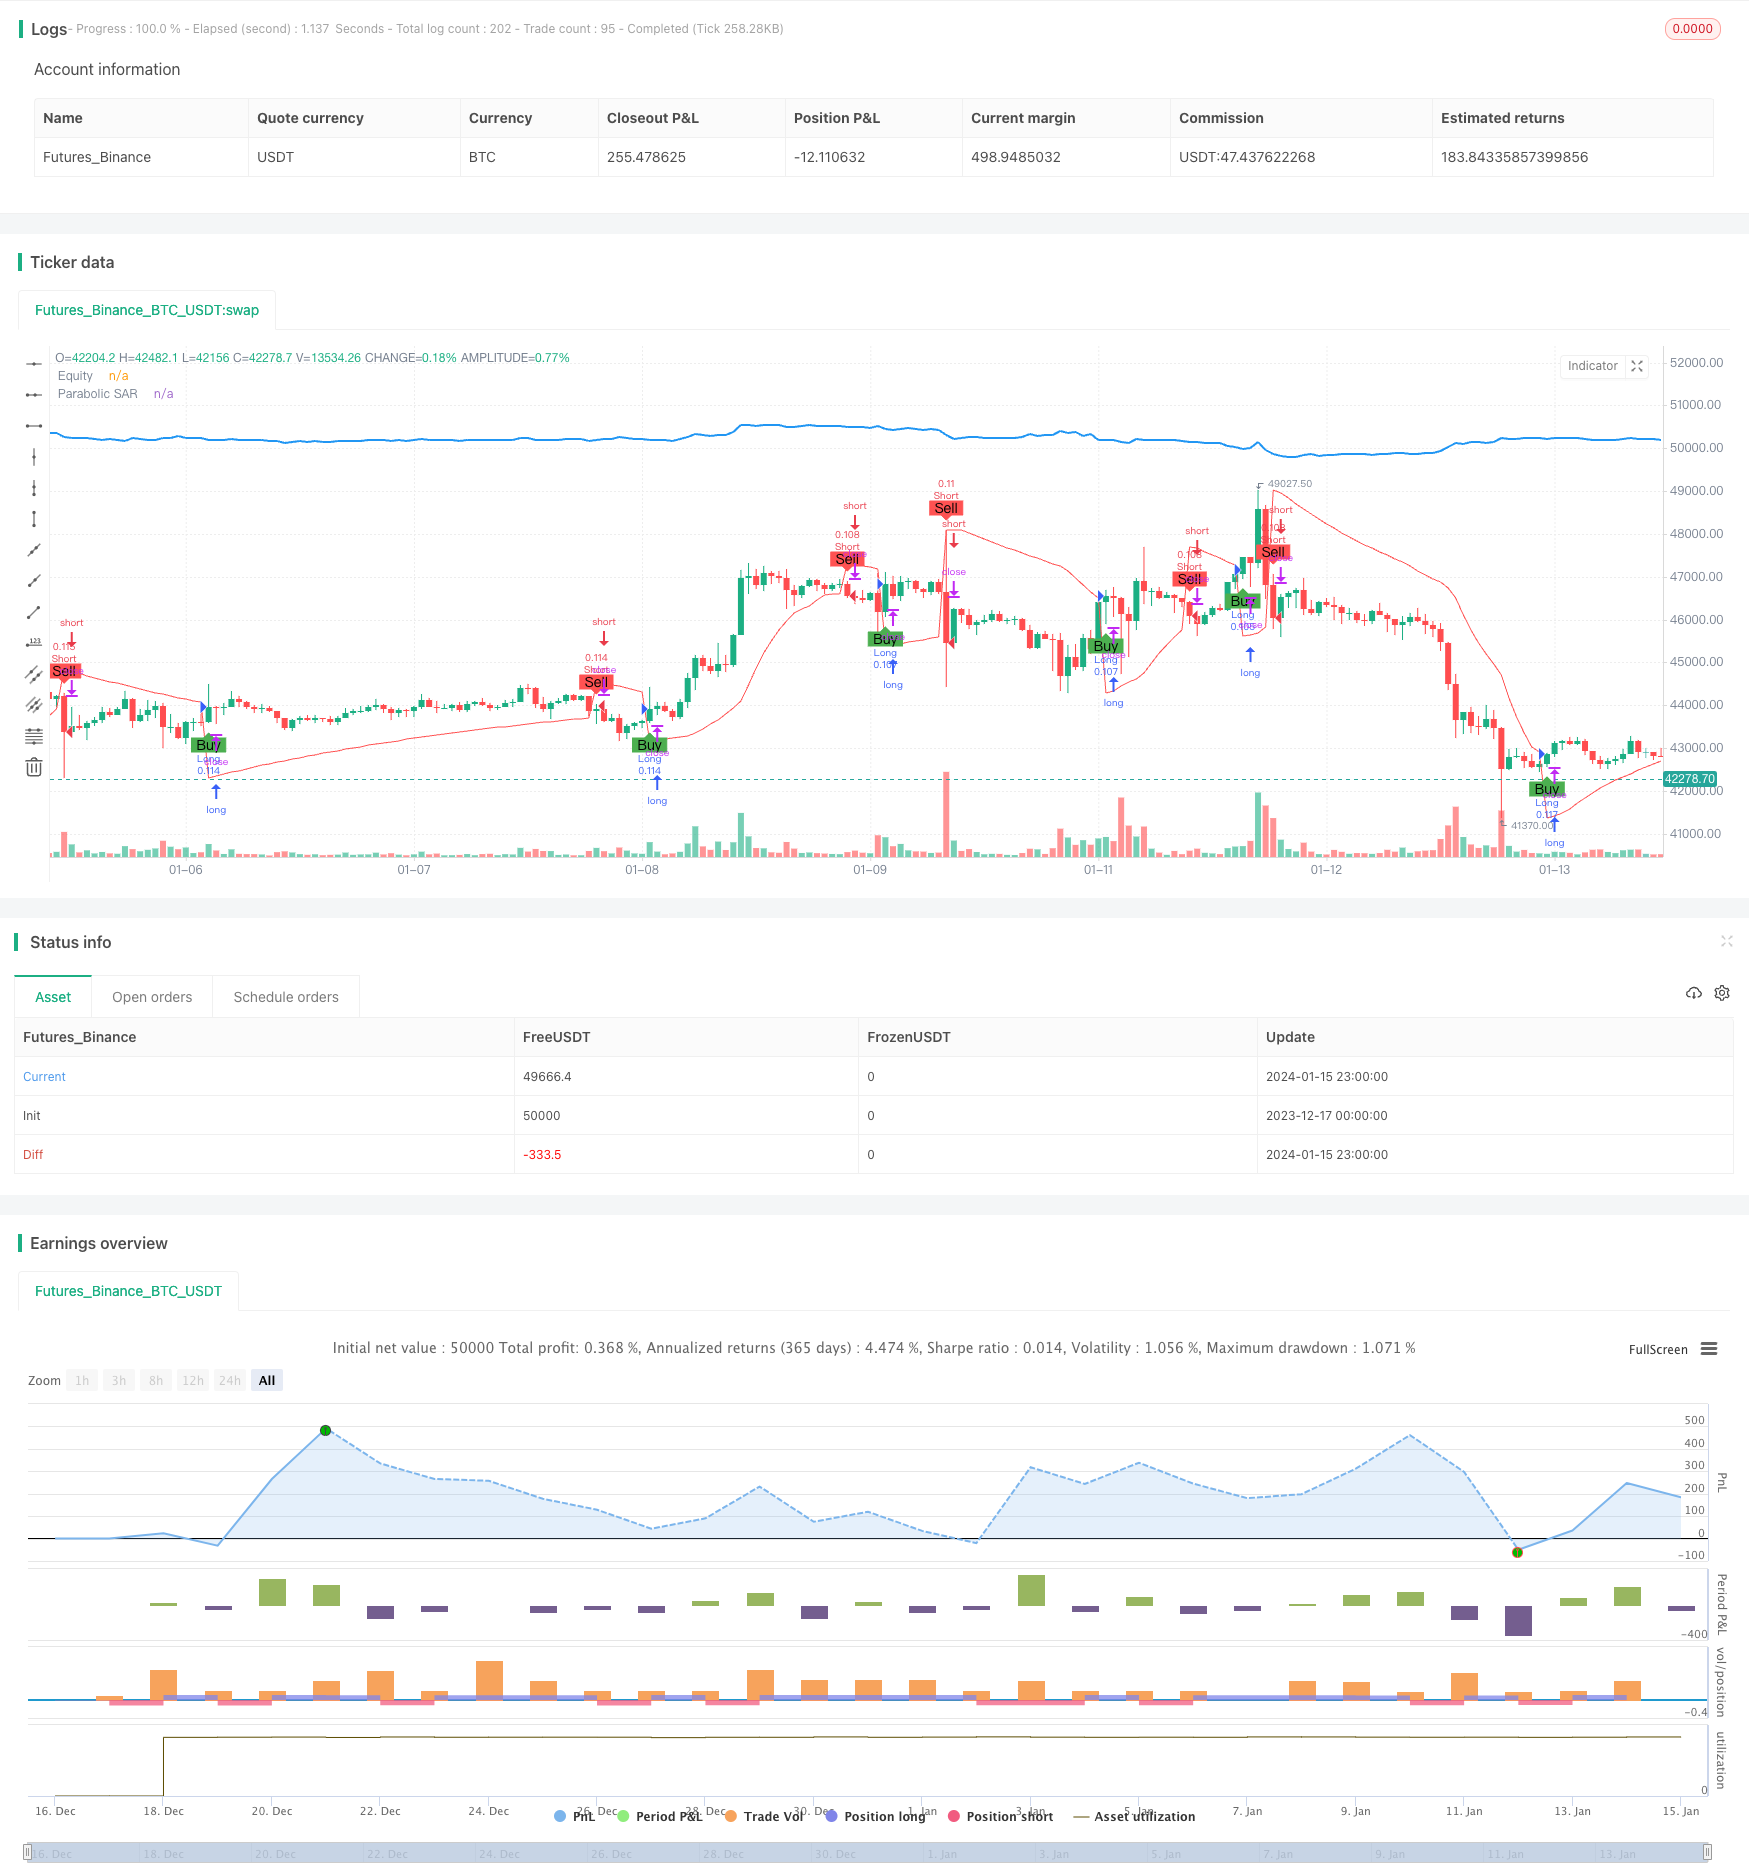
Overview
This strategy uses the Parabolic SAR indicator to identify turning points in stock price trends and enters long or short positions when reversals occur. It can automatically detect upward and downward momentum in stock prices and adjust positions accordingly.
Strategy Logic
The core indicator of this strategy is Parabolic SAR. This indicator can identify upward and downward trends in stock prices. When prices rise, the SAR dots stay below the prices. When prices fall, the SAR dots jump above the prices. The strategy detects crossover between price and SAR dots as trading signals. Specifically, when the price line crosses above the SAR dots from below, a long entry signal is generated. When the price line crosses below the SAR dots from above, a short entry signal is triggered.
The long condition is: close above sar, indicating the price line has crossed above the SAR dots from below, a long signal. The short condition is: close below sar, indicating the price line has crossed below the SAR dots from above, a short signal. So the core logic of this strategy is to track inversion points in price momentum and trade on crossovers.
Advantages
The biggest advantage of this strategy is it can automatically identify turning points in price trends without manual interference, avoiding common mistakes like chasing peaks and killing dips. The Parabolic SAR is a reliable trend identification indicator, which reduces trading mistakes.
Besides, SAR reacts sensitively to price changes, capturing minor pullbacks in time. This is important for strategies targeting high win rate and frequent trading. So the strategy can adjust positions automatically to avoid being trapped in significant pullbacks.
Risks
The major risk is SAR may overreact to minor price oscillations, generating false signals and causing over-trading, increasing costs and slippage.
Also, in strong uptrends or downtrends, the SAR parameters like starting and increment values could impact the accuracy and timeliness of catching trend reversals. Careful parameter tuning is important.
Inappropriate position sizing, over-reacting to SAR signals can lead to fluctuating exposure, increasing practical difficulties in trading.
Enhancement
The strategy can be optimized in the following aspects:
Optimize SAR parameters for higher accuracy of signals
Add filters to avoid false signals caused by SAR
Employ proper position sizing and stop loss to control risks
Incorporate trend filters to avoid whipsaws in ranging markets
Optimize entry and exit prices considering costs and slippage to improve efficiency
Conclusion
The strategy mainly relies on SAR to determine trend reversal points. It has reliable trend identification capability. When optimized, it can serve as an effective trend following strategy by automatically adjusting positions to capture directional price movements. But position churning should be controlled and risk of false signals should be mitigated.
Parameters
| Name | Default | What it controls |
|---|---|---|
| v_input_1 | 0.02 | Start |
| v_input_2 | 0.02 | Increment |
| v_input_3 | 0.2 | Maximum |
Source Pine Script
/*backtest
start: 2023-12-17 00:00:00
end: 2024-01-16 00:00:00
period: 1h
basePeriod: 15m
exchanges: [{"eid":"Futures_Binance","currency":"BTC_USDT"}]
*/

//@version=5
strategy("Parabolic SAR Strategy", shorttitle="PSAR", overlay=true, default_qty_type=strategy.percent_of_equity, default_qty_value=10)

// Parabolic SAR settings
start = input(0.02, title="Start")
increment = input(0.02, title="Increment")
maximum = input(0.2, title="Maximum")

// Calculate Parabolic SAR
sar = ta.sar(start, increment, maximum)

// Plot Parabolic SAR on the chart
plot(sar, color=color.red, title="Parabolic SAR")

// Strategy logic
longCondition = ta.crossover(close, sar)
shortCondition = ta.crossunder(close, sar)

// Execute strategy orders
strategy.entry("Long", strategy.long, when=longCondition)
strategy.entry("Short", strategy.short, when=shortCondition)

// Plot buy and sell signals on the chart
plotshape(series=longCondition, title="Buy Signal", color=color.green, style=shape.labelup, location=location.belowbar, text="Buy")
plotshape(series=shortCondition, title="Sell Signal", color=color.red, style=shape.labeldown, location=location.abovebar, text="Sell")

// Calculate equity manually
equity = strategy.equity
equity_str = str.tostring(equity)
equity_plot = plot(equity, title="Equity", color=color.blue, linewidth=2)

// Update equity plot only on bar close to avoid repainting issues
label.new(bar_index, na, text=equity_str, style=label.style_none, color=color.blue, yloc=yloc.abovebar)
Published by ChaoZhang on the FMZ strategy square · last modified 2024-01-17. Collected in the Quant Trading Vault. Unvalidated research: re-test with your own data and costs before trusting it.
Build this with AgenKit
A spec is not a trading system. Paste this into your coding agent and AgenKit runs a specialist team — architecture, test-first build, risk gates, review — with paper trading on by default.
/agenkit build a production-grade trading bot with a backtest engine, risk controls and paper trading by default from strategies/Momentum-Inversion-Tracking-Strategy.md- npx agenkit install engineering-kit in your project
- Paste the command into your agent and approve each phase
- Get tests, backtest, risk controls and a paper-trading switch
Understand it first
Before you run this, read the lesson behind the idea and how to backtest it honestly. Specs like this one are the survivors of an unknown number of trials; deflate their results accordingly.
Related specs
- Advanced Multi Indicator Trend Following and Momentum Quantitative Trading StrategyPine Script · Momentum · 1h
- Momentum Trend Following Dual Indicator MACD and Parabolic SAR Combination StrategyPine Script · Momentum · 1d
- Vishal Adaptive Multi Indicator Trading StrategyPine Script · Momentum · 2d
- Multi Indicator Comprehensive Analysis Quantitative Trading Strategy Trend Momentum and Volatility Collaborative Prediction ModelPine Script · Momentum · 3m
- Stochastic RSI Momentum Oscillation Trading StrategyPine Script · Momentum · 1h
- Momentum Tracking Stop Loss StrategyPine Script · Momentum · 4h