Momentum Market Sentiment Indicator Strategy
This strategy reveals market sentiment by comparing price changes to volume, and presents it in a MACD format to generate trading signals.
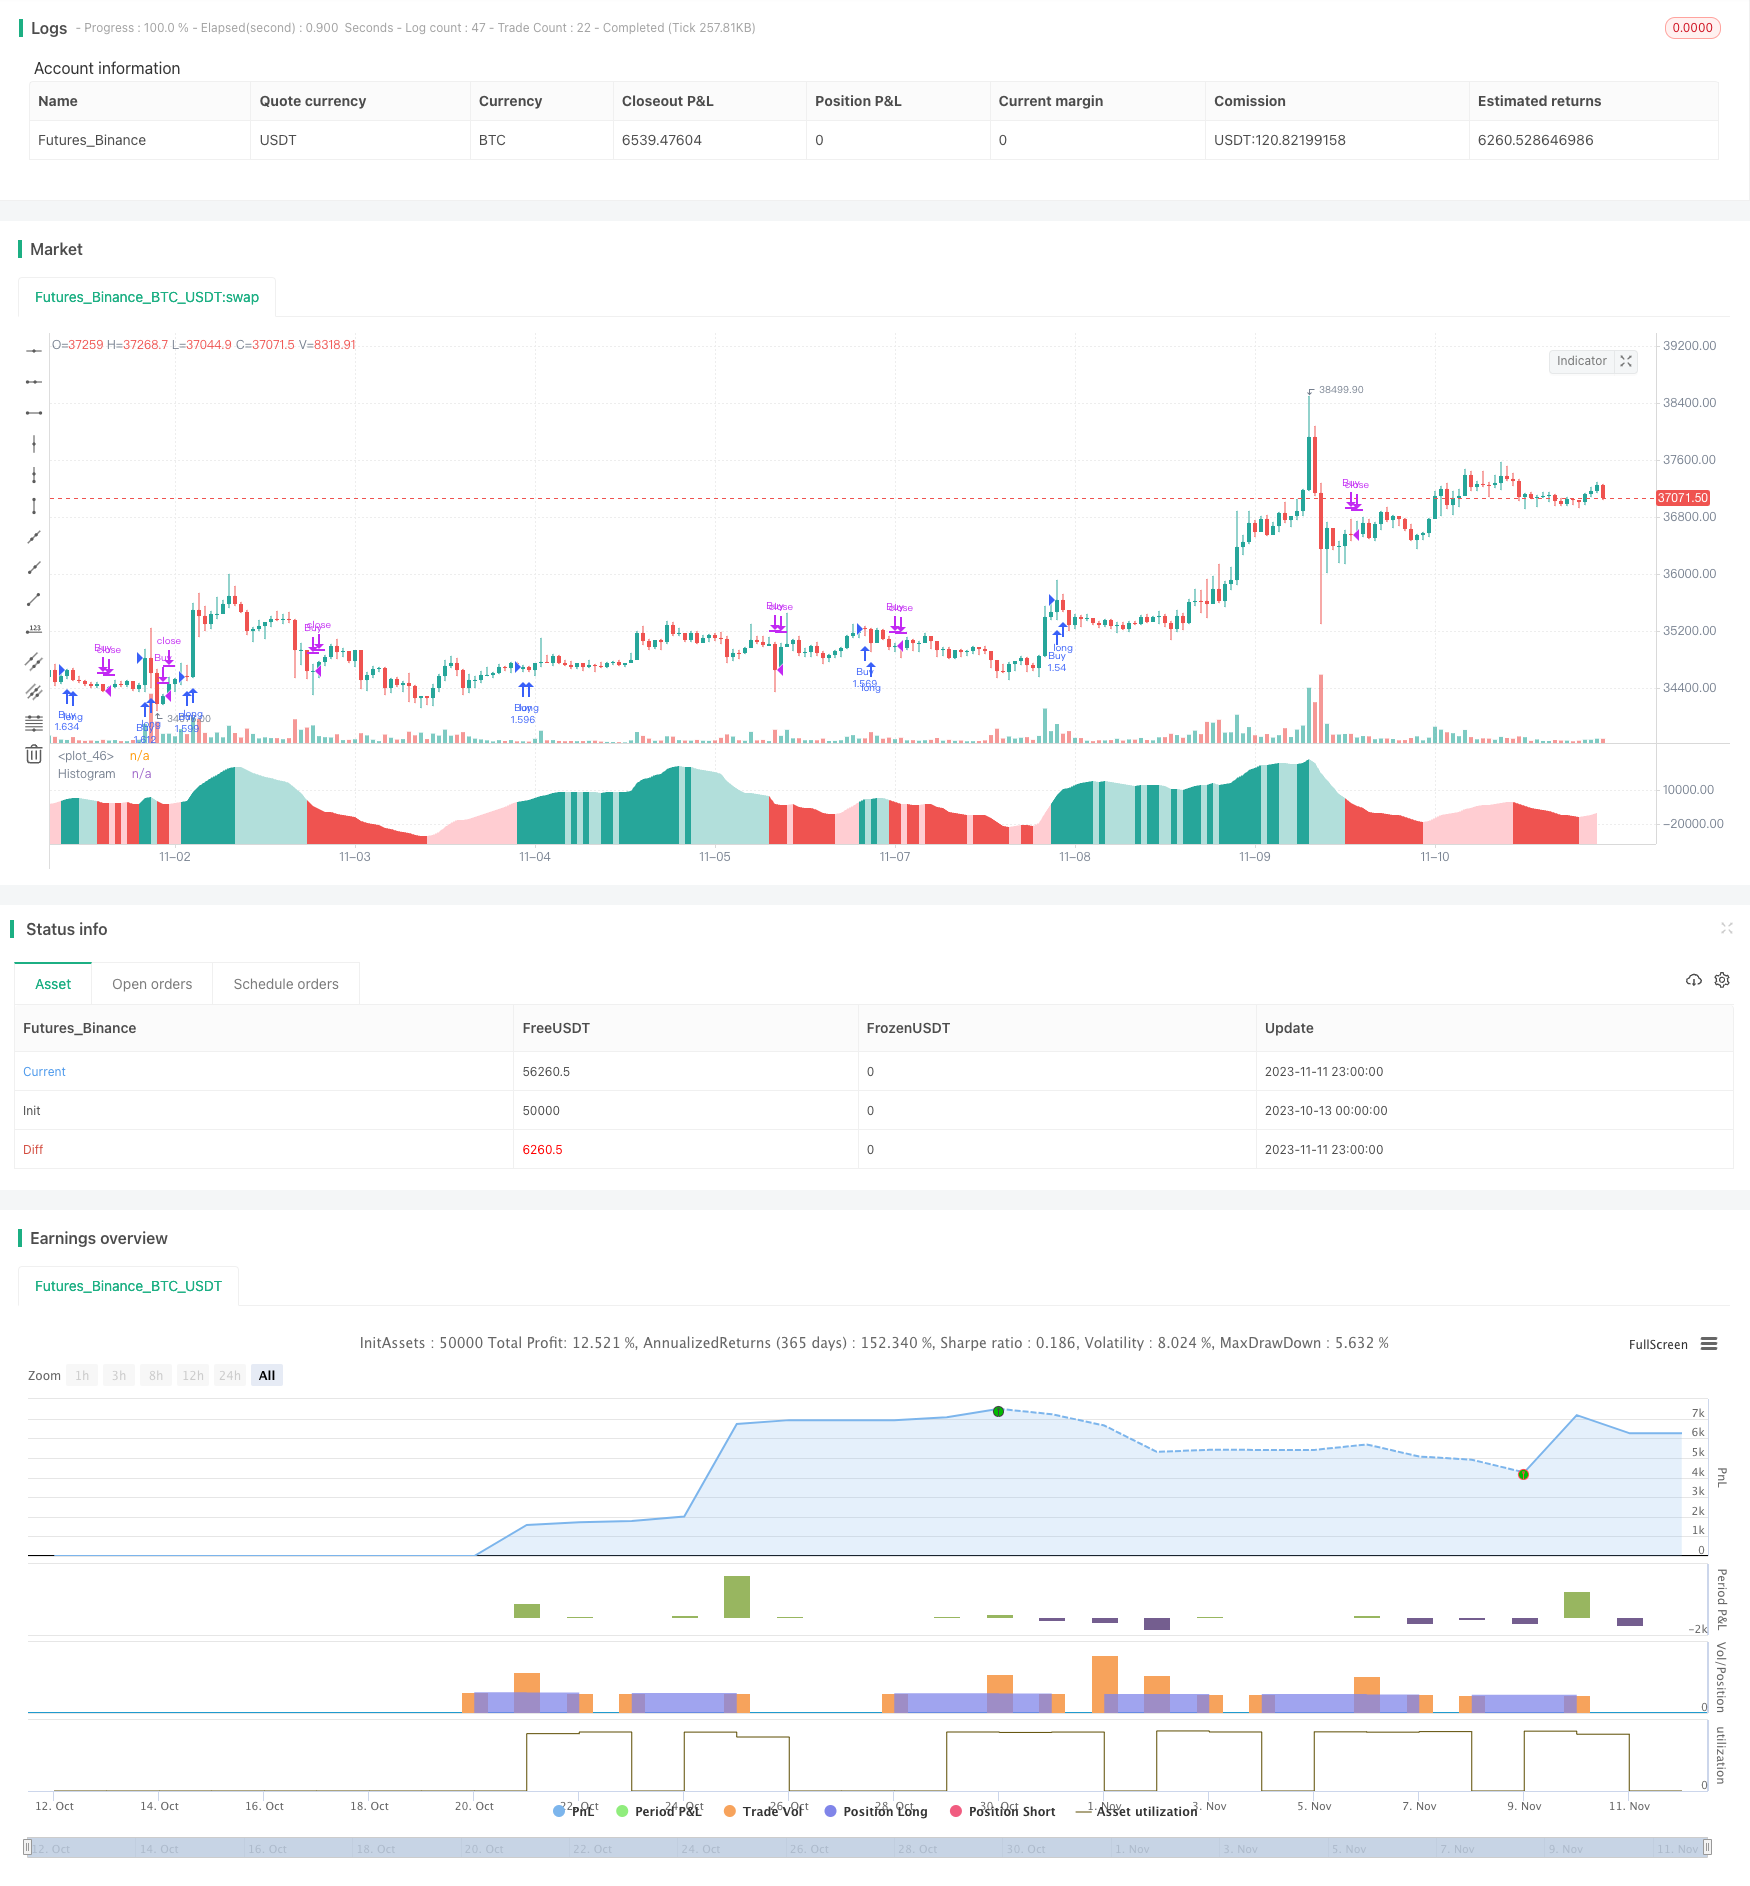
Overview
This strategy reveals market sentiment by comparing price changes to volume, and presents it in a MACD format to generate trading signals.
Strategy Logic
The strategy mainly uses the following methods to reveal market sentiment:
Price change per volume of each bar. This directly shows the strength of buying and selling forces.
Apply exponential moving averages to price change and volume separately, then divide the EMA of price change by the EMA of volume. This filters out some noise and results in a smoother "market sentiment" curve.
Apply fast and slow EMAs on "market sentiment" to get MACD-like lines. The MACD line shows momentum direction and strength, the signal line is its moving average, and the histogram shows their difference, representing momentum change.
The histogram crossing above 0 signals increasing bullish sentiment, while crossing below 0 signals increasing bearish sentiment. Divergences on the histogram can also be observed.
Advantage Analysis
The strategy has the following advantages:
Uses volume information to judge market sentiment, more convincing.
MACD form is intuitive and easy to use.
Customizable parameters for different products and timeframes.
Can detect divergences on histogram to find potential trend reversals.
Clear code structure, easy to understand and optimize.
Risk Analysis
The strategy also has the following risks:
Volume reflects sentiment but does not guarantee correct signals. Need to combine with price action.
Improper MACD parameter setting may cause missed or false signals. Parameters need to be optimized for specific products and timeframes.
Divergences may be false signals, unable to confirm trend reversals, so need to be interpreted carefully.
Risk of late entry and being trapped. Can wait for trailing stop loss or validate with trends and related products.
Optimization Directions
The strategy can be optimized in the following aspects:
Test combinations of parameters on different products and timeframes to find optimal parameters.
Add stop loss to reduce loss risk.
Combine with related product price trends to validate signals.
Use machine learning to dynamically optimize parameters.
Add filters to reduce false signals, e.g. higher timeframe trends, volatility, etc.
Conclusion
The strategy judges market sentiment by comparing price change and volume, and generates signals in a MACD format. Considering volume in addition to just price can more accurately determine the strength of buyers and sellers. The parameters can be optimized for different products and timeframes, with further optimization potential. Overall, the strategy has a novel idea, easy to use, effectively captures market momentum, and is worth further development.
Parameters
| Name | Default | What it controls |
|---|---|---|
| v_input_1 | 49 | Market Sentiment Lookback Length |
| v_input_2 | 40 | Fast EMA Length |
| v_input_3 | 204 | Slow EMA Length |
| v_input_4 | 20 | Signal Length |
| v_input_5 | false | Show Market Sentiment? |
| v_input_6 | true | Show Momentum? |
| v_input_7 | false | Show MACD Line? |
| v_input_8 | false | Show Signal Line? |
| v_input_9 | false | (Show Change/Volume for Each Bar?) |
| v_input_10 | false | (Show Fast EMA?) |
| v_input_11 | false | (Show Slow EMA?) |
Source Pine Script
/*backtest
start: 2023-10-13 00:00:00
end: 2023-11-12 00:00:00
period: 1h
basePeriod: 15m
exchanges: [{"eid":"Futures_Binance","currency":"BTC_USDT"}]
*/

// This source code is subject to the terms of the Mozilla Public License 2.0 at https://mozilla.org/MPL/2.0/
// © dannylimardi

//@version=4
strategy("Sentiment Oscillator", "Sentiment", overlay=false, initial_capital=100, default_qty_type=strategy.percent_of_equity, default_qty_value=100, commission_type=strategy.commission.percent, commission_value=0.08)


//Inputs
msLen = input(49, type=input.integer, title="Market Sentiment Lookback Length")
emaLen1 = input(40, type=input.integer, title="Fast EMA Length")
emaLen2 = input(204, type=input.integer, title="Slow EMA Length")
signalLen = input(20, type=input.integer, title="Signal Length")
showMs = input(false, type=input.bool, title="Show Market Sentiment?")
showHist = input(true, type=input.bool, title="Show Momentum?")
showMacd = input(false, type=input.bool, title="Show MACD Line?")
showSignal = input(false, type=input.bool, title="Show Signal Line?")
showCpv = input(false, type=input.bool, title="(Show Change/Volume for Each Bar?)")
showEma1 = input(false, type=input.bool, title="(Show Fast EMA?)")
showEma2 = input(false, type=input.bool, title="(Show Slow EMA?)")

//Calculations
priceChange = close - close[1]
changePerVolume = (priceChange/volume) * 10000000  // (The 1000000 doesn't have any significance, it's just to avoid color-change errors when the values are too emall.)
priceChangeEma = ema(priceChange, msLen)
volumeEma = ema(volume, msLen)
marketSentiment = priceChangeEma/volumeEma * 100000000
msEma1 = ema(marketSentiment, emaLen1)
msEma2 = ema(marketSentiment, emaLen2)
macd = msEma1-msEma2
signal = ema(macd, signalLen)
hist = macd-signal

//Plot colors
col_grow_above = #26A69A
col_grow_below = #FFCDD2
col_fall_above = #B2DFDB
col_fall_below = #EF5350
col_macd = #0094ff
col_signal = #ff6a00

//Drawings
plot(showHist ? hist : na, title="Histogram", style=plot.style_area, color=(hist>=0 ? (hist[1] < hist ? col_grow_above : col_fall_above) : (hist[1] < hist ? col_grow_below : col_fall_below)), transp=0 )
plot(showMacd ? macd : na, title="MACD", color=col_macd, transp=0)
plot(showSignal ? signal : na, title="Signal", color=col_signal, transp=0)
plot(showCpv ? changePerVolume : na, color=changePerVolume > changePerVolume[1] ? color.teal : color.red)
plot(0, color=color.white, transp=80)
plot(showEma1 ? msEma1 : na, color=color.aqua)
plot(showEma2 ? msEma2 : na, color=color.yellow)
plot(showMs ? marketSentiment : na, color=color.lime)

//Strategy
strategy.entry("Buy", strategy.long, when=crossover(hist, 0))
strategy.close("Buy", when=crossunder(hist, 0))Published by ChaoZhang on the FMZ strategy square · last modified 2023-11-13. Collected in the Quant Trading Vault. Unvalidated research: re-test with your own data and costs before trusting it.
Build this with AgenKit
A spec is not a trading system. Paste this into your coding agent and AgenKit runs a specialist team — architecture, test-first build, risk gates, review — with paper trading on by default.
/agenkit build a production-grade trading bot with a backtest engine, risk controls and paper trading by default from strategies/Momentum-Market-Sentiment-Indicator-Strategy.md- npx agenkit install engineering-kit in your project
- Paste the command into your agent and approve each phase
- Get tests, backtest, risk controls and a paper-trading switch
Understand it first
Before you run this, read the lesson behind the idea and how to backtest it honestly. Specs like this one are the survivors of an unknown number of trials; deflate their results accordingly.
Related specs
- Advanced Multi Indicator Trend Following and Momentum Quantitative Trading StrategyPine Script · Momentum · 1h
- KST EMA Momentum Trend Following StrategyPine Script · Momentum · 1d
- MACD Indicator Driven OBV Quant Trading StrategyPine Script · Momentum · 1h
- MACD Momentum Indicator Backtest StrategyPine Script · Momentum · 1h
- MACD of Relative Strength StrategyPine Script · Momentum · 1d
- Momentum Exponential Moving Average Crossover Trading StrategyPine Script · Momentum · 1d