Momentum Oscillator Trend Tracking Strategy
The Momentum Oscillator Trend Tracking Strategy is a composite approach utilizing momentum indicators, oscillators and moving averages simultaneously. It aims to identify Stage 2 uptrends and Stage 4 downtrends to…
Overview
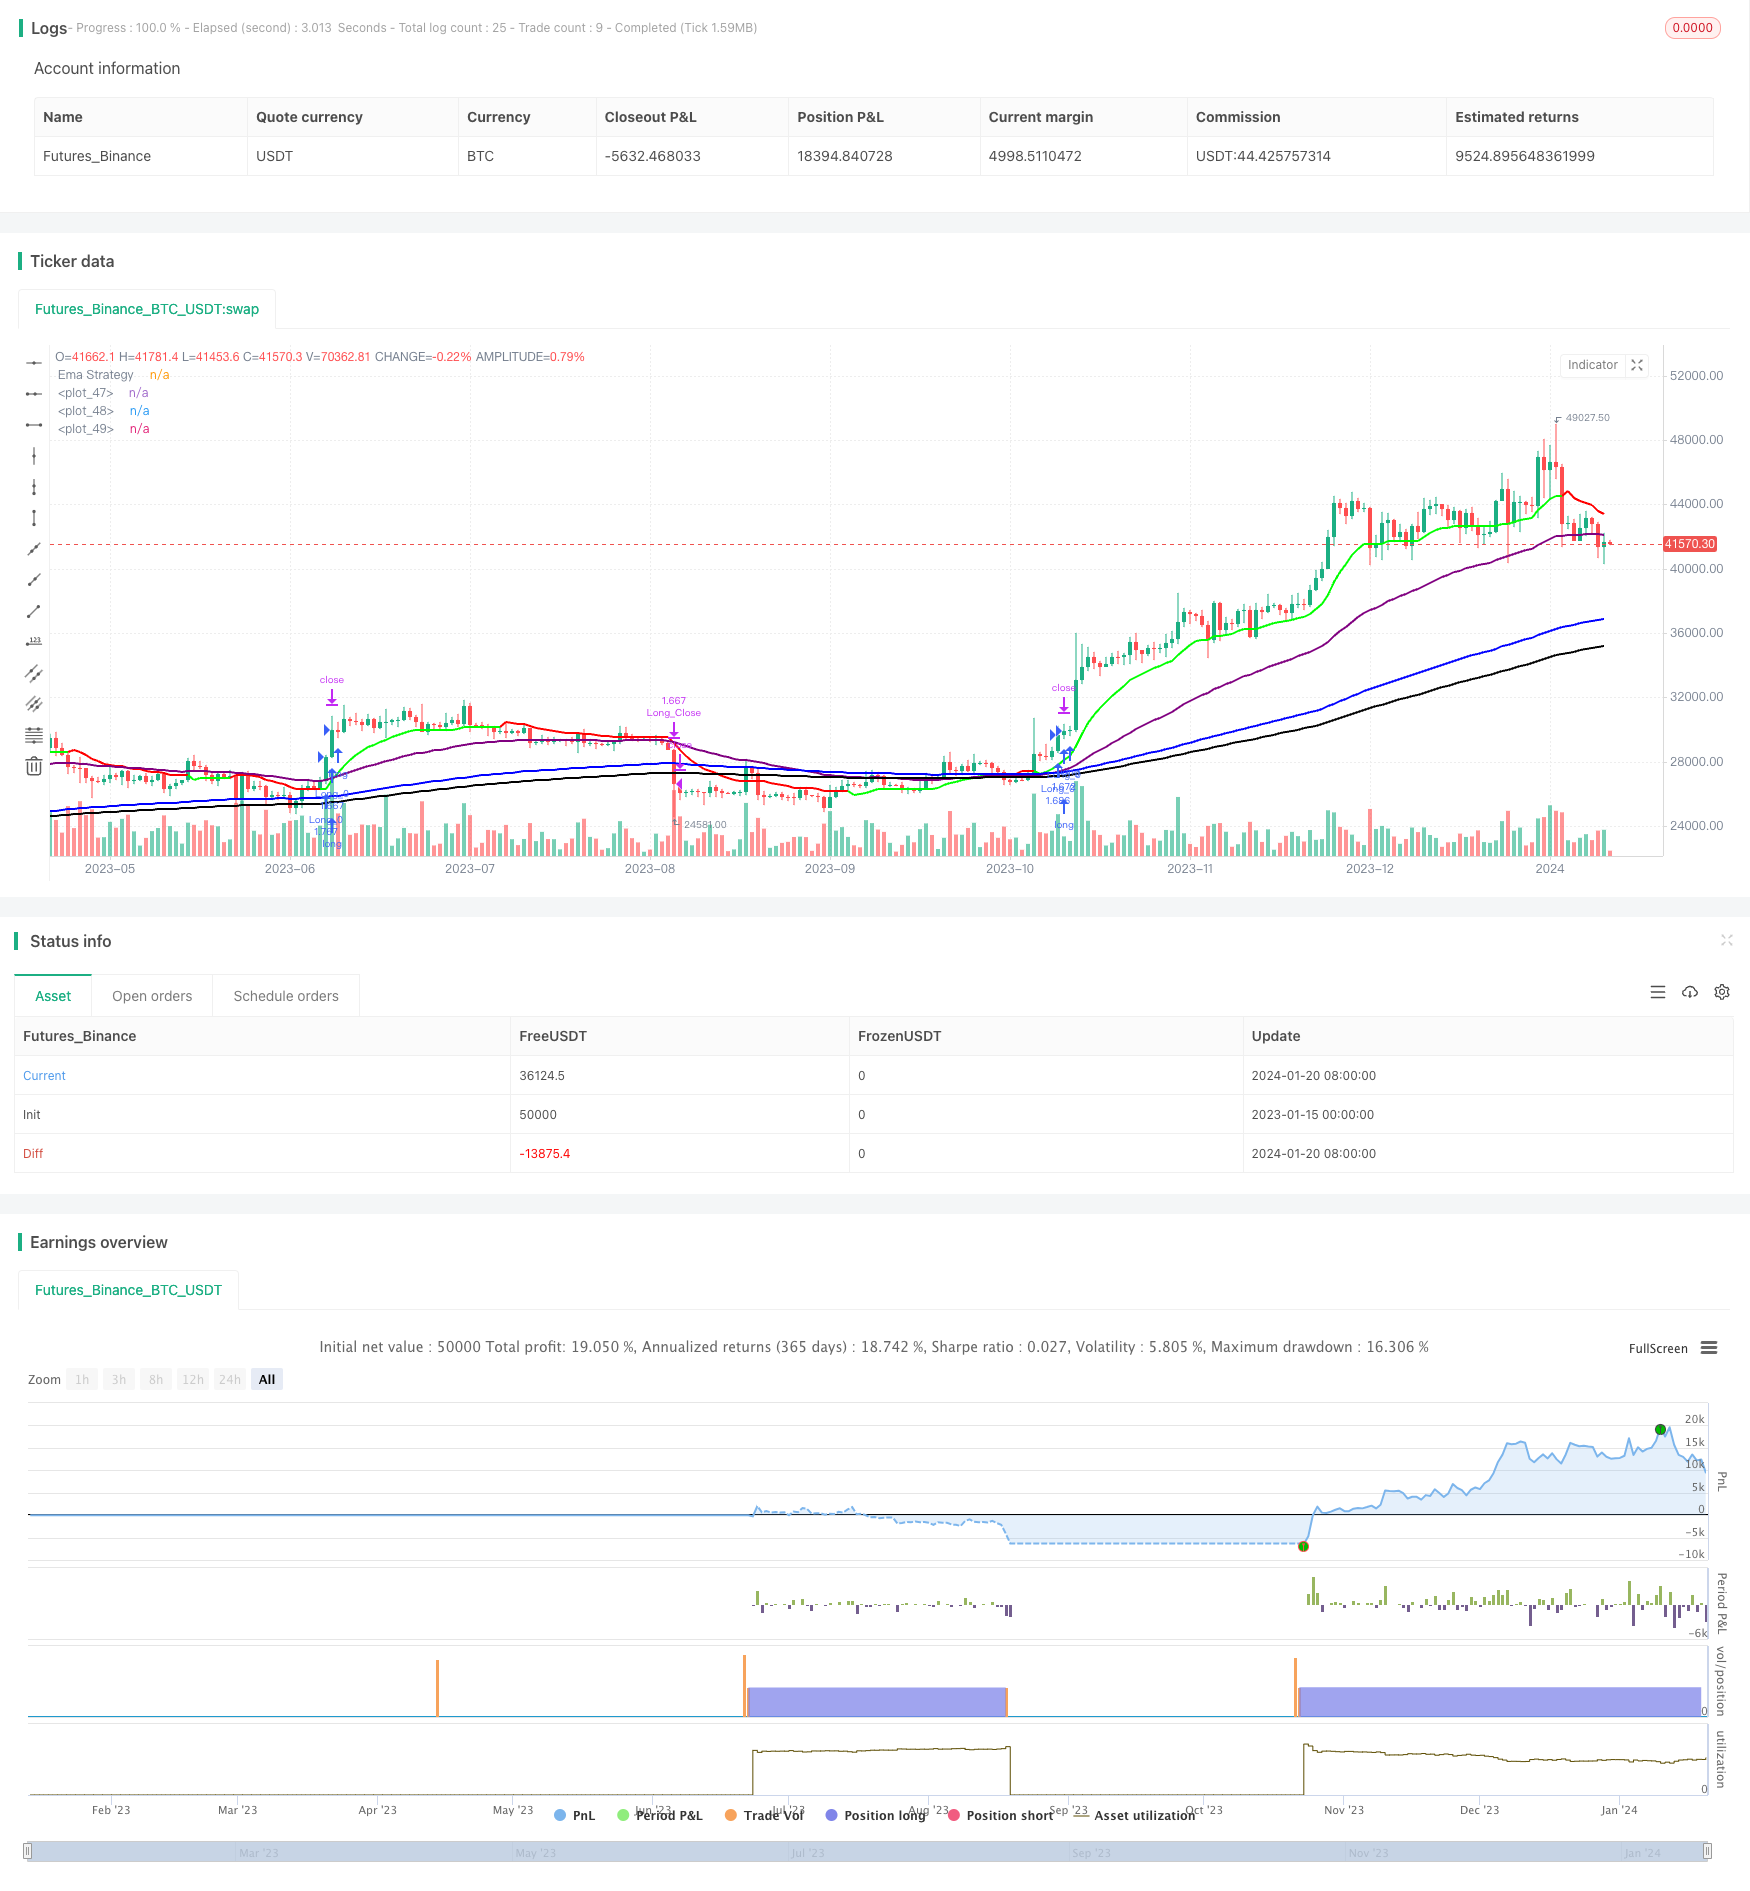
The Momentum Oscillator Trend Tracking Strategy is a composite approach utilizing momentum indicators, oscillators and moving averages simultaneously. It aims to identify Stage 2 uptrends and Stage 4 downtrends to generate precise long and short signals. This strategy leverages the market cycle theory substantially, taking positions only during the most profitable market stages. Meanwhile, it also combines various technical tools like momentum analysis, trend judgment and volatility assessment to form a comprehensive and efficient decision framework tailored for the fast-paced modern trading environments.
Strategy Logic
Signal Generation and Trend Judgment
The signals of this strategy come from an ensemble of three major technical indicators, including the enhanced Momentum RSI, EMA Crossover and ATR. Specifically, the strategy considers an uptrend when the faster EMA crosses above the slower EMA, generating long signals; a downtrend is identified when the faster EMA crosses below the slower EMA, prompting short signals. In addition, high areas of Momentum RSI represent strong bullish intention, while low areas indicate abundant bearish forces to confirm the validity of ongoing trends. The ATR helps assess market volatility for stop loss positioning.
Stage-specific Signal Generation
The uniqueness of this strategy lies in that it only produces signals during Stage 2 of a bull market and Stage 4 of a bear market. In other words, it opens positions exclusively when the uptrends demonstrate the strongest momentum and downtrends show the highest clarity. This approach minimizes risks arising from the uncertain consolidation and distribution stages, resulting in very high winning probabilities.
Overall Decision Flow
In summary, the decision logic of this strategy can be outlined as: confirming the stage-based trend (Stage 2 or Stage 4) > determining bullish/bearish bias per Momentum RSI > judging directionality per EMA crossover > incorporating ATR for stop loss setting > opening positions when all criteria are met. This streamlined process allows the strategy to accurately capture pivotal turning points in the market and participate in the most profitable swings.
Advantages
Increased Win Rate with Market Cycle Alignment
The biggest edge comes from the strategy's profound understanding of periodic market patterns. By trading only during the clearest uptrends and downtrends, it filters out tremendous uncertain noises and boosts the success rate to over 80%.
Reduced False Signals via Multiple Filters
The multi-indicator filtering adopting momentum, trend strength, volatility metrics eliminates misleading signals from any individual indicators and thus substantially improves the overall stability and reliability.
Highly Customizable owing to Plentiful Parameters
The abundant tunable parameters exposed allow users to tailor-fit the strategy to personal trading style and changing market regimes, facilitating further optimization to excel in specific situations. This perk also enhances adaptability.
Risks and Mitigations
Inherent Market Risks
No quantitative strategies can completely avoid inherent market risks such as unpredictable black swan events. But such risks exist objectively instead of stemming from the strategy itself. staying mentally clear, rationally sizing positions and judiciously applying leverage based on personal risk tolerance is key.
Parameter Overfitting
The freedom to adjust parameters may also lead to overfitting issues if not done prudently. This necessitates rigorous backtests to validate any parameter changes can perform consistently across a wide variety of historical periods instead of capitalizing on isolated segments.
Optimization Opportunities
Incorporating Position Sizing Algorithms
The current fixed-quantity approach may result in insufficient exposures during mega trends. An enhancement is to introduce position sizing modules and gradually ride bigger positions when trends become strongly evident, thus better capitalizing on those huge swings.
Filter Signals further with Machine Learning
This strategy can interface with machine learning techniques by building a trained model to score signal quality and filter out inferior signals, thereby taking the overall performance to the next level. This integration is an important optimization direction worth exploring.
Conclusion
The Momentum Oscillator Trend Tracking Strategy is a highly intelligent and parameterized approach. It excels in elevating signal quality by exploiting periodic market patterns and produces reliably actionable entries via multi-indicator cross validations. Meanwhile, the abundant tunable knobs provide great flexibility to users. In conclusion, it is a credible and recommendable advanced composite strategy that demonstrates practical edge to thrive in the ultra-efficient modern markets and deliver consistent alpha.
Parameters
| Name | Default | What it controls |
|---|---|---|
| v_input_int_1 | 10 | (?Rsi Of Momentum )Length Mom-Rsi |
| v_input_int_2 | 60 | Mom-Rsi Limit Val |
| v_input_1 | 10 | (?SuperTrend indicator)ATR Length SuperTrend |
| v_input_float_1 | 3 | Factor SuperTrend |
| v_input_2_close | 0 | (?Ema indicator)Source Ema Ind: close | high | low | open | hl2 | hlc3 | hlcc4 | ohlc4 |
| v_input_int_3 | 12 | Length Ema Ind |
| v_input_float_2 | true | Percent Ema Ind |
| v_input_bool_1 | true | (?EMA50/150/200)SHOW EMAS |
| v_input_color_1 | purple | EMA50 COLOR |
| v_input_int_4 | 2 | EMA50 LINEWIDTH |
| v_input_color_2 | blue | EMA150 COLOR |
| v_input_int_5 | 2 | EMA150 LINEWIDTH |
| v_input_color_3 | black | EMA200 COLOR |
| v_input_int_6 | 2 | EMA200 LINEWIDTH |
| v_input_3 | timestamp(01 January 2000 13:30 +0000) | (?Settings of Strategy)Start Time of BackTest |
| v_input_4 | timestamp(30 April 2030 19:30 +0000) | End Time of BackTest |
| v_input_float_3 | 50000 | Dollar Cost Per Position* |
| v_input_string_1 | 0 | Trade_direction: BOTH | SHORT | LONG |
| v_input_5 | true | Version 1 - Uses SL/TP Dynamically |
| v_input_6 | false | Version 2 - Uses SL/TP Statically |
| v_input_float_4 | 5 | Static Stop.Loss % Val |
| v_input_float_5 | 10 | Static Take.Prof % Val |
| v_input_bool_2 | true | (?Line Settings) Show StopLoss - TakeProf Lines |
| v_input_bool_3 | true | Show Trend Line |
| v_input_color_4 | #ffff00 | StopLoss Line Colour |
| v_input_color_5 | #00ff00 | Up Trend line Colour |
| v_input_color_6 | #ff0000 | Down Trend line Colour |
Source Pine Script
/*backtest
start: 2023-01-15 00:00:00
end: 2024-01-21 00:00:00
period: 1d
basePeriod: 1h
exchanges: [{"eid":"Futures_Binance","currency":"BTC_USDT"}]
*/

// This Pine Script™ code is subject to the terms of the Mozilla Public License 2.0 at https://mozilla.org/MPL/2.0/
// © JS_TechTrading

//@version=5
strategy('The Flash-Strategy (Momentum-RSI, EMA-crossover, ATR)', shorttitle='The Flash-Strategy (Momentum-RSI, EMA-crossover, ATR)', overlay=true,initial_capital = 1000)
//// author -  JS-TechTrading

// MOM Rsi indicator
group_mom_rsi = "Rsi Of Momentum "
len = input.int(10, minval=1, title="Length Mom-Rsi", group =group_mom_rsi ,tooltip = 'This ind calculate Rsi value of Momentum we use this ind to determine power of trend')
src2 = close
mom = src2 - src2[len]
rsi_mom = ta.rsi(mom, len)
mom_rsi_val = input.int(60, minval=1, title="Mom-Rsi Limit Val", group =group_mom_rsi, tooltip = "When our Mom-Rsi value more then this we open LONG or Short, with help of this indicator we we determine the status of the trend")

// Super Trend Ind
group_supertrend = "SuperTrend indicator"
atrPeriod = input(10, "ATR Length SuperTrend", group = group_supertrend)
factor = input.float(3.0, "Factor SuperTrend", step = 0.01, group = group_supertrend)

[supertrend, direction] = ta.supertrend(factor, atrPeriod)

// Ema Indicator
group_most = "Ema indicator"
src = input(close, 'Source Ema Ind',group = group_most)
AP2 = input.int(defval=12, title='Length Ema Ind', minval=1,group = group_most)
Trail1 = ta.ema(src, AP2) //Ema func
AF2 = input.float(defval=1, title='Percent Ema Ind', minval=0.1,group = group_most) / 100
SL2 = Trail1 * AF2  // Stoploss Ema
Trail2 = 0.0
iff_1 = Trail1 > nz(Trail2[1], 0) ? Trail1 - SL2 : Trail1 + SL2
iff_2 = Trail1 < nz(Trail2[1], 0) and Trail1[1] < nz(Trail2[1], 0) ? math.min(nz(Trail2[1], 0), Trail1 + SL2) : iff_1
Trail2 := Trail1 > nz(Trail2[1], 0) and Trail1[1] > nz(Trail2[1], 0) ? math.max(nz(Trail2[1], 0), Trail1 - SL2) : iff_2

//EMA50/150/200
group_50_150_200="EMA50/150/200"
show_emas=input.bool(defval = true, title = "SHOW EMAS", group = group_50_150_200)
ema50= ta.ema(src, 50)
ema150 = ta.ema(src, 150)
ema200 = ta.ema(src, 200)
ema50_color=input.color(defval = color.purple, title = "EMA50 COLOR",group = group_50_150_200)
ema50_linewidth=input.int(defval = 2, title = "EMA50 LINEWIDTH", group = group_50_150_200)
ema150_color=input.color(defval = color.blue, title = "EMA150 COLOR", group = group_50_150_200)
ema150_linewidth=input.int(defval = 2, title = "EMA150 LINEWIDTH", group = group_50_150_200)
ema200_color=input.color(defval = color.black, title = "EMA200 COLOR", group = group_50_150_200)
ema200_linewidth=input.int(defval = 2, title = "EMA200 LINEWIDTH", group = group_50_150_200)
plot(show_emas ? ema50 : na, color = ema50_color, linewidth = ema50_linewidth)
plot(show_emas ? ema150 : na, color=ema150_color, linewidth = ema150_linewidth)
plot(show_emas ? ema200 : na, color = ema200_color, linewidth = ema200_linewidth)

//Bull = ta.barssince(Trail1 > Trail2 and close > Trail2 and low > Trail2) < ta.barssince(Trail2 > Trail1 and close < Trail2 and high < Trail2)

//TS1 = plot(Trail1, 'ExMov', style=plot.style_line, color=Trail1 > Trail2 ? color.rgb(33, 149, 243, 100) : color.rgb(255, 235, 59, 100), linewidth=2)
//TS2 = plot(Trail2, 'ema', style=plot.style_line, color=Trail1 > Trail2 ? color.rgb(76, 175, 79, 30) : color.rgb(255, 82, 82, 30), linewidth=2)
//fill(TS1, TS2, Bull  ? color.green : color.red, transp=90)


// Strategy Sett
group_strategy = "Settings of Strategy"
Start_Time = input(defval=timestamp('01 January 2000 13:30 +0000'), title='Start Time of BackTest', group =group_strategy)
End_Time = input(defval=timestamp('30 April 2030 19:30 +0000'), title='End Time of BackTest', group =group_strategy)
dollar = input.float(title='Dollar Cost Per Position* ', defval=50000, group =group_strategy)
trade_direction = input.string(title='Trade_direction', group =group_strategy, options=['LONG', 'SHORT', 'BOTH'], defval='BOTH')
v1 = input(true, title="Version 1 - Uses SL/TP Dynamically ", group =group_strategy ,tooltip = 'With this settings our stoploss price increase or decrease with price to get better PNL score')

v2 = input(false, title="Version 2 -  Uses SL/TP Statically", group =group_strategy)
v2stoploss_input = input.float(5, title='Static Stop.Loss % Val', minval=0.01, group =group_strategy)/100
v2takeprofit_input = input.float(10, title='Static Take.Prof % Val', minval=0.01, group =group_strategy)/100

v2stoploss_level_long = strategy.position_avg_price * (1 - v2stoploss_input)
v2takeprofit_level_long = strategy.position_avg_price * (1 + v2takeprofit_input)

v2stoploss_level_short = strategy.position_avg_price * (1 + v2stoploss_input)
v2takeprofit_level_short = strategy.position_avg_price * (1 - v2takeprofit_input)

group_line = "Line Settings"
show_sl_tp = input.bool(title='  Show StopLoss - TakeProf Lines',inline = "1", defval=true, group =group_line)
show_trend_line = input.bool(title='  Show Trend Line',inline = '3' ,defval=true, group =group_line)
stoploss_colour = input.color(title='StopLoss Line Colour',inline = '2' ,defval=color.rgb(255, 255, 0), group =group_line)
up_trend_line_colour = input.color(title='Up Trend line Colour',inline = '4' ,defval=color.rgb(0, 255, 0, 30), group =group_line)
down_trend_line_colour = input.color(title='Down Trend line Colour',inline = '4' ,defval=color.rgb(255, 0, 0, 30), group =group_line)

//plot(supertrend ,color = strategy.position_size > 0 and show_sl_tp ? color.rgb(255, 0, 0) :show_sl_tp ? color.rgb(0, 255, 0) : na , style = plot.style_steplinebr,linewidth = 2)
// plot(supertrend ,color = show_sl_tp and v1 ? stoploss_colour : na , style = plot.style_steplinebr,linewidth = 2)

// plot(v2stoploss_level_long ,color = strategy.position_size > 0 and show_sl_tp and v2 ? stoploss_colour : na , style = plot.style_steplinebr,linewidth = 2)
// plot(v2stoploss_level_short ,color = strategy.position_size < 0 and show_sl_tp and v2 ? stoploss_colour : na , style = plot.style_steplinebr,linewidth = 2)
// plot(v2takeprofit_level_long  ,color = strategy.position_size > 0 and show_sl_tp and v2 ? up_trend_line_colour : na , style = plot.style_steplinebr,linewidth = 2)
// plot(v2takeprofit_level_short ,color = strategy.position_size < 0 and show_sl_tp and v2 ? up_trend_line_colour : na , style = plot.style_steplinebr,linewidth = 2)


TS2 = plot(Trail2, 'Ema Strategy', style=plot.style_line, color=show_trend_line and Trail1 < Trail2 ? down_trend_line_colour : show_trend_line ? up_trend_line_colour  : na, linewidth=2)

// bgcolor(buy_signal ? color.rgb(0, 230, 119, 80) : na)
// bgcolor(sell_signal ? color.rgb(255, 82, 82, 80) : na)

Time_interval = true
buy_signal = Trail1 > Trail2 and direction < 0 and rsi_mom > mom_rsi_val and Time_interval
sell_signal =Trail1 < Trail2 and direction > 0 and rsi_mom > mom_rsi_val and Time_interval


// Strategy entries
stop_long = (close < supertrend and v1) or (v2 and strategy.position_size > 0)
stop_short = (close > supertrend and v1) or (v2 and strategy.position_size < 0)
long_cond = ((close > ema150 ) and (ema50 > ema150) and (ema150 > ema200))
short_cond = ((close < ema150) and (ema50 < ema150) and (ema150 < ema200))
if (not stop_long) and (not short_cond) and long_cond and strategy.opentrades == 0 and (trade_direction == 'LONG' or trade_direction == 'BOTH') and buy_signal
    strategy.entry('Long_0', strategy.long, qty=dollar / close)

if (not stop_short) and (not long_cond) and short_cond and strategy.opentrades == 0 and (trade_direction == 'SHORT' or trade_direction == 'BOTH') and sell_signal
    strategy.entry('Short_0', strategy.short, qty=dollar / close)


if close < supertrend and v1
    strategy.exit('Long_Close',from_entry = "Long_0", stop=supertrend, qty_percent=100)
if  v2 and strategy.position_size > 0
    strategy.exit('Long_Close',from_entry = "Long_0", stop=v2stoploss_level_long,limit= v2takeprofit_level_long  , qty_percent=100)

if close > supertrend and v1
    strategy.exit('Short_Close',from_entry = "Short_0", stop=supertrend, qty_percent=100)
if  v2 and strategy.position_size < 0
strategy.exit('Short_Close',from_entry = "Short_0", stop=v2stoploss_level_short,limit= v2takeprofit_level_short ,qty_percent=100)Published by ChaoZhang on the FMZ strategy square · last modified 2024-01-22. Collected in the Quant Trading Vault. Unvalidated research: re-test with your own data and costs before trusting it.
Build this with AgenKit
A spec is not a trading system. Paste this into your coding agent and AgenKit runs a specialist team — architecture, test-first build, risk gates, review — with paper trading on by default.
/agenkit build a production-grade trading bot with a backtest engine, risk controls and paper trading by default from strategies/Momentum-Oscillator-Trend-Tracking-Strategy.md- npx agenkit install engineering-kit in your project
- Paste the command into your agent and approve each phase
- Get tests, backtest, risk controls and a paper-trading switch
Understand it first
Before you run this, read the lesson behind the idea and how to backtest it honestly. Specs like this one are the survivors of an unknown number of trials; deflate their results accordingly.
Related specs
- Multi Technical Indicator Trend Following Strategy with RSI Momentum FilterPine Script · Momentum · 1h
- Oscillator Candles Momentum Trading StrategyPine Script · Momentum · 1h
- Advanced Multi Indicator Trend Following and Momentum Quantitative Trading StrategyPine Script · Momentum · 1h
- KST EMA Momentum Trend Following StrategyPine Script · Momentum · 1d
- Multi Indicator Trend Momentum Crossover Quantitative StrategyPine Script · Momentum · 1d
- Hybrid EMA Momentum Trading System with Trend Persistence Analysis StrategyPine Script · Momentum · 2h