Momentum Price Trend Tracking Strategy
The momentum price trend tracking strategy uses multiple momentum indicators to identify price trends, establishes positions at the beginning of trends, and locks in profits through stop profit and stop loss settings…
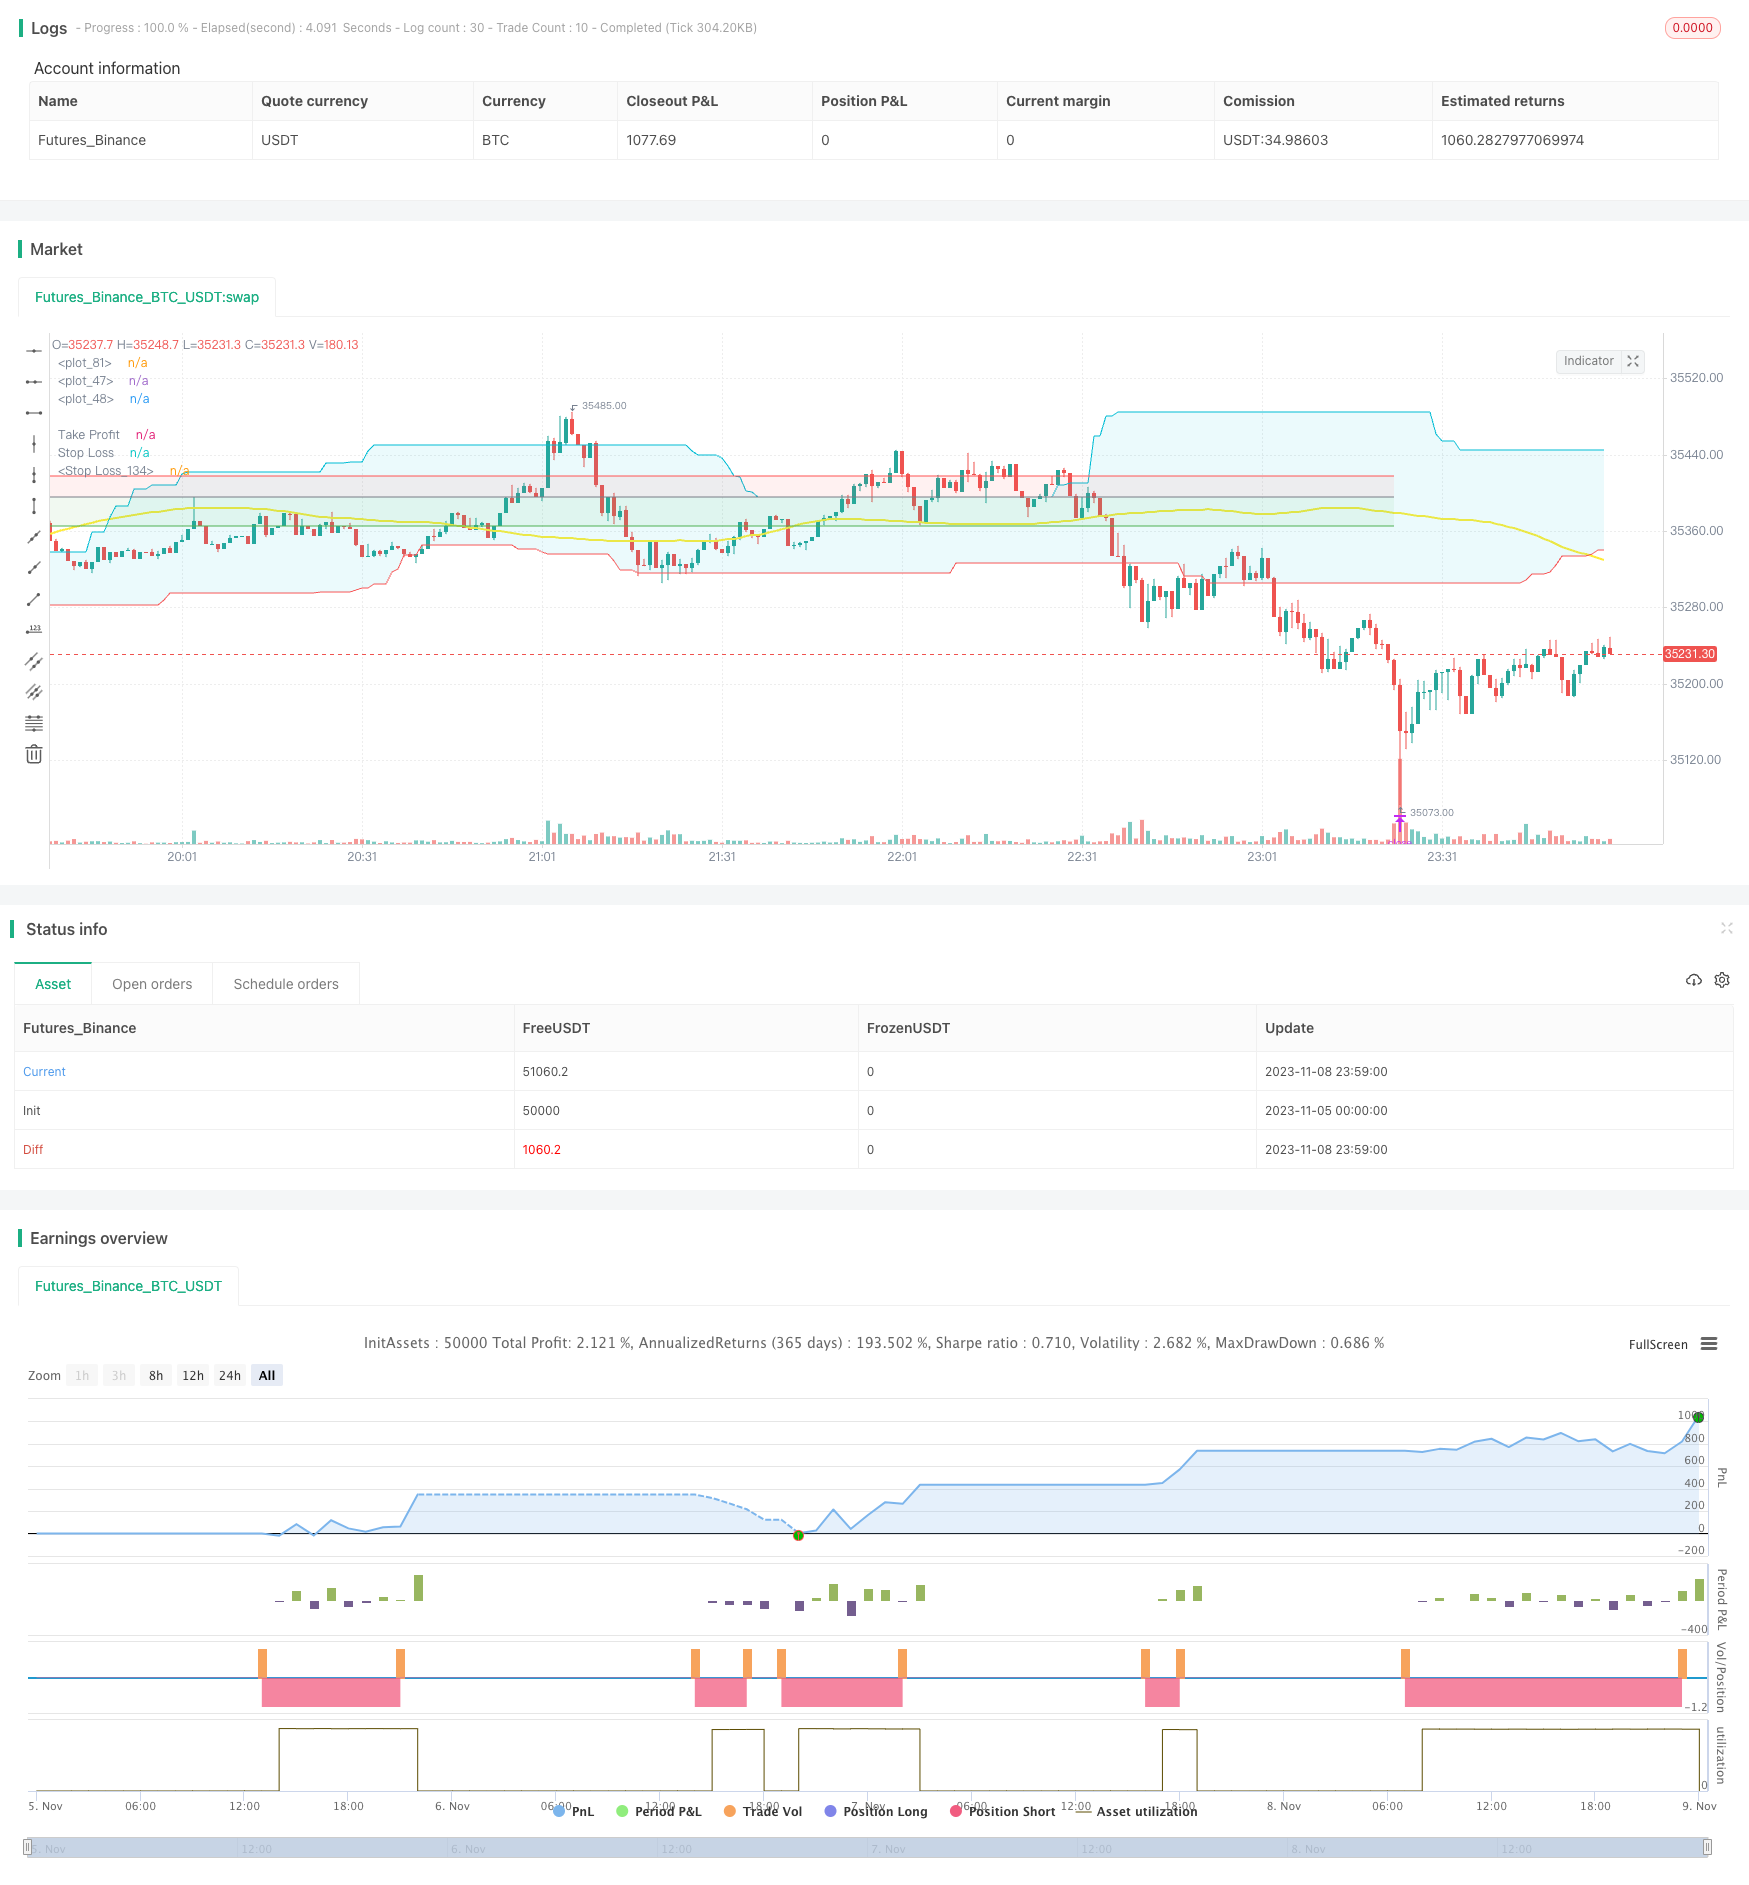
Overview
The momentum price trend tracking strategy uses multiple momentum indicators to identify price trends, establishes positions at the beginning of trends, and locks in profits through stop profit and stop loss settings to track price trends.
Strategy Logic
The momentum price trend tracking strategy mainly applies the following technical indicators:
ROC indicator: This indicator calculates the percentage rate of change in price over a certain period to determine price momentum. When ROC is positive, it means prices are rising. When ROC is negative, it means prices are falling. The strategy uses the ROC indicator to determine the direction of the price trend.
Bulls Power and Bears Power indicator: This indicator reflects the power comparison between bulls and bears. Bulls Power > 0 indicates bulls power is greater than bears power and prices rise. The strategy uses this indicator to predict price direction by comparing bull and bear power.
Divergence: This indicator identifies trend reversal by calculating price and volume divergence. The strategy uses divergence signals as entry timing.
Donchian Channel: This indicator constructs a channel using highest and lowest prices, and the channel boundaries can serve as support and resistance. The strategy uses the channel to determine trend direction.
Moving Average: This indicator smooths out price fluctuations to identify the overall trend direction. The strategy uses it to determine the general price trend.
The strategy determines price trends and reversal points based on the above indicators, and establishes long or short positions according to indicator signals at the beginning of trends. It then closes positions in a timely manner based on stop profit and stop loss points to capture price trends.
Advantage Analysis
The advantages of this strategy include:
Using multiple indicators to determine trends reduces misjudgement probability.
Using indicator divergences enables accurately capturing trend reversal points.
Combining channels and moving averages helps determine the overall trend.
Setting stop profit and stop loss secures profits timely and avoids expanded drawdowns.
Adjustable parameters make the strategy adaptable to different periods and products.
The clear logic facilitates further optimization.
Risk Analysis
The potential risks of this strategy include:
The multiple indicators may increase erroneous signal probability. Optimizing indicator weights is needed.
Stop loss points set too small may increase stop loss probability, while too wide may expand drawdowns. Reasonable points need comprehensive consideration.
Blind application across varying market periods may lead to inadaptability. Periodic parameter tuning is required.
Sufficient capital to support high position units is required to achieve excess returns.
Backtest overfitting risks exist. Real-trading performance has uncertainties.
Optimization Directions
The strategy can be optimized in the following aspects:
Optimize indicator parameters to find the optimal combinations for different periods and products.
Introduce machine learning algorithms to find the optimal parameters automatically.
Build in adaptive stop loss mechanisms based on market conditions.
Incorporate high-frequency factors and fundamentals to improve alpha.
Develop automated testing frameworks for parameter optimization and performance verification.
Introduce risk management modules to control position sizing and reduce drawdowns.
Add simulated and live trading and testing to improve stability.
Conclusion
This strategy combines multiple momentum indicators to determine price trends and uses stop profit/loss to lock in profits. It can effectively capture trends with strong stability. Further enhancements in parameter tuning, structure optimization and risk control will improve its performance and risk management. The strategy provides a reliable and easy-to-use trend following solution for quantitative trading.
Parameters
| Name | Default | What it controls |
|---|---|---|
| v_input_1 | 3000 | Take Profit |
| v_input_2 | 2200 | Stop Loss |
| v_input_3 | 186 | ROC Length |
| v_input_4 | 50 | Smoothing Length |
| v_input_5_close | 0 | Source: close | high | low | open | hl2 | hlc3 | hlcc4 | ohlc4 |
| v_input_6 | 53 | Upper Channel |
| v_input_7 | 53 | Lower Channel |
| v_input_8 | 91 | Offset Bars |
| v_input_9 | 65 | BearsP WMA Period |
| v_input_10 | 15 | BoP Exponential Smoothing |
| v_input_11 | 74 | SMA Period |
| v_input_12 | 37 | SMA Shift |
| v_input_13 | false | My Price |
| v_input_14 | 0 | Label Style: Lower Right | Upper Right |
Source Pine Script
/*backtest
start: 2023-11-05 00:00:00
end: 2023-11-09 00:00:00
period: 1m
basePeriod: 1m
exchanges: [{"eid":"Futures_Binance","currency":"BTC_USDT"}]
*/

// This source code is subject to the terms of the Mozilla Public License 2.0 at https://mozilla.org/MPL/2.0/
// © mbagheri746

//@version=4
strategy("Bagheri IG Ether v2", overlay=true, margin_long=100, margin_short=100)

TP = input(3000, minval = 1 , title ="Take Profit")
SL = input(2200, minval = 1 , title ="Stop Loss")


//_________________ RoC Definition _________________


rocLength = input(title="ROC Length", type=input.integer, minval=1, defval=186)
smoothingLength = input(title="Smoothing Length", type=input.integer, minval=1, defval=50)
src = input(title="Source", type=input.source, defval=close)

ma = ema(src, smoothingLength)
mom = change(ma, rocLength)

sroc = nz(ma[rocLength]) == 0
     ? 100
     : mom == 0
         ? 0
         : 100 * mom / ma[rocLength]

//srocColor = sroc >= 0 ? #0ebb23 : color.red
//plot(sroc, title="SROC", linewidth=2, color=srocColor, transp=0)
//hline(0, title="Zero Level", linestyle=hline.style_dotted, color=#989898)


//_________________ Donchian Channel _________________

length1 = input(53, minval=1, title="Upper Channel")
length2 = input(53, minval=1, title="Lower Channel")
offset_bar = input(91,minval=0, title ="Offset Bars")

upper = highest(length1)
lower = lowest(length2)

basis = avg(upper, lower)


DC_UP_Band = upper[offset_bar]
DC_LW_Band = lower[offset_bar]

l = plot(DC_LW_Band, style=plot.style_line, linewidth=1, color=color.red)
u = plot(DC_UP_Band, style=plot.style_line, linewidth=1, color=color.aqua)

fill(l,u,color = color.new(color.aqua,transp = 90))

//_________________ Bears Power _________________


wmaBP_period = input(65,minval=1,title="BearsP WMA Period")
line_wma = ema(close, wmaBP_period)

BP = low - line_wma


//_________________ Balance of Power _________________

ES_BoP=input(15, title="BoP Exponential Smoothing")
BOP=(close - open) / (high - low)

SBOP = rma(BOP, ES_BoP)

//_________________ Alligator _________________

//_________________ CCI _________________

//_________________ Moving Average _________________

sma_period = input(74, minval = 1 , title = "SMA Period")
sma_shift = input(37, minval = 1 , title = "SMA Shift")

sma_primary = sma(close,sma_period)

SMA_sh = sma_primary[sma_shift]

plot(SMA_sh, style=plot.style_line, linewidth=2, color=color.yellow)

//_________________ Long Entry Conditions _________________//

MA_Lcnd = SMA_sh > low and SMA_sh < high

ROC_Lcnd = sroc < 0

DC_Lcnd = open < DC_LW_Band

BP_Lcnd = BP[1] < BP[0] and BP[1] < BP[2]

BOP_Lcnd = SBOP[1] < SBOP[0]

//_________________ Short Entry Conditions _________________//

MA_Scnd = SMA_sh > low and SMA_sh < high

ROC_Scnd = sroc > 0

DC_Scnd = open > DC_UP_Band

BP_Scnd = BP[1] > BP[0] and BP[1] > BP[2]

BOP_Scnd = SBOP[1] > SBOP[0]

//_________________ OPEN POSITION __________________//

if strategy.position_size  == 0
    strategy.entry(id = "BUY", long = true , when = MA_Lcnd and ROC_Lcnd and DC_Lcnd and BP_Lcnd and BOP_Lcnd)
    strategy.entry(id = "SELL", long = false , when = MA_Scnd and ROC_Scnd and DC_Scnd and BP_Scnd and BOP_Scnd)

//_________________ CLOSE POSITION __________________//

strategy.exit(id = "CLOSE BUY", from_entry = "BUY", profit = TP , loss = SL)

strategy.exit(id = "CLOSE SELL", from_entry = "SELL" , profit = TP , loss = SL)

//_________________ TP and SL Plot __________________//

currentPL= strategy.openprofit
pos_price = strategy.position_avg_price
open_pos = strategy.position_size

TP_line = (strategy.position_size  > 0) ? (pos_price + TP/100) : strategy.position_size < 0 ? (pos_price - TP/100) : 0.0
SL_line = (strategy.position_size  > 0) ? (pos_price - SL/100) : strategy.position_size < 0 ? (pos_price + SL/100) : 0.0

// hline(TP_line, title = "Take Profit", color = color.green , linestyle = hline.style_dotted, editable = false)
// hline(SL_line, title = "Stop Loss", color = color.red , linestyle = hline.style_dotted, editable = false)


Tline = plot(TP_line != 0.0 ? TP_line : na , title="Take Profit", color=color.green, trackprice = true, show_last = 1)
Sline = plot(SL_line != 0.0 ? SL_line : na, title="Stop Loss", color=color.red, trackprice = true, show_last = 1)
Pline = plot(pos_price != 0.0 ? pos_price : na, title="Stop Loss", color=color.gray, trackprice = true, show_last = 1)


fill(Tline , Pline, color = color.new(color.green,transp = 90))
fill(Sline , Pline, color = color.new(color.red,transp = 90))

//_________________ Alert __________________//

//alertcondition(condition = , title = "Position Alerts", message = "Bagheri IG Ether\n Symbol: {{ticker}}\n Type: {{strategy.order.id}}")

//_________________ Label __________________//


inMyPrice           = input(title="My Price", type=input.float, defval=0)
inLabelStyle        = input(title="Label Style", options=["Upper Right", "Lower Right"], defval="Lower Right")

posColor = color.new(color.green, 25)
negColor = color.new(color.red, 25)
dftColor = color.new(color.aqua, 25)
posPnL   = (strategy.position_size != 0) ? (close * 100 / strategy.position_avg_price - 100) : 0.0
posDir   = (strategy.position_size  > 0) ? "long" : strategy.position_size < 0 ? "short" : "flat"
posCol   = (strategy.openprofit > 0) ? posColor : (strategy.openprofit < 0) ? negColor : dftColor
myPnL    = (inMyPrice != 0) ? (close * 100 / inMyPrice - 100) : 0.0

var label lb = na
label.delete(lb)
lb := label.new(bar_index, close,
   color=posCol,
   style=inLabelStyle=="Lower Right"?label.style_label_upper_left:label.style_label_lower_left,
   text=
      "╔═══════╗" +"\n" +
      "Pos: "  +posDir +"\n" +
      "Pos Price: "+tostring(strategy.position_avg_price) +"\n" +
      "Pos PnL: "  +tostring(posPnL, "0.00") + "%" +"\n" +
      "Profit: "  +tostring(strategy.openprofit, "0.00") + "$" +"\n" +
      "TP: "  +tostring(TP_line, "0.00") +"\n" +
      "SL: "  +tostring(SL_line, "0.00") +"\n" +
      "╚═══════╝")
Published by ChaoZhang on the FMZ strategy square · last modified 2023-11-13. Collected in the Quant Trading Vault. Unvalidated research: re-test with your own data and costs before trusting it.
Build this with AgenKit
A spec is not a trading system. Paste this into your coding agent and AgenKit runs a specialist team — architecture, test-first build, risk gates, review — with paper trading on by default.
/agenkit build a production-grade trading bot with a backtest engine, risk controls and paper trading by default from strategies/Momentum-Price-Trend-Tracking-Strategy.md- npx agenkit install engineering-kit in your project
- Paste the command into your agent and approve each phase
- Get tests, backtest, risk controls and a paper-trading switch
Understand it first
Before you run this, read the lesson behind the idea and how to backtest it honestly. Specs like this one are the survivors of an unknown number of trials; deflate their results accordingly.
Related specs
- Fukuiz Octa EMA IchimokuPine Script · Momentum · 10m
- Oscillator Candles Momentum Trading StrategyPine Script · Momentum · 1h
- KST EMA Momentum Trend Following StrategyPine Script · Momentum · 1d
- Multi Timeframe Momentum Confluence Automated Trading StrategyPine Script · Momentum · 1h
- Multi factor Adaptive Momentum Tracking StrategyPine Script · Momentum · 3m
- Buy Sell Strategy Based on Volume Candlestick PatternsPine Script · Momentum · 1d