Strategy vault / Mean reversion
Momentum Reversal Strategy 431885
This strategy aims to detect the percentage price change of stocks within a certain time period and generate trading signals when a threshold is exceeded. It is suitable for short-term and scalping trading to capture…
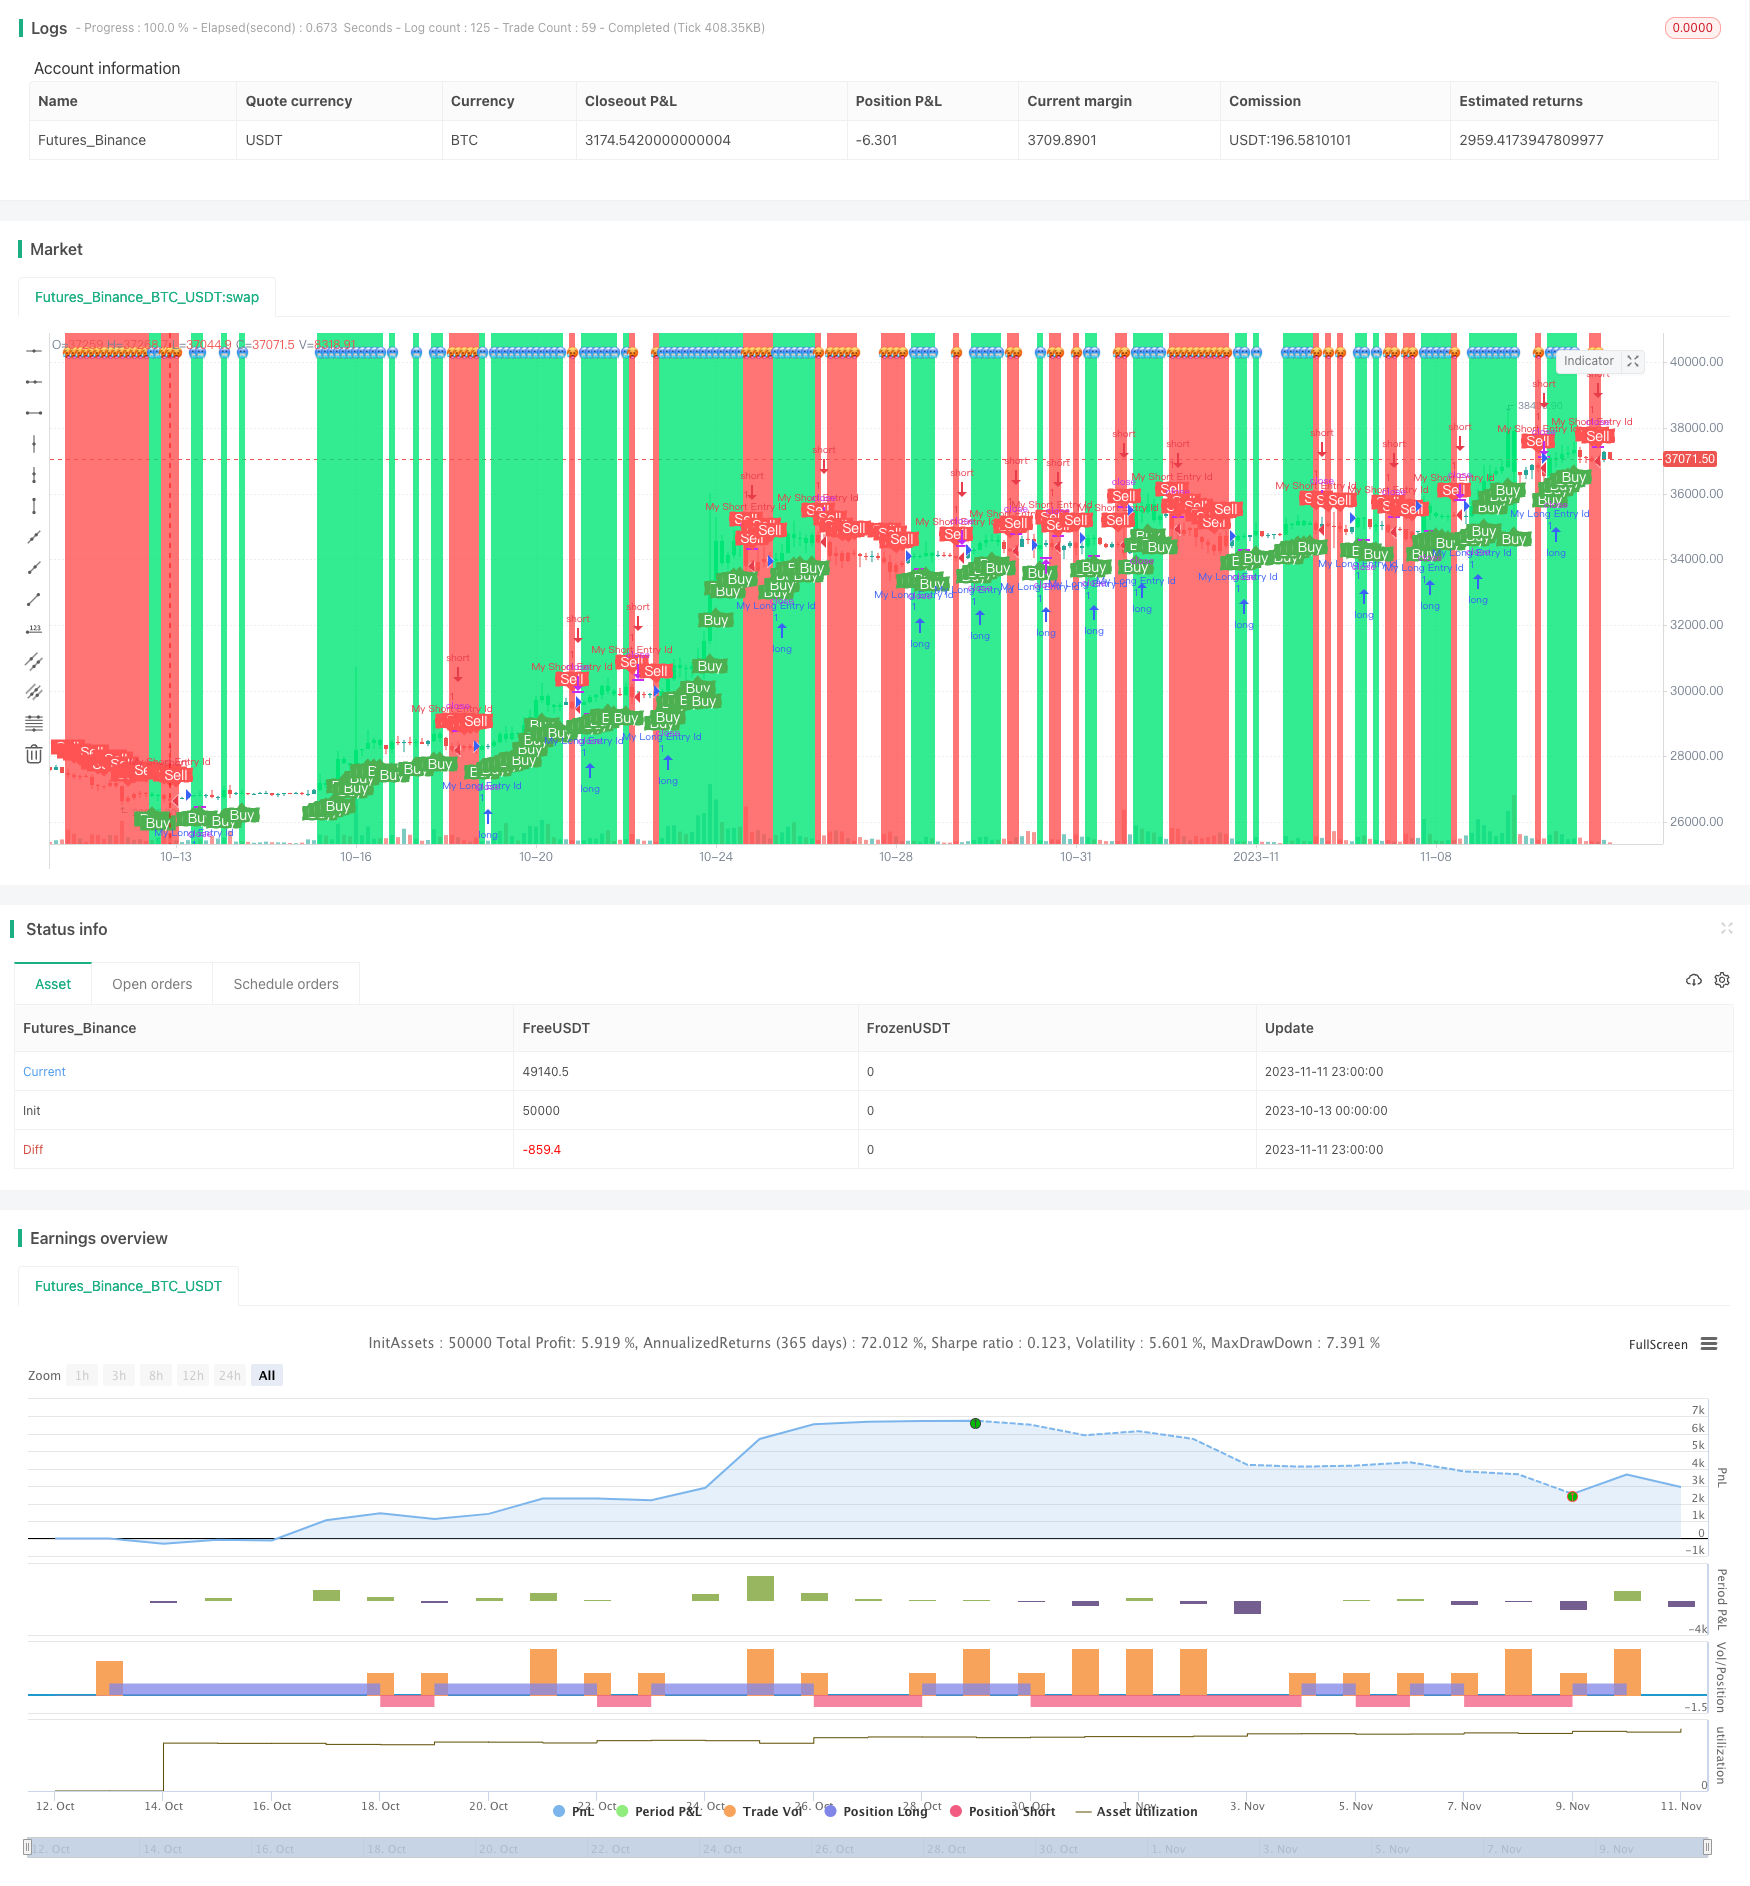
Overview
This strategy aims to detect the percentage price change of stocks within a certain time period and generate trading signals when a threshold is exceeded. It is suitable for short-term and scalping trading to capture opportunities from sudden market movements.
Strategy Logic
The input parameter x represents the number of candlestick periods to check, with a default of 5 for 5-minute candles.
Calculate the percentage change of the current closing price relative to the closing price x periods ago, saved as trueChange1 and trueChange2.
The input parameters percentChangePos and percentChangeNeg represent the threshold percentage change, with default values of 0.4% and -0.4%.
When trueChange1 is greater than percentChangePos, a buy signal buy is generated. When trueChange2 is less than percentChangeNeg, a sell signal sell is generated.
Add text and background colors for buy and sell status.
Set entry and exit rules based on the signals.
Configure alerts and drawings.
Advantages
Use percentage change rather than absolute price change, adaptable to different stocks.
Flexibly set positive and negative percentage thresholds to identify Bollinger Bands breakouts.
Adjustable detection period to identify trend changes in different time frames.
Configurable alerts to catch important signals.
Simple and straightforward signal logic, easy to understand and use.
Catch short-term reversals at market open.
Risks
Percentage change does not determine trend direction, may generate misleading signals.
Default parameters may not suit all stocks, specific tuning needed.
No stop loss in place, unable to limit losses.
Frequent signals, potentially high trading costs.
Unable to determine market structure, prone to whipsaws in ranging markets.
Solutions:
Combine with trend indicators like linear regression to determine overall trend.
Optimize parameters based on stock characteristics.
Implement proper stop loss.
Filter signals to avoid over-trading.
Gauge market structure from higher time frames to avoid trading whipsaws.
Enhancements
Add stop loss mechanisms like trailing stop loss to limit losses.
Add filter conditions like volume, moving averages to avoid whipsaws.
Optimize entry and exit rules with indicators like MACD.
Use machine learning to auto optimize parameters.
Incorporate analysis of market structure to avoid whipsaws.
Dynamically set parameters based on volatility and liquidity.
Combine with higher time frame analysis to determine overall trend.
Summary
This strategy generates trades by comparing percentage price change to preset thresholds, making it a short-term mean-reversion strategy. The advantages lie in its simplicity, flexibility and ability to capture sudden market movements. The drawbacks are risks which can be addressed through optimizations and proper usage with trend analysis and risk management. Overall, it has sound logic and can be an effective short-term trading strategy when enhanced properly.
Parameters
| Name | Default | What it controls |
|---|---|---|
| v_input_1 | 5 | x candles difference |
| v_input_2 | 0.4 | Percent Change |
| v_input_3 | -0.4 | Percent Change |
Source Pine Script
/*backtest
start: 2023-10-13 00:00:00
end: 2023-11-12 00:00:00
period: 3h
basePeriod: 15m
exchanges: [{"eid":"Futures_Binance","currency":"BTC_USDT"}]
*/

//@version=4
// created by Oliver
strategy("Percentage Change strategy w/BG color", overlay=true, scale=scale.none, precision=2)

x = input(5, title = 'x candles difference', minval = 1)
trueChange1 = (close - close[x]) / close[x] * 100
percentChangePos = input(0.4, title="Percent Change")

//if (percentChange > trueChange) then Signal

plotChar1 = if percentChangePos > trueChange1
    false
else
    true

plotchar(series=plotChar1, char='?', color=color.green, location=location.top, size = size.tiny )

trueChange2 = (close - close[x]) / close[x] * 100
percentChangeNeg = input(-0.4, title="Percent Change")

plotChar2 = if percentChangeNeg < trueChange2
    false
else
    true
plotchar(series=plotChar2, char='?', color=color.red, location=location.top, size = size.tiny)

//------------------------------------------------------------------------
UpColor() => percentChangePos < trueChange1
DownColor() => percentChangeNeg > trueChange2

//Up = percentChangePos < trueChange1
//Down = percentChangeNeg > trueChange2


col = percentChangePos < trueChange1 ? color.lime : percentChangeNeg > trueChange2 ? color.red : color.white
//--------
condColor = percentChangePos < trueChange1 ? color.new(color.lime,50) : percentChangeNeg > trueChange2 ? color.new(color.red,50) : na
//c_lineColor = condUp ? color.new(color.green, 97) : condDn ? color.new(color.maroon, 97) : na
//barcolor(Up ? color.blue : Down ? color.yellow : color.gray, transp=70)

//Background Highlights
//bgcolor(condColor, transp=70)


//---------

barcolor(UpColor() ? color.lime: DownColor() ? color.red : na)
bgcolor(UpColor() ? color.lime: DownColor() ? color.red : na)

//------------------------------------------------------------------------

buy = percentChangePos < trueChange1
sell = percentChangeNeg > trueChange2


//------------------------------------------------------------------------
/////////////// Alerts ///////////////
alertcondition(buy, title='buy', message='Buy')
alertcondition(sell, title='sell', message='Sell')

//-------------------------------------------------

if (buy)
    strategy.entry("My Long Entry Id", strategy.long)

if (sell)
    strategy.entry("My Short Entry Id", strategy.short)


/////////////////// Plotting ////////////////////////
plotshape(buy, title="buy", text="Buy", color=color.green, style=shape.labelup, location=location.belowbar, size=size.small, textcolor=color.white, transp=0)  //plot for buy icon
plotshape(sell, title="sell", text="Sell", color=color.red, style=shape.labeldown, location=location.abovebar, size=size.small, textcolor=color.white, transp=0)
Published by ChaoZhang on the FMZ strategy square · last modified 2023-11-13. Collected in the Quant Trading Vault. Unvalidated research: re-test with your own data and costs before trusting it.
Build this with AgenKit
A spec is not a trading system. Paste this into your coding agent and AgenKit runs a specialist team — architecture, test-first build, risk gates, review — with paper trading on by default.
/agenkit build a production-grade trading bot with a backtest engine, risk controls and paper trading by default from strategies/Momentum-Reversal-Strategy-431885.md- npx agenkit install engineering-kit in your project
- Paste the command into your agent and approve each phase
- Get tests, backtest, risk controls and a paper-trading switch
Understand it first
Before you run this, read the lesson behind the idea and how to backtest it honestly. Specs like this one are the survivors of an unknown number of trials; deflate their results accordingly.
Related specs
- Advanced 15 Minute Chart Trading Signal StrategyPine Script · Mean reversion · 3h
- Momentum Reversal Trend Tracking StrategyPine Script · Mean reversion
- Quantitative Trading Strategy Based on Bollinger Bands and RSIPine Script · Mean reversion · 1h
- RSI Fibonacci Retracement StrategyPine Script · Mean reversion · 1d
- Random Oscillation StrategyPine Script · Mean reversion · 1d
- CCTBBO Reversal Tracking StrategyPine Script · Mean reversion · 45m