Strategy vault / Mean reversion
Momentum Reversal Strategy Based on Multiple Timeframes
This strategy identifies trading opportunities by calculating candlestick body/wick ratios and combining RSI indicators to detect overbought/oversold market conditions. It aims to capture potential reversals in the…
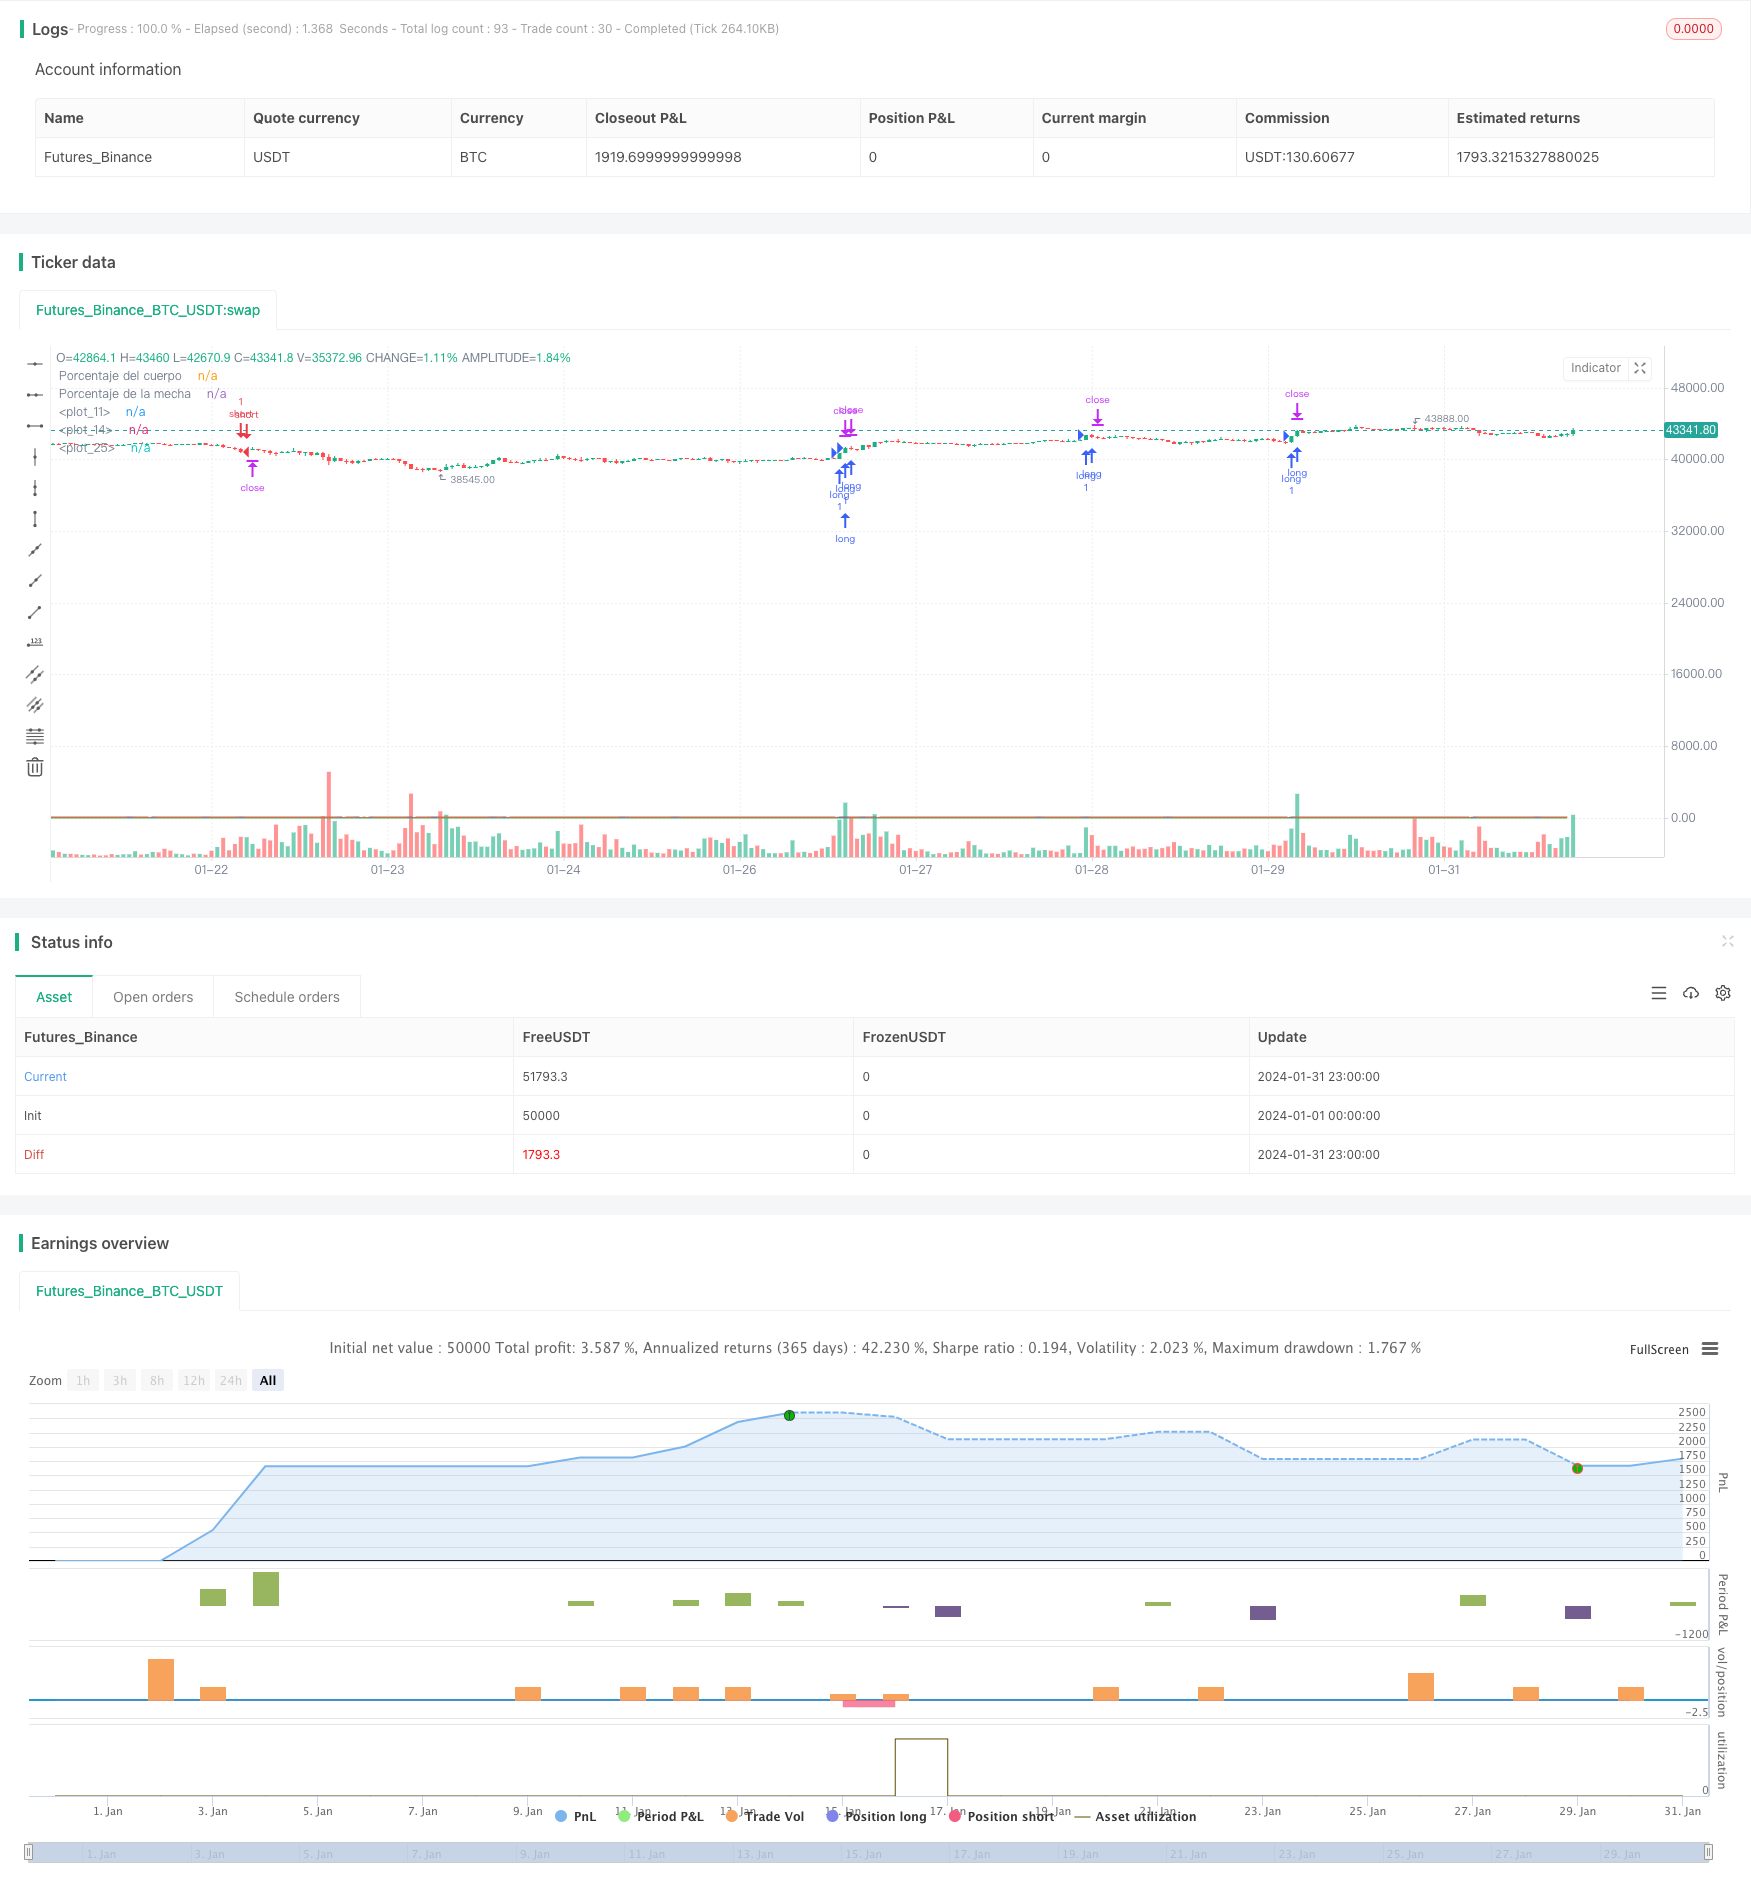
Overview
This strategy identifies trading opportunities by calculating candlestick body/wick ratios and combining RSI indicators to detect overbought/oversold market conditions. It aims to capture potential reversals in the price momentum over short-to-medium term timeframes.
Strategy Logic
The core logic of this strategy is based on the following:
Calculate body/wick percentage of candlesticks: By computing open, close, high and low prices, derive the percentage occupied by candle body and wicks. Wick percentage below 20% indicates a strong candle.
Compute candle strength change percentage: Calculate the internal price movement magnitude of each candle to determine candle strength. Larger fluctuations imply stronger momentum and hence indicate stronger candles.
Combine with RSI to identify overbought/oversold conditions: Set overbought and oversold threshold lines for RSI. RSI above overbought line signifies overbought state and vice versa for oversold. Strong candles in such states have high probability of reversal.
Determine reversal signals: When wick percentage < 20% and candle strength > 2 x average strength, along with previous candle close higher than current candle close, it signals short condition. The opposite indicates long condition.
Define stop loss and take profit: Set fixed percentage-based stop loss and take profit levels separately for long and short trades.
Advantage Analysis
The advantages of this strategy include:
Effective identification of trend and reversals using candle body/wick proportions. Detects price momentum and turning points well.
Higher accuracy of reversal signals by combining candle strength change and RSI. RSI is adjustable providing greater optimization capability.
Reasonable stop loss/take profit configuration to capitalize on short-term opportunities while lowering trade risk exposure.
Flexible tunability of parameters for optimizing across different products and timeframes. High practical utility.
Risk Analysis
Some risks present in the strategy:
Potential false signals during strong trend breakouts. Can be reduced via optimization of candle comparison periods and RSI parameters.
Probability of failed reversals can't be eliminated fully. Being long in downtrend and vice versa induces losses. Stop losses should be adjusted accordingly to minimize damage.
Performance depends on product and timeframe. Caution warranted when applying to highly volatile products.
Enhancement Opportunities
The strategy can be optimized in the following ways:
Fine tune periods considered in identifying overbought/oversold to determine optimal parameter combinations.
Optimize overbought/oversold RSI thresholds based on product specifics.
Test stop loss/take profit ratios for deriving ideal risk management plan.
Categorize products as per volatility for more targeted parameter tuning.
Additional filters based on other indicators may improve robustness.
Conclusion
The strategy is highly practical overall for detecting reversals by understanding candlestick information. As a typical short-term trading system, it has sizable optimization capability across products and environments for tracking medium-term trends. However adequate risk control through stop losses is imperative.
Parameters
| Name | Default | What it controls |
|---|---|---|
| v_input_int_1 | 14 | Periodo RSI |
| v_input_int_2 | 75 | Sobre Compra |
| v_input_int_3 | 25 | Sobre Venta |
Source Pine Script
/*backtest
start: 2024-01-01 00:00:00
end: 2024-01-31 23:59:59
period: 1h
basePeriod: 15m
exchanges: [{"eid":"Futures_Binance","currency":"BTC_USDT"}]
*/

//@version=5
strategy("mecha larga study",overlay = true,  max_bars_back = 600)
//Porcentaje Mecha cuerpo
bodyPercent = math.abs(open - close) / (high - low) * 100
wickPercent = 100 - bodyPercent

plot(bodyPercent, "Porcentaje del cuerpo", color.rgb(163, 76, 175))
plot(wickPercent, "Porcentaje de la mecha", color.red)

VelaDeFuerza =  math.abs(((high[0] - low[0])*100)/high)//PORCENTAJE DE VARIACION DE UNA VELA
plot(VelaDeFuerza, color = color.purple)

Promedio = ((VelaDeFuerza[0] + VelaDeFuerza[1] + VelaDeFuerza[2] + VelaDeFuerza[3] + VelaDeFuerza[4]  + VelaDeFuerza[5] + VelaDeFuerza[6] + VelaDeFuerza[7] + VelaDeFuerza[8] + VelaDeFuerza[9] + VelaDeFuerza[10] + VelaDeFuerza[11] + VelaDeFuerza[12] + VelaDeFuerza[13]  + VelaDeFuerza[14] ) / 15)
plot(Promedio, color = color.yellow)


// rsi
per_Rsi = input.int(14, "Periodo RSI",minval= 11, maxval=20) //inicializo el rsi en 14 periodos pero doy la posibilidad al usuario de cambiarlo
rsi_Sc = input.int(75,"Sobre Compra",minval=68,maxval=80) //ENTRADA DE SOBRE COMPRA DE RSI
rsi_Sv = input.int(25,"Sobre Venta",minval=20,maxval=33) //ENTRADA DE SOBRE VENTA DE RSI
rsi= ta.rsi(close,per_Rsi)//guardo el rsi con los paramentros anteriores en una variable

//logica
MayorPromedio =   Promedio + 0.800
plot(MayorPromedio, color = color.green)

Venta =   bodyPercent > 80   and VelaDeFuerza > Promedio * 2  and close < close[1]
Compra =   bodyPercent > 80  and VelaDeFuerza > Promedio * 2 and close > close[1]


precioVenta = Venta? close : na
precioCompra = Compra? close : na

tp1 = 0.00
sl  = 0.00
tp1 := 0.003
sl := 0.010

TP1short = precioVenta - (precioVenta * tp1)
Slshort = precioVenta + (precioVenta * sl)

TP1long = precioCompra + (precioCompra * tp1)
SLlong = precioCompra - (precioCompra * sl)


name1 = "tp1"
name2 = "tp2"
name3= "SL"


if ( precioVenta )
    strategy.entry("short", strategy.short , comment = "Sell  SL: " + str.tostring(Slshort, "0.000")  + " TP1: " + str.tostring(TP1short,"0.000") )
    strategy.exit("exit" , "short", stop = Slshort , limit = TP1short ,qty_percent = 100 )
if ( precioCompra )
    strategy.entry("long", strategy.long , comment = "Buy   SL: " + str.tostring(SLlong, "0.000")  + " TP1: " + str.tostring(TP1long,"0.000") )
strategy.exit("exit" , "long", stop = SLlong , limit = TP1long ,qty_percent = 100 )Published by ChaoZhang on the FMZ strategy square · last modified 2024-02-27. Collected in the Quant Trading Vault. Unvalidated research: re-test with your own data and costs before trusting it.
Build this with AgenKit
A spec is not a trading system. Paste this into your coding agent and AgenKit runs a specialist team — architecture, test-first build, risk gates, review — with paper trading on by default.
/agenkit build a production-grade trading bot with a backtest engine, risk controls and paper trading by default from strategies/Momentum-Reversal-Strategy-Based-on-Multiple-Timeframes.md- npx agenkit install engineering-kit in your project
- Paste the command into your agent and approve each phase
- Get tests, backtest, risk controls and a paper-trading switch
Understand it first
Before you run this, read the lesson behind the idea and how to backtest it honestly. Specs like this one are the survivors of an unknown number of trials; deflate their results accordingly.
Related specs
- ATR and EMA based Dynamic Take Profit and Stop Loss Adaptive StrategyPine Script · Mean reversion · 1h
- Adaptive Mean Reversion Trading Strategy Based on Chande Momentum OscillatorPine Script · Mean reversion · 1d
- Adaptive RSI Oscillator Dynamic Trading Strategy with Threshold OptimizationPine Script · Mean reversion · 1d
- Advanced 15 Minute Chart Trading Signal StrategyPine Script · Mean reversion · 3h
- Advanced Fibonacci Retracement Trend Following and Reversal Trading StrategyPine Script · Mean reversion · 3h
- Advanced Momentum EMA Trend Following with RSI Overbought Oversold Trading StrategyPine Script · Mean reversion · 1d