Strategy vault / Mean reversion
Momentum Reversal Trading Strategy 440097
This strategy identifies potential buy and sell opportunities in the market by calculating the Relative Strength Index (RSI). It utilizes the RSI indicator to spot points where price may reverse from a trend to a…
Overview
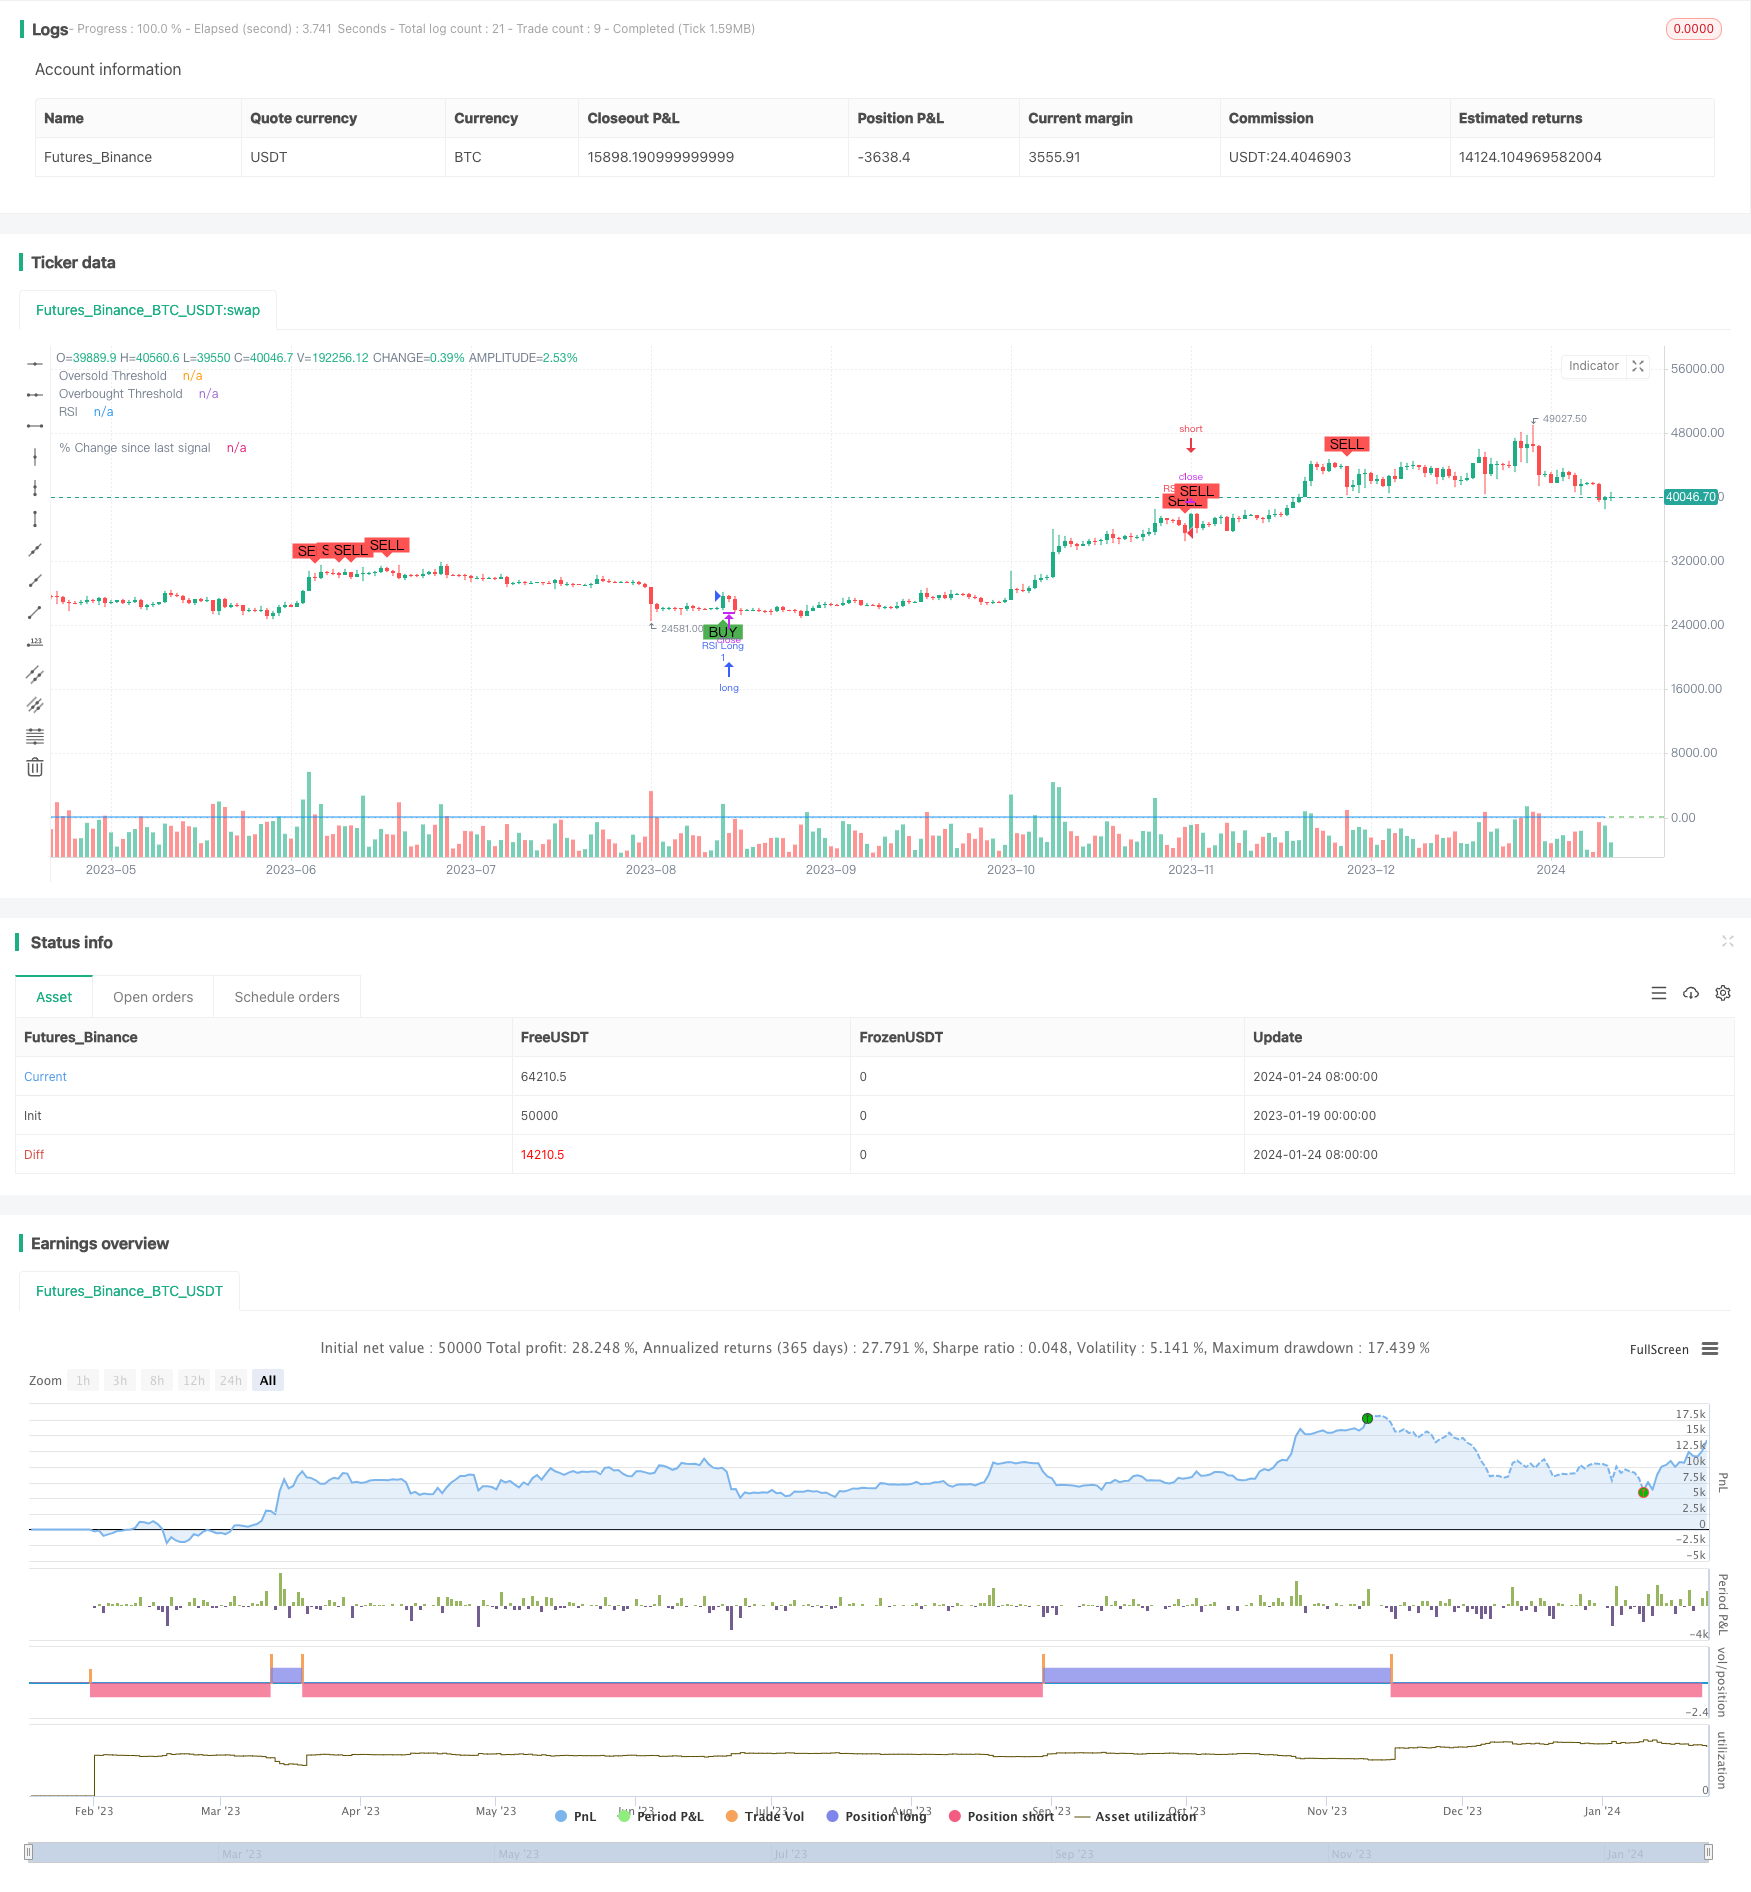
This strategy identifies potential buy and sell opportunities in the market by calculating the Relative Strength Index (RSI). It utilizes the RSI indicator to spot points where price may reverse from a trend to a counter-trend, in order to capture reversal opportunities. Trading signals are generated when the RSI reverses from overbought or oversold territories.
Strategy Logic
The core indicator of this strategy is RSI. It shows the ratio of upward price closes to downward price closes over a period of time, used to judge if an asset is overvalued or undervalued. RSI fluctuates between 0 to 100, with high values indicating a strong upward market and low values indicating a strong downward market.
The strategy first sets the parameters for RSI, including period length (default 14) and threshold values for overbought/oversold territories (default 70/30). It then calculates the RSI value based on closing prices. Buy signals are generated when RSI crosses above the oversold threshold, and sell signals when RSI crosses below the overbought threshold.
The strategy also plots the RSI line, as well as the threshold lines. Buy and sell signals are marked on the price chart with text and shapes. Additionally, the percentage change since the last signal is calculated and plotted to give traders an intuitive view of post-signal price moves.
Advantage Analysis
- Utilizes RSI's ability to judge overbought/oversold to effectively identify reversals
- Clear visualization of entry points with trading signals
- Displays percentage change since last signal to judge effectiveness of reversals
- Customizable RSI parameters suit different periods and assets
- Can be used alone or combined with other indicators to improve strategy
Risk Analysis
- Possibilities of fake signals where no actual reversal is triggered
- Insufficient trend continuation after reversal, could be short-term corrections
- Higher probability of RSI failure in high volatility periods
- Recommend combining with volume/price indicators to ensure signal reliability
- Threshold zones should be adjusted properly to reduce fake signals
Optimization Directions
- Add stop loss to control single trade loss
- Combine with Moving Averages etc. to avoid false breakouts
- Test RSI periods of different lengths
- Optimize overbought/oversold threshold values based on market conditions
- Add position management for exponential growth of profitable positions
Summary
This strategy is designed based on the reversal trading logic of RSI, mainly judging if assets are significantly overbought or oversold in the short-term, in order to capture subsequent reversals. The percentage change calculation and visual trading prompts can aid in trading decisions. RSI parameters can be customized based on user preferences. Combining with other indicators to improve signal reliability and proper optimizations to reduce fake signals are future enhancement directions for this strategy.
Parameters
| Name | Default | What it controls |
|---|---|---|
| v_input_1 | 14 | RSI Length |
| v_input_2 | 30 | Oversold Threshold |
| v_input_3 | 70 | Overbought Threshold |
Source Pine Script
/*backtest
start: 2023-01-19 00:00:00
end: 2024-01-25 00:00:00
period: 1d
basePeriod: 1h
exchanges: [{"eid":"Futures_Binance","currency":"BTC_USDT"}]
*/

//@version=5
strategy("Improved RSI Strategy", overlay=true)

// Define RSI parameters
rsiLength = input(14, title="RSI Length")
rsiOversold = input(30, title="Oversold Threshold")
rsiOverbought = input(70, title="Overbought Threshold")

// Calculate RSI
rsiValue = ta.rsi(close, rsiLength)

// Define entry conditions
longCondition = ta.crossover(rsiValue, rsiOversold)
shortCondition = ta.crossunder(rsiValue, rsiOverbought)

// Plot RSI and thresholds
plot(rsiValue, title="RSI", color=color.blue)
hline(rsiOversold, title="Oversold Threshold", color=color.red)
hline(rsiOverbought, title="Overbought Threshold", color=color.green)

// Calculate percentage change since last signal
var float percentageChange = na
lastCloseValue = ta.valuewhen(longCondition or shortCondition, close, 1)

if longCondition or shortCondition
    percentageChange := (close - lastCloseValue) / lastCloseValue * 100

plot(percentageChange, color=color.blue, style=plot.style_histogram, linewidth=1, title="% Change since last signal")

// Execute strategy
if longCondition
    strategy.entry("RSI Long", strategy.long)

if shortCondition
    strategy.entry("RSI Short", strategy.short)

// Plot shapes and text for buy/sell signals
plotshape(series=longCondition, title="Buy Signal", location=location.belowbar, color=color.green, style=shape.labelup, text="BUY")
plotshape(series=shortCondition, title="Sell Signal", location=location.abovebar, color=color.red, style=shape.labeldown, text="SELL")
Published by ChaoZhang on the FMZ strategy square · last modified 2024-01-26. Collected in the Quant Trading Vault. Unvalidated research: re-test with your own data and costs before trusting it.
Build this with AgenKit
A spec is not a trading system. Paste this into your coding agent and AgenKit runs a specialist team — architecture, test-first build, risk gates, review — with paper trading on by default.
/agenkit build a production-grade trading bot with a backtest engine, risk controls and paper trading by default from strategies/Momentum-Reversal-Trading-Strategy-440097.md- npx agenkit install engineering-kit in your project
- Paste the command into your agent and approve each phase
- Get tests, backtest, risk controls and a paper-trading switch
Understand it first
Before you run this, read the lesson behind the idea and how to backtest it honestly. Specs like this one are the survivors of an unknown number of trials; deflate their results accordingly.
Related specs
- ATR and EMA based Dynamic Take Profit and Stop Loss Adaptive StrategyPine Script · Mean reversion · 1h
- Adaptive Mean Reversion Trading Strategy Based on Chande Momentum OscillatorPine Script · Mean reversion · 1d
- Adaptive RSI Oscillator Dynamic Trading Strategy with Threshold OptimizationPine Script · Mean reversion · 1d
- Advanced 15 Minute Chart Trading Signal StrategyPine Script · Mean reversion · 3h
- Advanced Fibonacci Retracement Trend Following and Reversal Trading StrategyPine Script · Mean reversion · 3h
- Advanced Momentum EMA Trend Following with RSI Overbought Oversold Trading StrategyPine Script · Mean reversion · 1d