Momentum Rotation Across Timeframes Trend Following Strategy
This strategy uses a combination of moving averages across time frames to identify trend rotations on large and medium hourly charts, enabling low-risk trend following trading. The strategy has the advantages of…
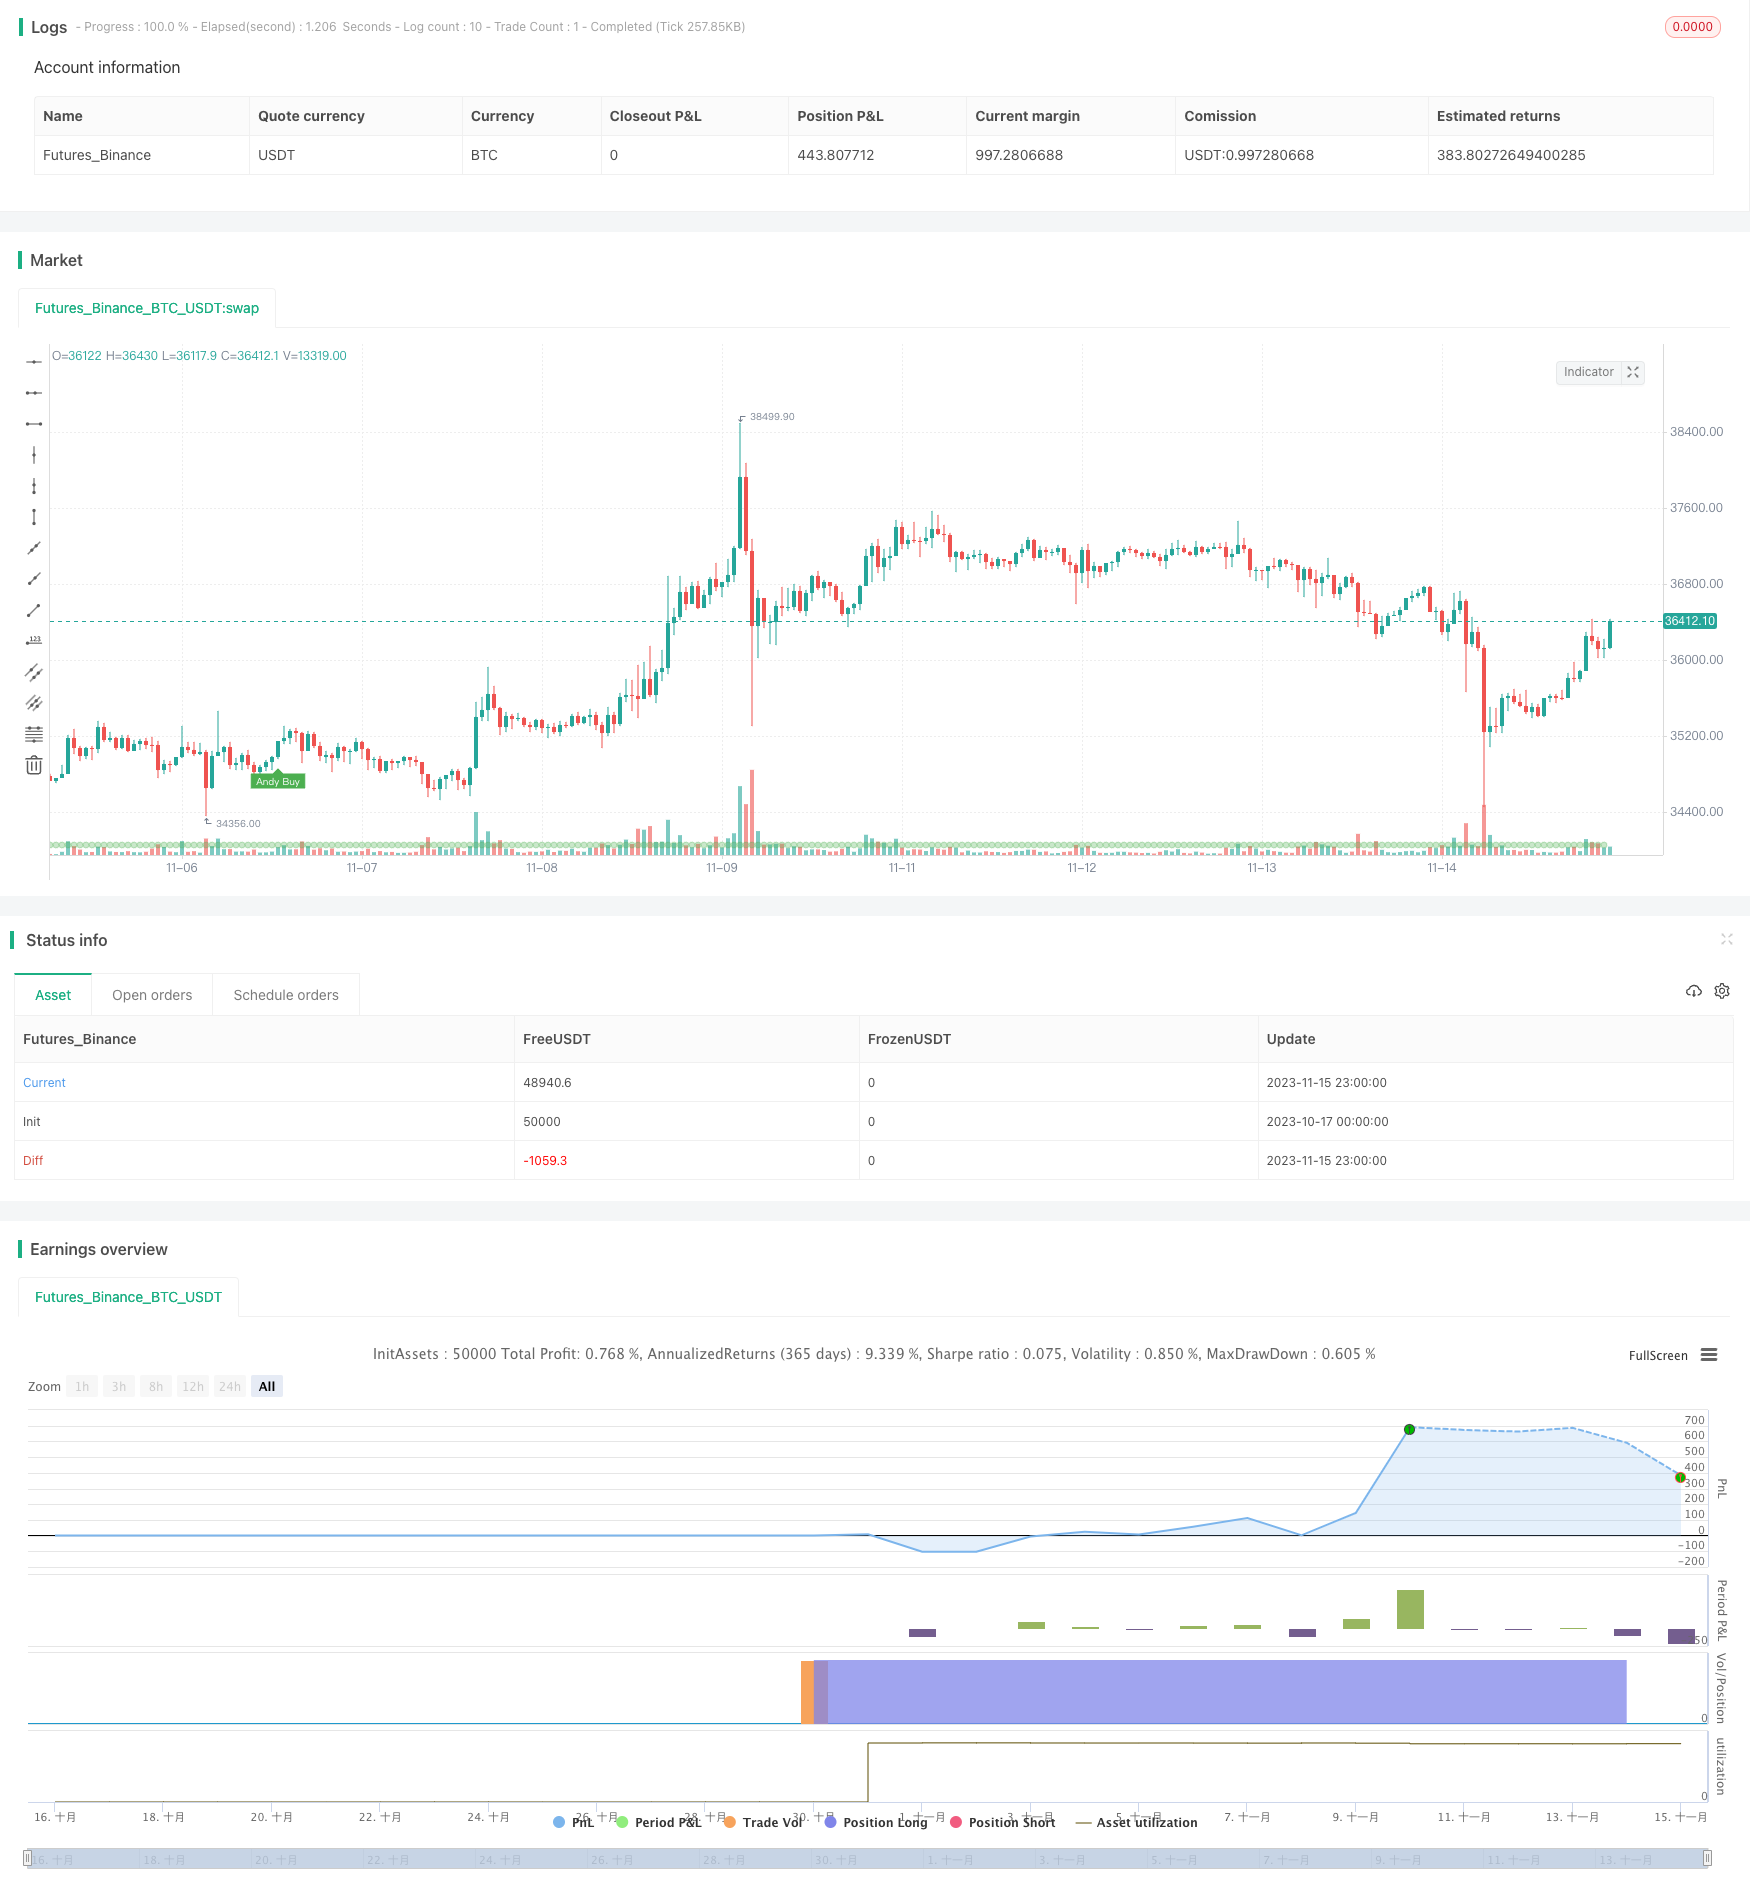
Overview
This strategy uses a combination of moving averages across time frames to identify trend rotations on large and medium hourly charts, enabling low-risk trend following trading. The strategy has the advantages of flexible configuration, simple implementation, and high capital efficiency, and is suitable for traders who hold medium and long-term positions to follow the trend.
Principle analysis
The strategy uses three moving averages on the 5th, 20th, and 40th to determine the permutations and combinations of trends under different time frames. Determine the long and short cycles based on the consistency principle of large, medium and hourly charts.
Specifically, when the 5-day fast line crosses the 20-day midline, it is regarded as a short-term rising signal, and when the 20-day midline crosses the 40-day slow line, it is regarded as a mid-line rising signal. When the three lines of fast, medium and slow are aligned (5th > 20th > 40th), it is judged to be a long cycle; when the three lines of fast, medium and slow are aligned in reverse (5th < 20th < 40th), it is judged to be a short cycle.
In this way, the direction is determined based on the trend of the large cycle, and then the specific entry is detected based on the strength of the small cycle. That is, only open positions when the general trend is in the same direction and the small cycle is strong, which can effectively filter out false breakthroughs in reversal and achieve high winning rate operations.
In addition, the strategy uses ATR stop loss to control single trade risk, further improving the profitability.
Advantage Analysis
Flexible Configuration: Users can adjust moving average parameters themselves to suit different instruments and trading preferences.
Simple to implement, even beginner users can use it easily
High capital utilization efficiency, can fully leverage the effect of capital.
Risk controllable; stop-loss mechanism effectively prevents major losses
Strong trend-following ability, continuous profits after determining direction in large cycles.
High win rate, good quality trading signals, fewer track-switching operational errors.
Risk and improvement
Judgment of large cycles relies on the arrangement of moving averages, and there is a risk of lagging and misjudgment.
Small-period strength detection uses only one candlestick, which may trigger prematurely, can be appropriately relax
Stop-loss magnitude is fixed, can be optimized to dynamic stop-loss
Consider adding additional filtering conditions, such as trading volume and momentum.
Can try different moving average parameter combinations to optimize the strategy.
Summary
This strategy integrates multi-time frame analysis and stop-loss management to achieve low-risk trend following trading. By adjusting parameters, it can be applied to different varieties to meet the needs of trend followers. Compared with traditional single time frame systems, its trading decisions are more robust and its signals are more efficient. Overall, this strategy has good market adaptability and development prospects.
Overview
This strategy uses a combination of moving averages across timeframes to identify trend rotations on the hourly, daily and weekly charts. It allows low-risk trend following trading. The strategy is flexible, simple to implement, capital efficient and suitable for medium-long term trend traders.
Trading Logic
The strategy employs 5, 20 and 40-day moving averages to determine the alignment of trends across different timeframes. Based on the consistency between larger and smaller timeframes, it identifies bullish and bearish cycles.
Specifically, the crossing of 5-day fast MA above 20-day medium MA indicates an uptrend in the short term. The crossing of 20-day medium MA above 40-day slow MA signals an uptrend in the medium term. When the fast, medium and slow MAs are positively aligned (5-day > 20-day > 40-day), it is a bull cycle. When they are negatively aligned (5-day < 20-day < 40-day), it is a bear cycle.
By determining direction from the larger cycles and confirming strength on the smaller cycles, this strategy opens positions only when major trend and minor momentum align. This effectively avoids false breakouts and achieves high win rate.
The strategy also utilizes ATR trailing stops to control single trade risks and further improve profitability.
Advantages
Flexible configurations to suit different instruments and trading styles
Simple to implement even for beginner traders
High capital efficiency to maximize leverage
Effective risk control to avoid significant losses
Strong trend following ability for sustained profits
High win rate due to robust signals and fewer whipsaws
Risks and Improvements
MA crossovers may lag and cause late trend detection
Single candle strength detection could trigger premature entry, relax condition
Fixed ATR stop loss, optimize to dynamic stops
Consider adding supplementary filters like volume
Explore different MA parameters for optimization
Conclusion
This strategy integrates multiple timeframe analysis and risk management for low-risk trend following trading. By adjusting parameters, it can be adapted to different instruments to suit trend traders. Compared to single timeframe systems, it makes more robust trading decisions and generates higher efficiency signals. In conclusion, this strategy has good market adaptiveness and development potential.
Parameters
| Name | Default | What it controls |
|---|---|---|
| v_input_1 | 2 | Key Vaule. 'This changes the sensitivity' |
| v_input_2 | 7 | ATR Period |
| v_input_int_1 | 25 | atr_length |
| v_input_bool_1 | true | (?Performance - credits: @QuantNomad)Show Monthly Performance ? |
| v_input_3 | 2 | Return Precision |
Source Pine Script
/*backtest
start: 2023-10-17 00:00:00
end: 2023-11-16 00:00:00
period: 1h
basePeriod: 15m
exchanges: [{"eid":"Futures_Binance","currency":"BTC_USDT"}]
*/

// This source code is subject to the terms of the Mozilla Public License 2.0 at https://mozilla.org/MPL/2.0/
// © kgynofomo

//@version=5
strategy(title="[Salavi] | Andy Advance Pro Strategy [BTC|M15]",overlay = true, pyramiding = 1,initial_capital = 10000, default_qty_type = strategy.cash,default_qty_value = 10000)

ema_short = ta.ema(close,5)
ema_middle = ta.ema(close,20)
ema_long = ta.ema(close,40)

cycle_1 = ema_short>ema_middle and ema_middle>ema_long
cycle_2 = ema_middle>ema_short and ema_short>ema_long
cycle_3 = ema_middle>ema_long and ema_long>ema_short
cycle_4 = ema_long>ema_middle and ema_middle>ema_short
cycle_5 = ema_long>ema_short and ema_short>ema_middle
cycle_6 = ema_short>ema_long and ema_long>ema_middle

bull_cycle = cycle_1 or cycle_2 or cycle_3
bear_cycle = cycle_4 or cycle_5 or cycle_6
// label.new("cycle_1")
// bgcolor(color=cycle_1?color.rgb(82, 255, 148, 60):na)
// bgcolor(color=cycle_2?color.rgb(82, 255, 148, 70):na)
// bgcolor(color=cycle_3?color.rgb(82, 255, 148, 80):na)
// bgcolor(color=cycle_4?color.rgb(255, 82, 82, 80):na)
// bgcolor(color=cycle_5?color.rgb(255, 82, 82, 70):na)
// bgcolor(color=cycle_6?color.rgb(255, 82, 82, 60):na)

// Inputs
a = input(2, title='Key Vaule. \'This changes the sensitivity\'')
c = input(7, title='ATR Period')
h = false

xATR = ta.atr(c)
nLoss = a * xATR

src = h ? request.security(ticker.heikinashi(syminfo.tickerid), timeframe.period, close, lookahead=barmerge.lookahead_off) : close

xATRTrailingStop = 0.0
iff_1 = src > nz(xATRTrailingStop[1], 0) ? src - nLoss : src + nLoss
iff_2 = src < nz(xATRTrailingStop[1], 0) and src[1] < nz(xATRTrailingStop[1], 0) ? math.min(nz(xATRTrailingStop[1]), src + nLoss) : iff_1
xATRTrailingStop := src > nz(xATRTrailingStop[1], 0) and src[1] > nz(xATRTrailingStop[1], 0) ? math.max(nz(xATRTrailingStop[1]), src - nLoss) : iff_2

pos = 0
iff_3 = src[1] > nz(xATRTrailingStop[1], 0) and src < nz(xATRTrailingStop[1], 0) ? -1 : nz(pos[1], 0)
pos := src[1] < nz(xATRTrailingStop[1], 0) and src > nz(xATRTrailingStop[1], 0) ? 1 : iff_3

xcolor = pos == -1 ? color.red : pos == 1 ? color.green : color.blue

ema = ta.ema(src, 1)
above = ta.crossover(ema, xATRTrailingStop)
below = ta.crossover(xATRTrailingStop, ema)

buy = src > xATRTrailingStop and above
sell = src < xATRTrailingStop and below

barbuy = src > xATRTrailingStop
barsell = src < xATRTrailingStop


atr = ta.atr(14)
atr_length = input.int(25)
atr_rsi = ta.rsi(atr,atr_length)
atr_valid = atr_rsi>50

long_condition =  buy and bull_cycle and atr_valid
short_condition =  sell and bear_cycle and atr_valid

Exit_long_condition = short_condition
Exit_short_condition = long_condition

if long_condition
    strategy.entry("Andy Buy",strategy.long, limit=close,comment="Andy Buy Here")

if Exit_long_condition
    strategy.close("Andy Buy",comment="Andy Buy Out")
    // strategy.entry("Andy fandan Short",strategy.short, limit=close,comment="Andy Reorder short Here")
    // strategy.close("Andy fandan Buy",comment="Andy short Out")


if short_condition
    strategy.entry("Andy Short",strategy.short, limit=close,comment="Andy short Here")


// strategy.exit("STR","Long",stop=longstoploss)
if Exit_short_condition
    strategy.close("Andy Short",comment="Andy short Out")
    // strategy.entry("Andy fandan Buy",strategy.long, limit=close,comment="Andy Reorder Buy Here")
    // strategy.close("Andy fandan Short",comment="Andy Buy Out")


inLongTrade = strategy.position_size > 0
inLongTradecolor = #58D68D
notInTrade = strategy.position_size == 0
inShortTrade = strategy.position_size < 0

// bgcolor(color = inLongTrade?color.rgb(76, 175, 79, 70):inShortTrade?color.rgb(255, 82, 82, 70):na)
plotshape(close!=0,location = location.bottom,color = inLongTrade?color.rgb(76, 175, 79, 70):inShortTrade?color.rgb(255, 82, 82, 70):na)


plotshape(long_condition, title='Buy', text='Andy Buy', style=shape.labelup, location=location.belowbar, color=color.new(color.green, 0), textcolor=color.new(color.white, 0), size=size.tiny)
plotshape(short_condition, title='Sell', text='Andy Sell', style=shape.labeldown, location=location.abovebar, color=color.new(color.red, 0), textcolor=color.new(color.white, 0), size=size.tiny)


//atr > close *0.01* parameter

// MONTHLY TABLE PERFORMANCE - Developed by @QuantNomad
// *************************************************************************************************************************************************************************************************************************************************************************
show_performance = input.bool(true, 'Show Monthly Performance ?', group='Performance - credits: @QuantNomad')
prec = input(2, 'Return Precision', group='Performance - credits: @QuantNomad')

if show_performance
    new_month = month(time) != month(time[1])
    new_year  = year(time)  != year(time[1])

    eq = strategy.equity

    bar_pnl = eq / eq[1] - 1

    cur_month_pnl = 0.0
    cur_year_pnl  = 0.0

    // Current Monthly P&L
    cur_month_pnl := new_month ? 0.0 :
                     (1 + cur_month_pnl[1]) * (1 + bar_pnl) - 1

    // Current Yearly P&L
    cur_year_pnl := new_year ? 0.0 :
                     (1 + cur_year_pnl[1]) * (1 + bar_pnl) - 1

    // Arrays to store Yearly and Monthly P&Ls
    var month_pnl  = array.new_float(0)
    var month_time = array.new_int(0)

    var year_pnl  = array.new_float(0)
    var year_time = array.new_int(0)

    last_computed = false

    if (not na(cur_month_pnl[1]) and (new_month or barstate.islastconfirmedhistory))
        if (last_computed[1])
            array.pop(month_pnl)
            array.pop(month_time)

        array.push(month_pnl , cur_month_pnl[1])
        array.push(month_time, time[1])

    if (not na(cur_year_pnl[1]) and (new_year or barstate.islastconfirmedhistory))
        if (last_computed[1])
            array.pop(year_pnl)
            array.pop(year_time)

        array.push(year_pnl , cur_year_pnl[1])
        array.push(year_time, time[1])

    last_computed := barstate.islastconfirmedhistory ? true : nz(last_computed[1])

    // Monthly P&L Table
    var monthly_table = table(na)

    if (barstate.islastconfirmedhistory)
        monthly_table := table.new(position.bottom_center, columns = 14, rows = array.size(year_pnl) + 1, border_width = 1)

        table.cell(monthly_table, 0,  0, "",     bgcolor = #cccccc)
        table.cell(monthly_table, 1,  0, "Jan",  bgcolor = #cccccc)
        table.cell(monthly_table, 2,  0, "Feb",  bgcolor = #cccccc)
        table.cell(monthly_table, 3,  0, "Mar",  bgcolor = #cccccc)
        table.cell(monthly_table, 4,  0, "Apr",  bgcolor = #cccccc)
        table.cell(monthly_table, 5,  0, "May",  bgcolor = #cccccc)
        table.cell(monthly_table, 6,  0, "Jun",  bgcolor = #cccccc)
        table.cell(monthly_table, 7,  0, "Jul",  bgcolor = #cccccc)
        table.cell(monthly_table, 8,  0, "Aug",  bgcolor = #cccccc)
        table.cell(monthly_table, 9,  0, "Sep",  bgcolor = #cccccc)
        table.cell(monthly_table, 10, 0, "Oct",  bgcolor = #cccccc)
        table.cell(monthly_table, 11, 0, "Nov",  bgcolor = #cccccc)
        table.cell(monthly_table, 12, 0, "Dec",  bgcolor = #cccccc)
        table.cell(monthly_table, 13, 0, "Year", bgcolor = #999999)


        for yi = 0 to array.size(year_pnl) - 1
            table.cell(monthly_table, 0,  yi + 1, str.tostring(year(array.get(year_time, yi))), bgcolor = #cccccc)

            y_color = array.get(year_pnl, yi) > 0 ? color.new(color.teal, transp = 40) : color.new(color.gray, transp = 40)
            table.cell(monthly_table, 13, yi + 1, str.tostring(math.round(array.get(year_pnl, yi) * 100, prec)), bgcolor = y_color, text_color=color.new(color.white, 0))

        for mi = 0 to array.size(month_time) - 1
            m_row   = year(array.get(month_time, mi))  - year(array.get(year_time, 0)) + 1
            m_col   = month(array.get(month_time, mi))
            m_color = array.get(month_pnl, mi) > 0 ? color.new(color.teal, transp = 40) : color.new(color.gray, transp = 40)

            table.cell(monthly_table, m_col, m_row, str.tostring(math.round(array.get(month_pnl, mi) * 100, prec)), bgcolor = m_color, text_color=color.new(color.white, 0))
Published by ChaoZhang on the FMZ strategy square · last modified 2023-11-17. Collected in the Quant Trading Vault. Unvalidated research: re-test with your own data and costs before trusting it.
Build this with AgenKit
A spec is not a trading system. Paste this into your coding agent and AgenKit runs a specialist team — architecture, test-first build, risk gates, review — with paper trading on by default.
/agenkit build a production-grade trading bot with a backtest engine, risk controls and paper trading by default from strategies/Momentum-Rotation-Across-Timeframes-Trend-Following-Strategy.md- npx agenkit install engineering-kit in your project
- Paste the command into your agent and approve each phase
- Get tests, backtest, risk controls and a paper-trading switch
Understand it first
Before you run this, read the lesson behind the idea and how to backtest it honestly. Specs like this one are the survivors of an unknown number of trials; deflate their results accordingly.
Related specs
- Advanced Multi Indicator Trend Following and Momentum Quantitative Trading StrategyPine Script · Momentum · 1h
- Cross Period Momentum EMA Strategy with RSI and Dynamic ATR Stop LossPine Script · Momentum · 1d
- Dual EMA Crossover with RSI Momentum Enhanced Trading StrategyPine Script · Momentum · 1d
- Dynamic Trend Channel and Relative Strength Momentum Trading StrategyPine Script · Momentum · 3h
- KST EMA Momentum Trend Following StrategyPine Script · Momentum · 1d
- Multi EMA Trend Momentum Trading Strategy with Risk Management SystemPine Script · Momentum · 1h