Momentum Trend Strategy 440064
This strategy combines various technical indicators such as moving average, relative strength index (RSI), volume fluctuation indicator (VFI), and true strength index (TSI) to determine the overall momentum and trend…
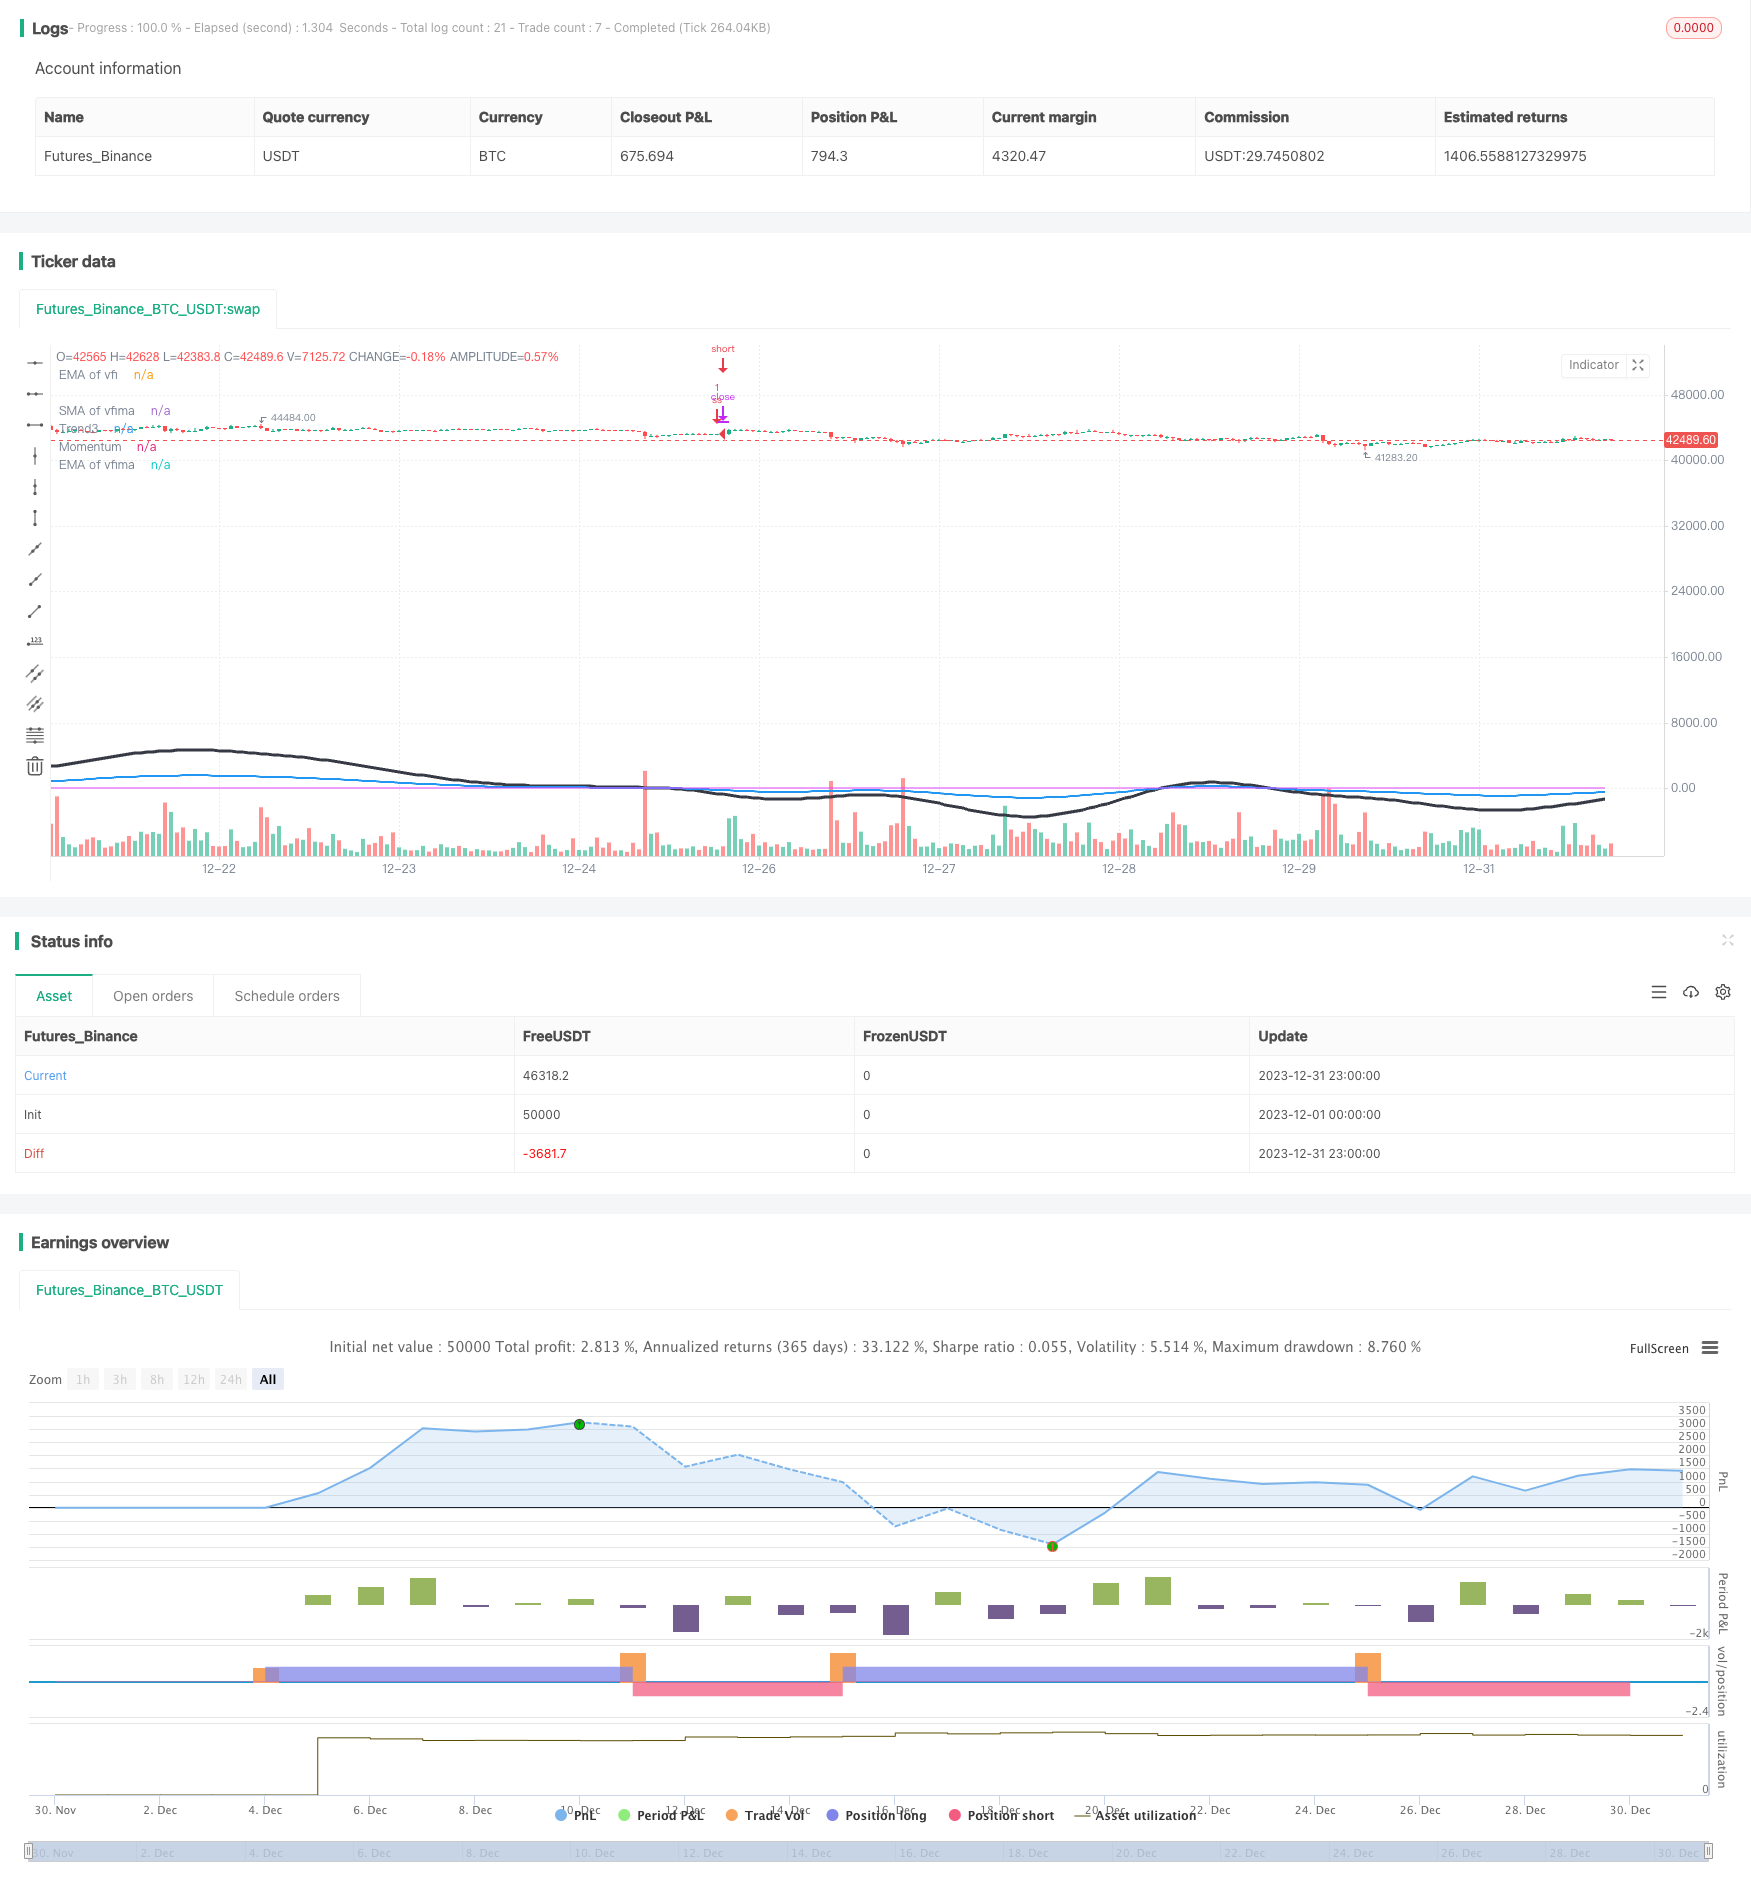
Overview
This strategy combines various technical indicators such as moving average, relative strength index (RSI), volume fluctuation indicator (VFI), and true strength index (TSI) to determine the overall momentum and trend of the market and capture mid-to-long term price movements.
Strategy Logic
Calculate moving averages of fast line RSI (7-day), normal line RSI (14-day), and slow line RSI (50-day) to determine RSI trend and momentum.
Calculate VFI and moving averages VFI EMA (25-day) and VFI SMA (25-day) to gauge funds inflow and outflow.
Calculate ratio of long term moving average and short term moving average of TSI to determine strength of market trend.
Integrate RSI, VFI and TSI results to derive overall market momentum direction.
Take short position when downward momentum is identified. Cover short when momentum reversal is detected.
Advantage Analysis
Combination of multiple indicators allows more comprehensive and accurate measurement of overall market momentum and trend.
VFI reflects market funds flow, avoiding trading against trend.
TSI filters out market choppiness, making signals more reliable.
Overall, the strategy has high reliability and good win rate.
Risk Analysis
Complex parameter tuning required for optimal results from multi-indicator setup.
Simple entry and exit rules unable to fully capitalize indicator information, prone to short term reversal losses.
Susceptible to false signals and small pullback losses in ranging, choppy markets.
Optimization Directions
Optimize indicator combinations to find best parameters.
Enhance exit rules based on indicator conditions to catch reversals.
Build profit protection mechanisms to reduce losses from choppiness.
Summary
This strategy combines multiple indicators to gauge overall market momentum and takes short positions when downward momentum identified. It has relatively high reliability but simple entry/exit rules unable to fully utilize indicator information. Further enhancements to parameters and exit logic can improve stability and profitability. ]
Parameters
| Name | Default | What it controls |
|---|---|---|
| v_input_1 | 50 | length |
| v_input_2 | 50 | overSold |
| v_input_3 | 65 | overBought |
| v_input_4 | 12 | fastLength |
| v_input_5 | 26 | slowlength |
| v_input_6 | 9 | MACDLength |
| v_input_7 | 7 | v_input_7 |
| v_input_8 | 14 | v_input_8 |
| v_input_9 | 50 | v_input_9 |
| v_input_10 | true | Exponential MA |
| v_input_11 | true | Exponential MA |
| v_input_12 | true | Exponential MA |
| v_input_13 | 130 | VFI length |
| v_input_14 | 0.2 | coef |
| v_input_15 | 2.5 | Max. vol. cutoff |
| v_input_16 | 10 | signalLength |
| v_input_17 | 100 | signalLength2 |
| v_input_18 | false | smoothVFI |
| v_input_19 | 24 | Long Length |
| v_input_20 | 7 | Short Length |
| v_input_21 | 13 | Signal Length |
Source Pine Script
//@version=2
//credit to LazyBear, Lewm444, and others for direct and indirect inputs/////////////////////////////////
//script is very rough, publishing more for collaborative input value than as a finished product/////////
strategy("Momo", overlay=true)
length = input( 50 )
overSold = input( 50 )
overBought = input( 65 )
price = ohlc4

/////////////////////////////////////////////////////macd/////////////////////////////////////////////////

fastLength = input(12)
slowlength = input(26)
MACDLength = input(9)

fast = 12, slow = 26
fastMA = ema(close, fast)
slowMA = ema(close, slow)
MACD = (fastMA - slowMA)
Msignal = (sma(MACD, 9))*40
//plot(Msignal, color=blue, linewidth=3)

/////////////////////////////////////////////////rsi spread/////////////////////////////////////////////////

source = price

RSIFast  = rsi(source, input(7))
RSINorm  = rsi(source, input(14))
RSISlow = rsi(source, input(50))

//plot(RSIFast, color=silver, style=area, histbase=50)
//plot(RSINorm, color=#98b8be, style=area, histbase=50)
//plot(RSISlow, color=#be9e98, style=area, histbase=50)

//plot(RSIFast, color=gray, style=line, linewidth=1)
//plot(RSINorm, color=purple, style=line, linewidth=2)
//plot(RSISlow, color=black, style=line, linewidth=3)

exponential = input(true, title="Exponential MA")

src = (RSIFast)

ma05 = exponential ? ema(src, 05) : sma(src, 05)
ma30 = exponential ? ema(src, 30) : sma(src, 30)
ma50 = exponential ? ema(src, 50) : sma(src, 50)
ma70 = exponential ? ema(src, 70) : sma(src, 70)
ma90 = exponential ? ema(src, 90) : sma(src, 90)
ma100 = exponential ? ema(src, 100) : sma(src, 100)

exponential1 = input(true, title="Exponential MA")

src1 = (RSINorm)

ma051 = exponential1 ? ema(src1, 05) : sma(src1, 05)
ma301 = exponential1 ? ema(src1, 30) : sma(src1, 30)
ma501 = exponential1 ? ema(src1, 50) : sma(src1, 50)
ma701 = exponential1 ? ema(src1, 70) : sma(src1, 70)
ma901 = exponential1 ? ema(src1, 90) : sma(src1, 90)
ma1001 = exponential1 ? ema(src1, 100) : sma(src1, 100)


exponential2 = input(true, title="Exponential MA")

src2 = (RSINorm)

ma052 = exponential2 ? ema(src2, 05) : sma(src2, 05)
ma302 = exponential2 ? ema(src2, 30) : sma(src2, 30)
ma502 = exponential2 ? ema(src2, 50) : sma(src2, 50)
ma702 = exponential2 ? ema(src2, 70) : sma(src2, 70)
ma902 = exponential2 ? ema(src2, 90) : sma(src2, 90)
ma1002 = exponential2 ? ema(src2, 100) : sma(src2, 100)


////////////////////////////////////////////////vfi by LazyBear, modified////////////////////////////////////

VFIlength = input(130, title="VFI length")
coef = input(0.2)
vcoef = input(2.5, title="Max. vol. cutoff")
signalLength=input(10)
signalLength2 = input(100)
smoothVFI=input(false, type=bool)

ma(x,y) => smoothVFI ? sma(x,y) : x

typical=hlc3
inter = log( typical ) - log( typical[1] )
vinter = stdev(inter, 30 )
cutoff = coef * vinter * close
vave = sma( volume, VFIlength )[1]
vmax = vave * vcoef
vc = iff(volume < vmax, volume, vmax) //min( volume, vmax )
mf = typical - typical[1]
vcp = iff( mf > cutoff, vc, iff ( mf < -cutoff, -vc, 0 ) )

vfi = ma(sum( vcp , VFIlength )/vave, 3)
vfima = ema( vfi, 25 )
vfimaS = (sma(vfima, 25))
zima = ema( vfima, signalLength2 )
d=vfi-vfima
vfi_avg = avg(vfi, vfima, vfimaS)
vfi_avgS = (sma(vfi_avg,5))

plot( zima, title="EMA of vfima", color=fuchsia, linewidth=1)
plot( vfimaS, title="SMA of vfima", color=blue, linewidth=1)
plot( vfima , title="EMA of vfi", color=black, linewidth=1)
//plot( vfi, title="vfi", color=green,linewidth=1)
//plot( vfi_avg, title="vfi_avg", color=blue, linewidth=2)
//plot( vfi_avgS, title="vfi_avgS", color=maroon, linewidth=2)

/////////////////////////////////////////////////////tsi////////////////////////////////////////////////

long2 = input(title="Long Length",  defval=24)
short2 = input(title="Short Length",  defval=7)
signal2 = input(title="Signal Length",  defval=13)
pc = change(price)
double_smooth2(src, long2, short2) =>
    fist_smooth2 = ema(src, long2)
    ema(fist_smooth2, short2)
double_smoothed_pc2 = double_smooth2(pc, long2, short2)
double_smoothed_abs_pc2 = double_smooth2(abs(pc), long2, short2)
tsi_value2 = 60 * (double_smoothed_pc2 / double_smoothed_abs_pc2)
//plot( tsi_value2, title="tsi2", color=black, linewidth=1)

////////////////////////////////////////////////////////mjb////////////////////////////////////////////////

trendSignal = avg(tsi_value2, Msignal, vfi)*1.75
T1 = sma(trendSignal, 5)
T2 = ema(trendSignal, 25)
T3 = ema(T2, 25)
//plot( T1, title="Trend", color=red, linewidth=3)
plot( T3, title="Trend3", color=black, linewidth=3)

/////////////////////////////////////////////////////mjb////////////////////////////////////////////////

Momentum = avg (T3, vfimaS, vfima)
plot( Momentum, title="Momentum", color=blue, linewidth=2)
vrsi = rsi(price, length)
clearance = abs(zima - Msignal)

/////////////////////////////////////////////////////mjb////////////////////////////////////////////////

if (not na(vrsi))
    if (zima > T3) and (clearance > 5) and (falling(zima, 1) == 1) and (zima > vfimaS) and (zima > vfima) and (falling(T3, 1) == 1) and (zima > 6)
        strategy.entry("ss", strategy.short)
    if (T3 > zima) and (rising(zima, 1) == 1)
        strategy.entry("Zcover", strategy.long)
    if (strategy.openprofit > 750) and (rising(T2, 1) == 1) and (T2 > 10)
        strategy.entry("ProfitTake", strategy.long)
// strategy.risk.allow_entry_in(strategy.direction.short)
// strategy.risk.max_intraday_loss(2000, strategy.cash) Published by ChaoZhang on the FMZ strategy square · last modified 2024-01-26. Collected in the Quant Trading Vault. Unvalidated research: re-test with your own data and costs before trusting it.
Build this with AgenKit
A spec is not a trading system. Paste this into your coding agent and AgenKit runs a specialist team — architecture, test-first build, risk gates, review — with paper trading on by default.
/agenkit build a production-grade trading bot with a backtest engine, risk controls and paper trading by default from strategies/Momentum-Trend-Strategy-440064.md- npx agenkit install engineering-kit in your project
- Paste the command into your agent and approve each phase
- Get tests, backtest, risk controls and a paper-trading switch
Understand it first
Before you run this, read the lesson behind the idea and how to backtest it honestly. Specs like this one are the survivors of an unknown number of trials; deflate their results accordingly.
Related specs
- KST EMA Momentum Trend Following StrategyPine Script · Momentum · 1d
- MACD Momentum Indicator Backtest StrategyPine Script · Momentum · 1h
- MoonFlag MACD Momentum StochRSI Trading StrategyPine Script · Momentum · 1d
- Multi Indicator Trend Momentum Trading Strategy with Dynamic Risk Management SystemPine Script · Momentum · 1h
- Multi factor Adaptive Momentum Tracking StrategyPine Script · Momentum · 3m
- Dual Momentum Oscillator Smart Timing Trading StrategyPine Script · Momentum · 1h