Momentum Trend Strategy Based on MACD and Bollinger Bands
The strategy is named "Momentum Trend". It combines the advantages of MACD indicator and Bollinger Bands to implement a trend tracking strategy. The strategy uses MACD fast line and slow line to build Bollinger…
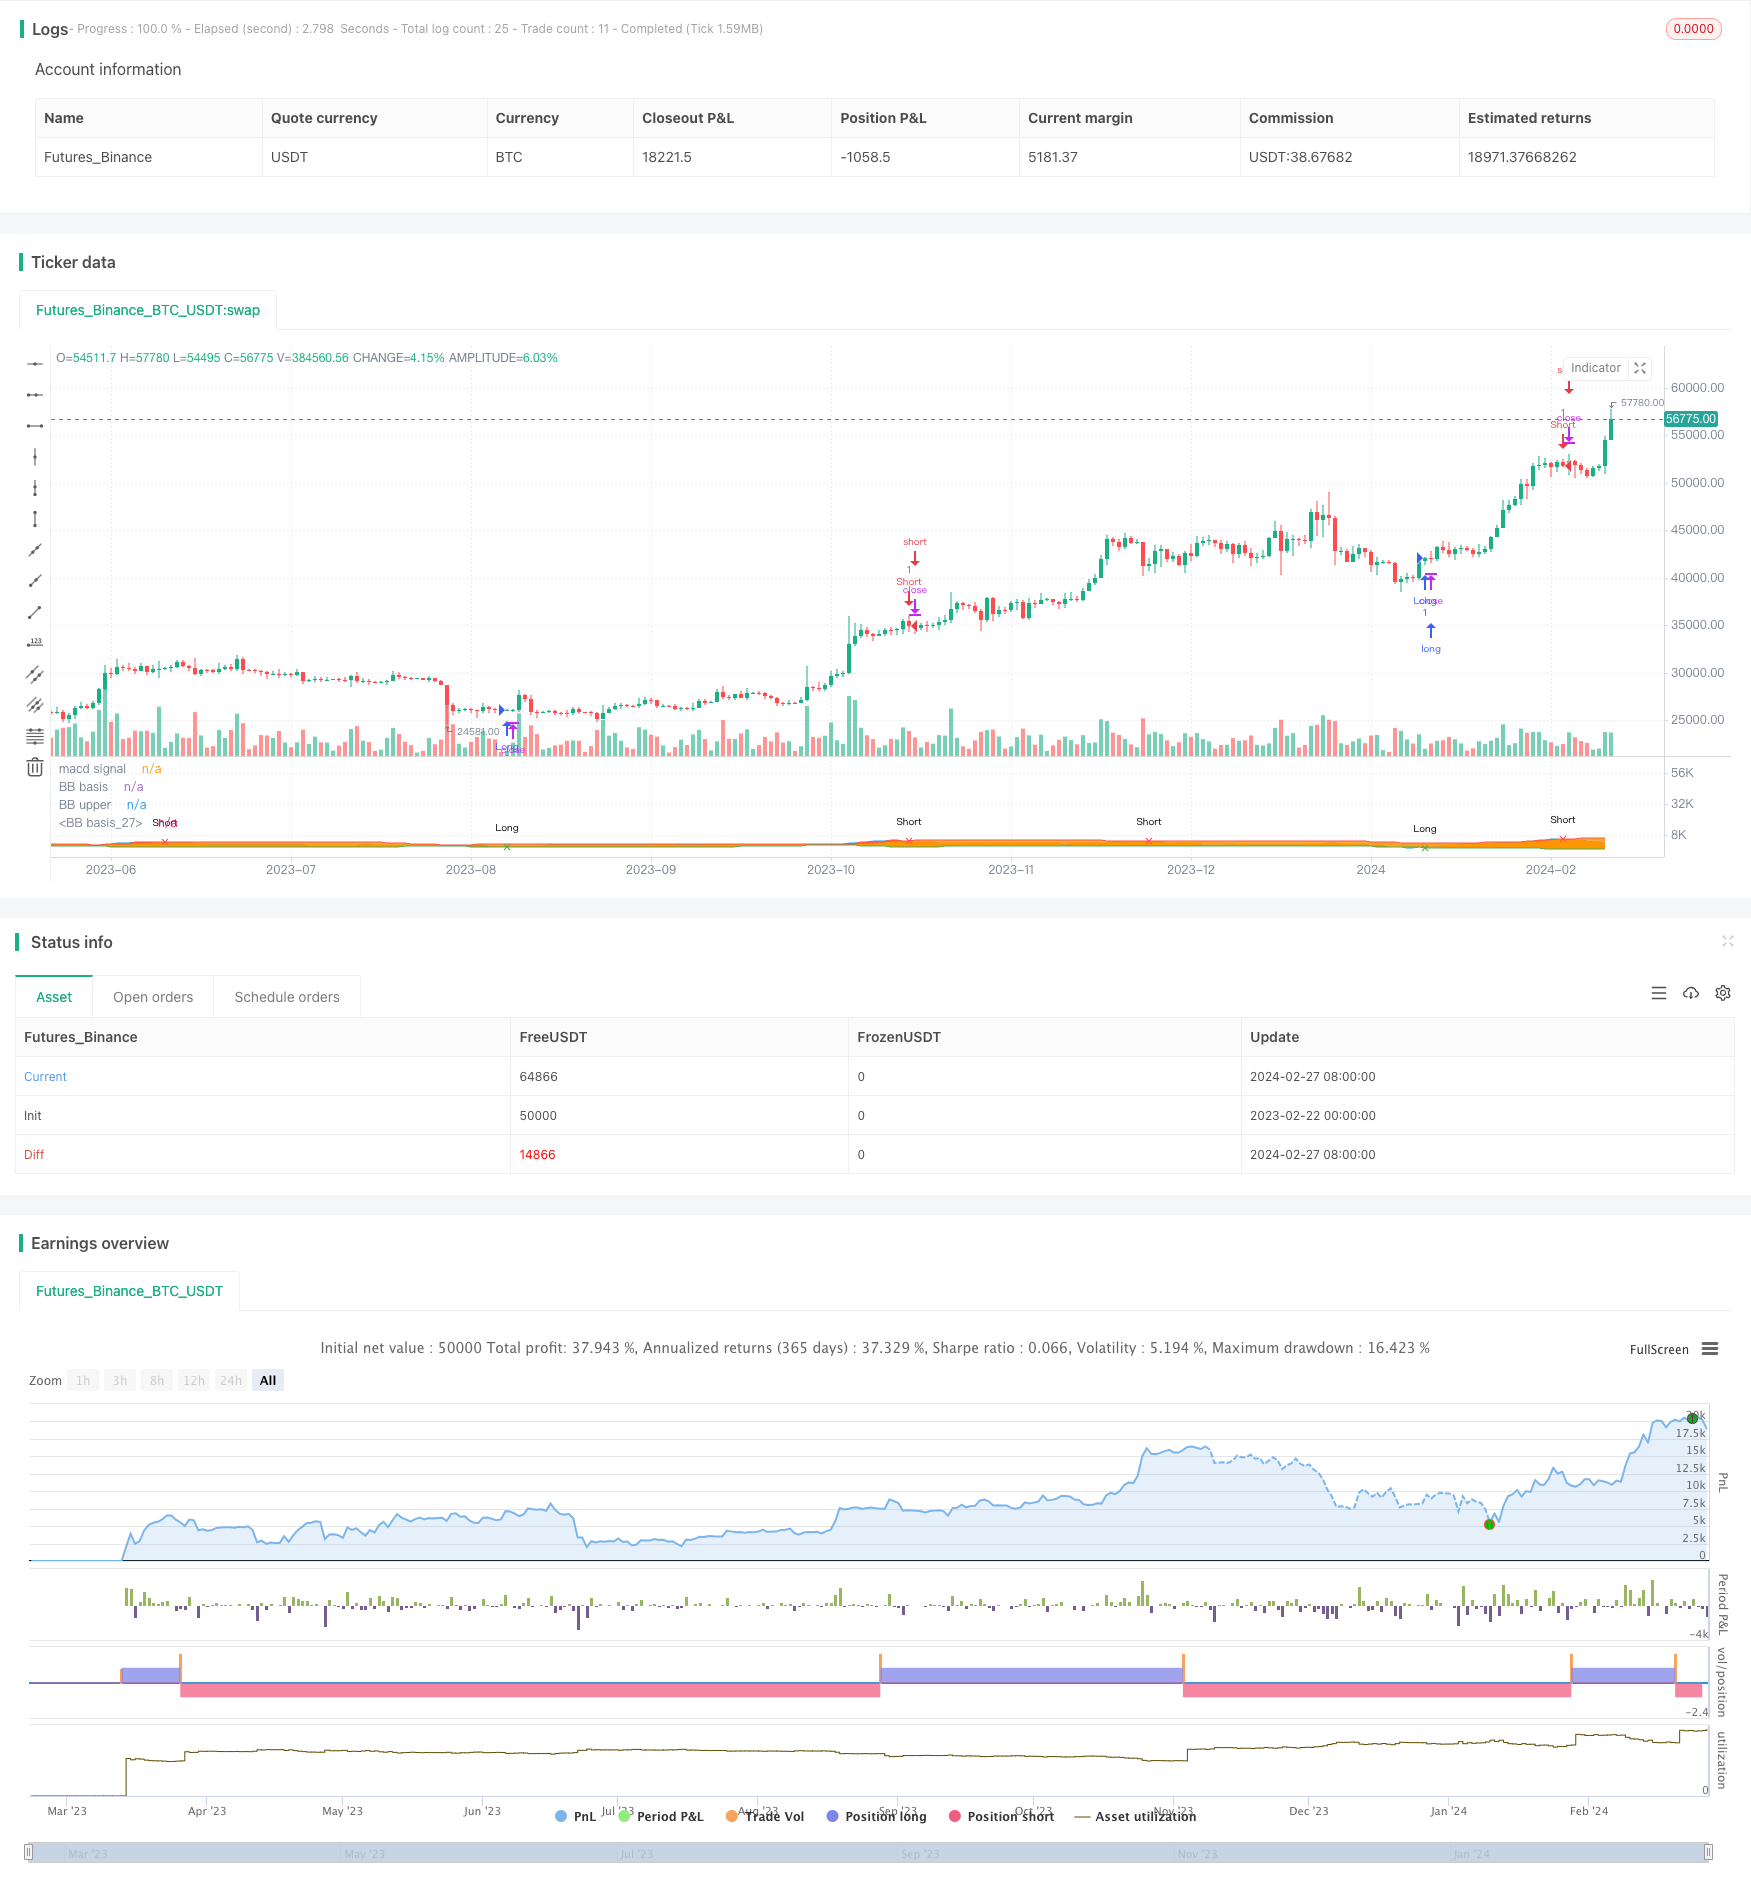
Overview
The strategy is named "Momentum Trend". It combines the advantages of MACD indicator and Bollinger Bands to implement a trend tracking strategy. The strategy uses MACD fast line and slow line to build Bollinger Bands. The middle line of Bollinger Bands is the MACD signal line. It goes short when price breaks through the upper rail of Bollinger Bands and goes long when price breaks through the lower rail of Bollinger Bands. It waits for the pullback to test the middle line of Bollinger Bands before entering the market to track medium-long term trends.
Strategy Principle
The core indicators of this strategy are MACD and Bollinger Bands. MACD indicator consists of fast line, slow line and MACD histogram. The fast line is usually 12-day EMA and slow line is 26-day EMA. The difference between them is the MACD histogram. This strategy uses the difference between fast line and slow line as the base middle line of Bollinger Bands. Upper and lower rails are set around the middle line to construct Bollinger Bands.
A buy signal is generated when the price breaks through the lower rail of Bollinger Bands upwards. A sell signal is generated when the price breaks through the upper rail of Bollinger Bands downwards. To reduce the risk of being trapped and missing reversal opportunities, this strategy does not enter the market immediately after the breakout. Instead, it waits for the pullback to test the middle line of Bollinger Bands before entering.
In addition, the upper and lower rails can also be used as resistance and support respectively. When price goes up, the upper rail is resistance and the lower rail is support. When price goes down, the upper rail becomes support and lower rail becomes resistance.
Advantage Analysis
This strategy combines the advantages of MACD and Bollinger Bands to achieve trend tracking, with the following strengths:
MACD has strong trend judgment capability. Bollinger Bands can adaptively adjust itself. The combination can effectively determine trend reversal points.
Pullback entry can effectively avoid stop loss risk and track medium-long term trends.
Utilizing resistance and support on Bollinger Bands can further lock in profits.
MACD and Bollinger Bands parameters can be flexibly adjusted to suit different market environments.
Risk Analysis
There are also some risks to note for this strategy:
In oscillating trends, MACD and Bollinger Bands may generate multiple invalid signals. Position size needs to be reduced then to avoid huge losses.
Stop loss should be set during pullback entry to avoid loss enlargement from overdeep pullback.
Bollinger Bands parameters need to be adjusted based on market volatility. Improper parameter setting increases false breakout probability.
Good risk management and position sizing are the key to sustain profits for this strategy. Purely relying on strategy signals tends to neglect overall risks.
Optimization Directions
The strategy can also be optimized in the following aspects:
Optimize MACD parameters to 8-day fast line and 20-day slow line. Adjust based on different products and timeframes to improve indicator sensitivity.
Add upwards and downwards trend judgment to optimize Bollinger Bands parameters, reducing false signals in oscillating markets.
Add stop loss strategy. Set stop loss line with Bollinger Bands upper and lower rails to control risks.
Incorporate other indicators for verification to improve strategy stability.
Conclusion
The Momentum Trend strategy based on MACD and Bollinger Bands tracks medium-long term trends through indicator combo and enters on pullbacks to reduce risks. It optimizes parameter settings and controls risks. It performs well on trending products. But no strategy is perfect. We need to keep optimizing and improving from multiple perspectives for adapting to the ever-changing market environments.
Parameters
| Name | Default | What it controls |
|---|---|---|
| v_input_1 | 8 | Fast MA period |
| v_input_2 | 21 | Slow MA period |
| v_input_3_close | 0 | Source: close | high | low | open | hl2 | hlc3 | hlcc4 | ohlc4 |
| v_input_4 | true | Moving Average Calculation: (1 = SMA), (2 = EMA), (3 = WMA), (4 = Linear) |
| v_input_5 | 40 | length |
| v_input_6 | 2 | BB multiplier |
Source Pine Script
/*backtest
start: 2023-02-22 00:00:00
end: 2024-02-28 00:00:00
period: 1d
basePeriod: 1h
exchanges: [{"eid":"Futures_Binance","currency":"BTC_USDT"}]
*/

//@version=4
//Simple strategy based on MACD and Bollinger Bands, where BBs are calculatend from macd signal.
strategy("Strategy MACD vs BB", overlay=false)

fast_length = input(title="Fast MA period", type=input.integer, defval=8)
slow_length = input(title="Slow MA period", type=input.integer, defval=21)
src = input(close,"Source")


// ----------MA calculation - ChartArt-------------
smoothinput = input(1, minval=1, maxval=4, title='Moving Average Calculation: (1 = SMA), (2 = EMA), (3 = WMA), (4 = Linear)')

fast_ma = smoothinput == 1 ? sma(src, fast_length):smoothinput == 2 ? ema(src, fast_length):smoothinput == 3 ? wma(src, fast_length):smoothinput == 4 ? linreg(src, fast_length,0):na
slow_ma = smoothinput == 1 ? sma(src, slow_length):smoothinput == 2 ? ema(src, slow_length):smoothinput == 3 ? wma(src, slow_length):smoothinput == 4 ? linreg(src, slow_length,0):na
//----------------------------------------------
macd = fast_ma - slow_ma
p1=plot(macd,"macd signal",color=color.blue)
length = input(40, minval=1)
mult = input(2.0,"BB multiplier")

basis = sma(macd, length)
dev = mult * stdev(macd, length)
plot(basis,"BB basis",color=color.orange)
upper = basis + dev
lower = basis - dev
p2=plot(upper,"BB upper",color=color.red)
p3=plot(lower,"BB basis",color=color.green)

longCondition = crossover(macd, lower)
shortCondition = crossunder(macd, upper)

plotshape(longCondition?lower:na, title="Long", style=shape.xcross, location=location.absolute, text="Long", color=color.green, transp=0, size=size.tiny)
plotshape(shortCondition?upper:na, title="Short", style=shape.xcross, location=location.absolute, text="Short", color=color.red, transp=0, size=size.tiny)
fill(p1,p3,color=macd<lower?color.green:na,transp=90,title="support")
fill(p1,p2,color=macd>upper?color.red:na,transp=90,title="resistance")

if longCondition
    strategy.entry("Long",strategy.long)
if shortCondition
    strategy.entry("Short",strategy.short)
Published by ChaoZhang on the FMZ strategy square · last modified 2024-02-29. Collected in the Quant Trading Vault. Unvalidated research: re-test with your own data and costs before trusting it.
Build this with AgenKit
A spec is not a trading system. Paste this into your coding agent and AgenKit runs a specialist team — architecture, test-first build, risk gates, review — with paper trading on by default.
/agenkit build a production-grade trading bot with a backtest engine, risk controls and paper trading by default from strategies/Momentum-Trend-Strategy-Based-on-MACD-and-Bollinger-Bands.md- npx agenkit install engineering-kit in your project
- Paste the command into your agent and approve each phase
- Get tests, backtest, risk controls and a paper-trading switch
Understand it first
Before you run this, read the lesson behind the idea and how to backtest it honestly. Specs like this one are the survivors of an unknown number of trials; deflate their results accordingly.
Related specs
- Multi Timeframe Unified Strategy Based on Quantitative Momentum and Convergence DivergencePine Script · Momentum · 1d
- Momentum Indicator Aggregation Trading StrategyPine Script · Momentum · 1h
- Multi Indicator Trend Momentum Trading Strategy An Optimized Quantitative Trading System Based on Bollinger Bands Fibonacci and ATRPine Script · Momentum · 1h
- Multi Trend Momentum Crossover Strategy with Volatility Optimization SystemPine Script · Momentum · 1d
- Momentum Oscillation Crossing Bollinger Bands with Moving Average StrategyPine Script · Momentum · 1d
- Dynamic Momentum Weighted Moving Average Crossover StrategyPine Script · Momentum · 1h