Momentum Trend Synergy Strategy
The Momentum Trend Synergy Strategy combines the Relative Momentum Index (RMI) and a custom presentTrend indicator into one powerful trading approach. This multifaceted strategy integrates momentum analysis with…
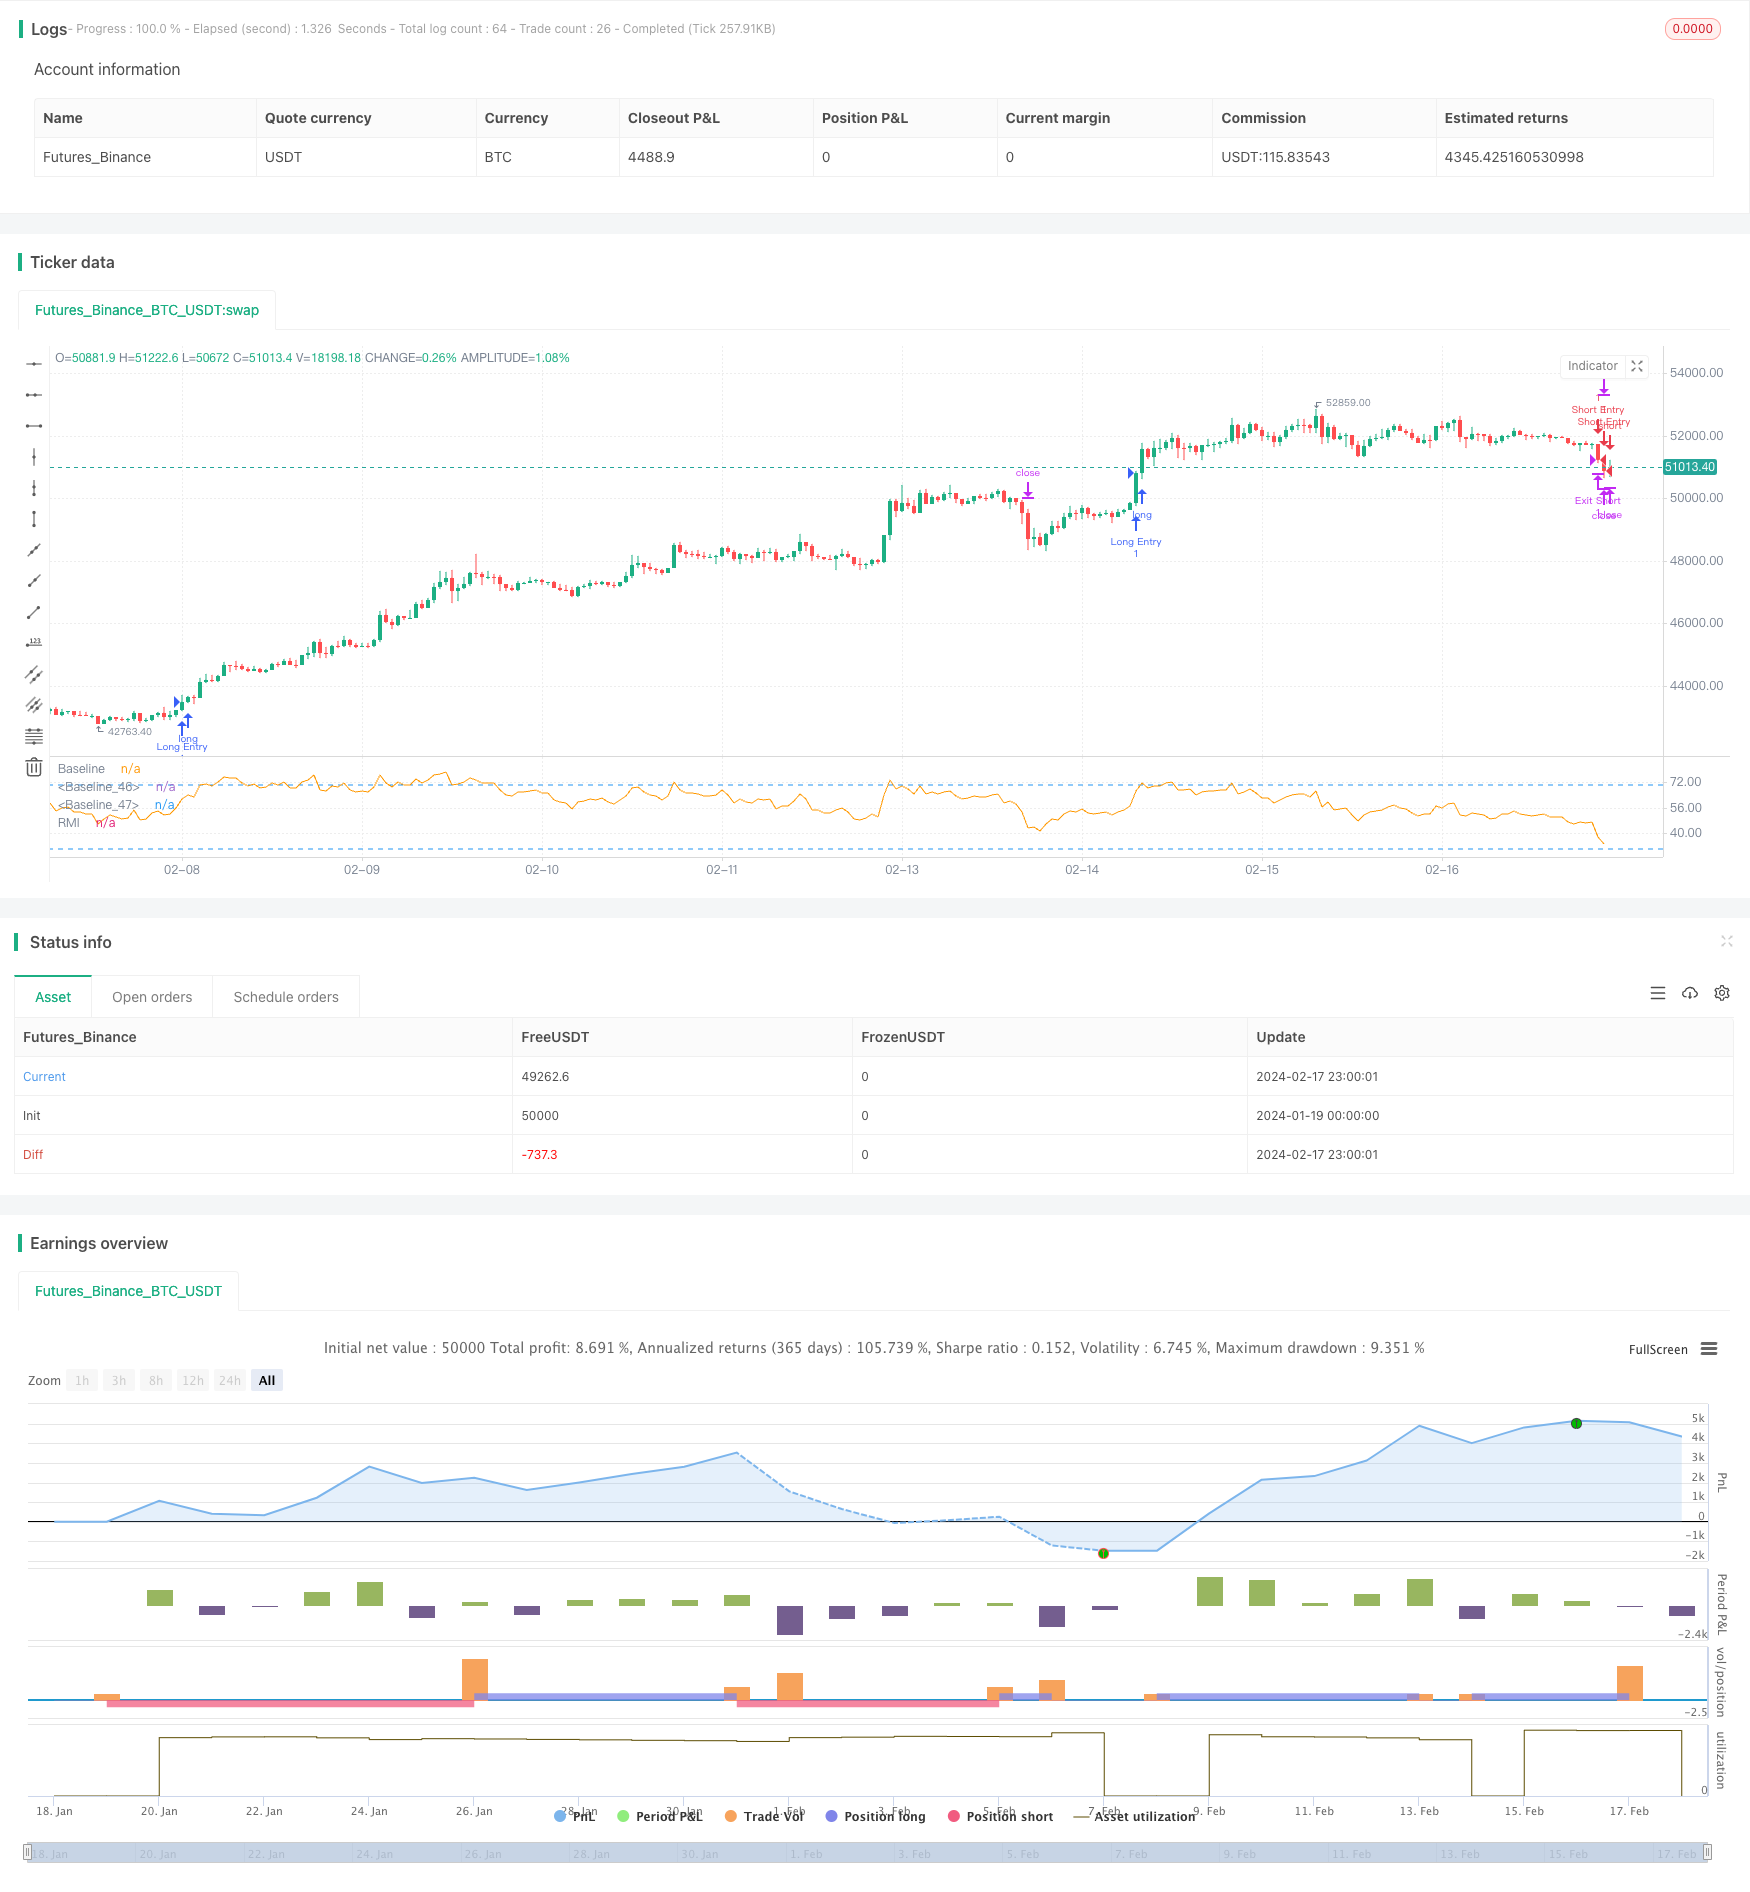
Overview
The Momentum Trend Synergy Strategy combines the Relative Momentum Index (RMI) and a custom presentTrend indicator into one powerful trading approach. This multifaceted strategy integrates momentum analysis with trend direction to provide traders with a more nuanced and responsive trading mechanism.
Strategy Logic
RMI Indicator
The RMI is a variation of the Relative Strength Index (RSI) that measures the momentum of up moves and down moves relative to previous price changes over a given period. The RMI over N periods is calculated as:
RMI = 100 - 100/(1 + Upward Avg/Downward Avg)
- Upward Avg is the average upward price change over N periods.
- Downward Avg is the average downward price change over N periods.
RMI values range from 0 to 100. Higher figures indicate stronger upward momentum while lower values suggest stronger downward momentum.
presentTrend Indicator
The presentTrend indicator combines Average True Range (ATR) with a moving average to determine trend direction and dynamic support/resistance levels. presentTrend over M periods and multiplier F is:
Upper Band: MA + (ATR x F)
Lower Band: MA - (ATR x F)
MA is the moving average close over M periods.
ATR is the Average True Range over M periods.
F is the multiplier to adjust sensitivity.
Trend direction switches when price crosses the presentTrend bands, signaling potential entry or exit points.
Strategy Logic
Entry Conditions:
- Long Entry: Triggered when RMI exceeds a threshold like 60, indicating strong bullish momentum, and price is above presentTrend upper band, confirming uptrend.
- Short Entry: Occurs when RMI drops below a threshold like 40, showing strong bearish momentum, and price is below presentTrend lower band, indicating a downtrend.
Exit Conditions with Dynamic Trailing Stop:
- Long Exit: Initiated when price crosses below presentTrend lower band or when RMI falls back towards neutral, suggesting weakening bullish momentum.
- Short Exit: Executed when price crosses above presentTrend upper band or when RMI rises towards neutral, indicating weakening bearish momentum.
Equations for Dynamic Trailing Stop:
- For Long Positions: Exit price is set at lower presentTrend band once entry condition is met.
- For Short Positions: Exit price is determined by upper presentTrend band post-entry.
The dual analysis of RMI momentum and presentTrend direction/trailing stop is the strength of this strategy. It aims to enter trending moves early and exit positions strategically to maximize gains and reduce losses across various market conditions.
Advantage Analysis
The advantages of this strategy include:
- Multilayered decision framework combining momentum and trend indicators improves efficiency.
- Dynamic trailing stops adjust to markets to effectively manage risk.
- Flexibility in trade direction caters to preferences and market conditions.
- Customizable RMI and presentTrend parameters suit different trading timeframes and sensibilities.
Risk Analysis
Potential risks to consider:
- More signals may increase overtrading, costs, slippage.
- Dual analysis judges may miss some trade opportunities.
- Parameters need alignment with personal trading style.
- Requires manual trend direction bias to avoid counter-trend trades.
Proper parameter optimization, trend alignment, and refinements to entry logic can reduce the above risks.
Enhancement Opportunities
Areas for strategy improvement include:
- Incorporate volatility indicator to avoid high volatility false signals.
- Add volume analysis to ensure sufficient momentum on entries.
- Optimize dynamic stop loss levels to balance protection and profitability.
- Introduce re-entry conditions to fully capitalize on trends.
- Parameter optimization and backtesting to maximize return metrics.
Conclusion
The Momentum Trend Synergy Strategy provides a multilayered approach, incorporating both momentum and trend indicators for accurate and risk-managed trading. The high customizability of this strategy allows traders to tailor it to their personal style and market environments. When optimized, it can fully leverage its trend-capturing capabilities for strong performance. Thus, it represents a recommended addition for most trading toolboxes.
Parameters
| Name | Default | What it controls |
|---|---|---|
| v_input_string_1 | 0 | Trade Direction: Both | Short | Long |
| v_input_int_1 | 21 | RMI Length |
| v_input_int_2 | 5 | presentTrend Length |
| v_input_float_1 | 4 | presentTrend Multiplier |
Source Pine Script
/*backtest
start: 2024-01-19 00:00:00
end: 2024-02-18 00:00:00
period: 1h
basePeriod: 15m
exchanges: [{"eid":"Futures_Binance","currency":"BTC_USDT"}]
*/

// This Pine Script™ code is subject to the terms of the Mozilla Public License 2.0 at https://mozilla.org/MPL/2.0/
// © PresentTrading

//@version=5
strategy("PresentTrend RMI Synergy - Strategy [presentTrading]", shorttitle="PresentTrend RMI Synergy - Strategy [presentTrading]", overlay=false)

// Inputs
tradeDirection = input.string("Both", title="Trade Direction", options=["Long", "Short", "Both"])
lengthRMI = input.int(21, title="RMI Length")
lengthSuperTrend = input.int(5, title="presentTrend Length")
multiplierSuperTrend = input.float(4.0, title="presentTrend Multiplier")

// RMI Calculation
up = ta.rma(math.max(ta.change(close), 0), lengthRMI)
down = ta.rma(-math.min(ta.change(close), 0), lengthRMI)
rmi = 100 - (100 / (1 + up / down))

// PresentTrend Dynamic Threshold Calculation (Simplified Example)
presentTrend = ta.sma(close, lengthRMI) * multiplierSuperTrend // Simplified for demonstration

// SuperTrend for Dynamic Trailing Stop
atr = ta.atr(lengthSuperTrend)
upperBand = ta.sma(close, lengthSuperTrend) + multiplierSuperTrend * atr
lowerBand = ta.sma(close, lengthSuperTrend) - multiplierSuperTrend * atr
trendDirection = close > ta.sma(close, lengthSuperTrend) ? 1 : -1
// Entry Logic
longEntry = rmi > 60 and trendDirection == 1
shortEntry = rmi < 40 and trendDirection == -1

// Exit Logic with Dynamic Trailing Stop
longExitPrice = trendDirection == 1 ? lowerBand : na
shortExitPrice = trendDirection == -1 ? upperBand : na

// Strategy Execution
if (tradeDirection == "Long" or tradeDirection == "Both") and longEntry
    strategy.entry("Long Entry", strategy.long)
    strategy.exit("Exit Long", stop=longExitPrice)

if (tradeDirection == "Short" or tradeDirection == "Both") and shortEntry
    strategy.entry("Short Entry", strategy.short)
    strategy.exit("Exit Short", stop=shortExitPrice)

// Visualization
plot(rmi, title="RMI", color=color.orange)
hline(50, "Baseline", color=color.white)
hline(30, "Baseline", color=color.blue)
hline(70, "Baseline", color=color.blue)
Published by ChaoZhang on the FMZ strategy square · last modified 2024-02-19. Collected in the Quant Trading Vault. Unvalidated research: re-test with your own data and costs before trusting it.
Build this with AgenKit
A spec is not a trading system. Paste this into your coding agent and AgenKit runs a specialist team — architecture, test-first build, risk gates, review — with paper trading on by default.
/agenkit build a production-grade trading bot with a backtest engine, risk controls and paper trading by default from strategies/Momentum-Trend-Synergy-Strategy.md- npx agenkit install engineering-kit in your project
- Paste the command into your agent and approve each phase
- Get tests, backtest, risk controls and a paper-trading switch
Understand it first
Before you run this, read the lesson behind the idea and how to backtest it honestly. Specs like this one are the survivors of an unknown number of trials; deflate their results accordingly.
Related specs
- Oscillator Candles Momentum Trading StrategyPine Script · Momentum · 1h
- Dynamic Trend RSI Crossover Momentum Enhancement StrategyPine Script · Momentum · 1h
- KST EMA Momentum Trend Following StrategyPine Script · Momentum · 1d
- Multi Indicator Trend Momentum Trading Strategy An Optimized Quantitative Trading System Based on Bollinger Bands Fibonacci and ATRPine Script · Momentum · 1h
- Multi Technical Indicator Trend Following Strategy with RSI Momentum FilterPine Script · Momentum · 1h
- Trend Following Strategy Based on Support Resistance and Momentum Indicators Across Multiple TimeframesPine Script · Momentum · 1d