Momentum Trend Tracking Strategy
The Momentum Trend Tracking Strategy is a strategy that uses Relative Strength Index (RSI), Stochastic and Momentum indicators to identify trends. It combines signals from multiple indicators with good backtesting…
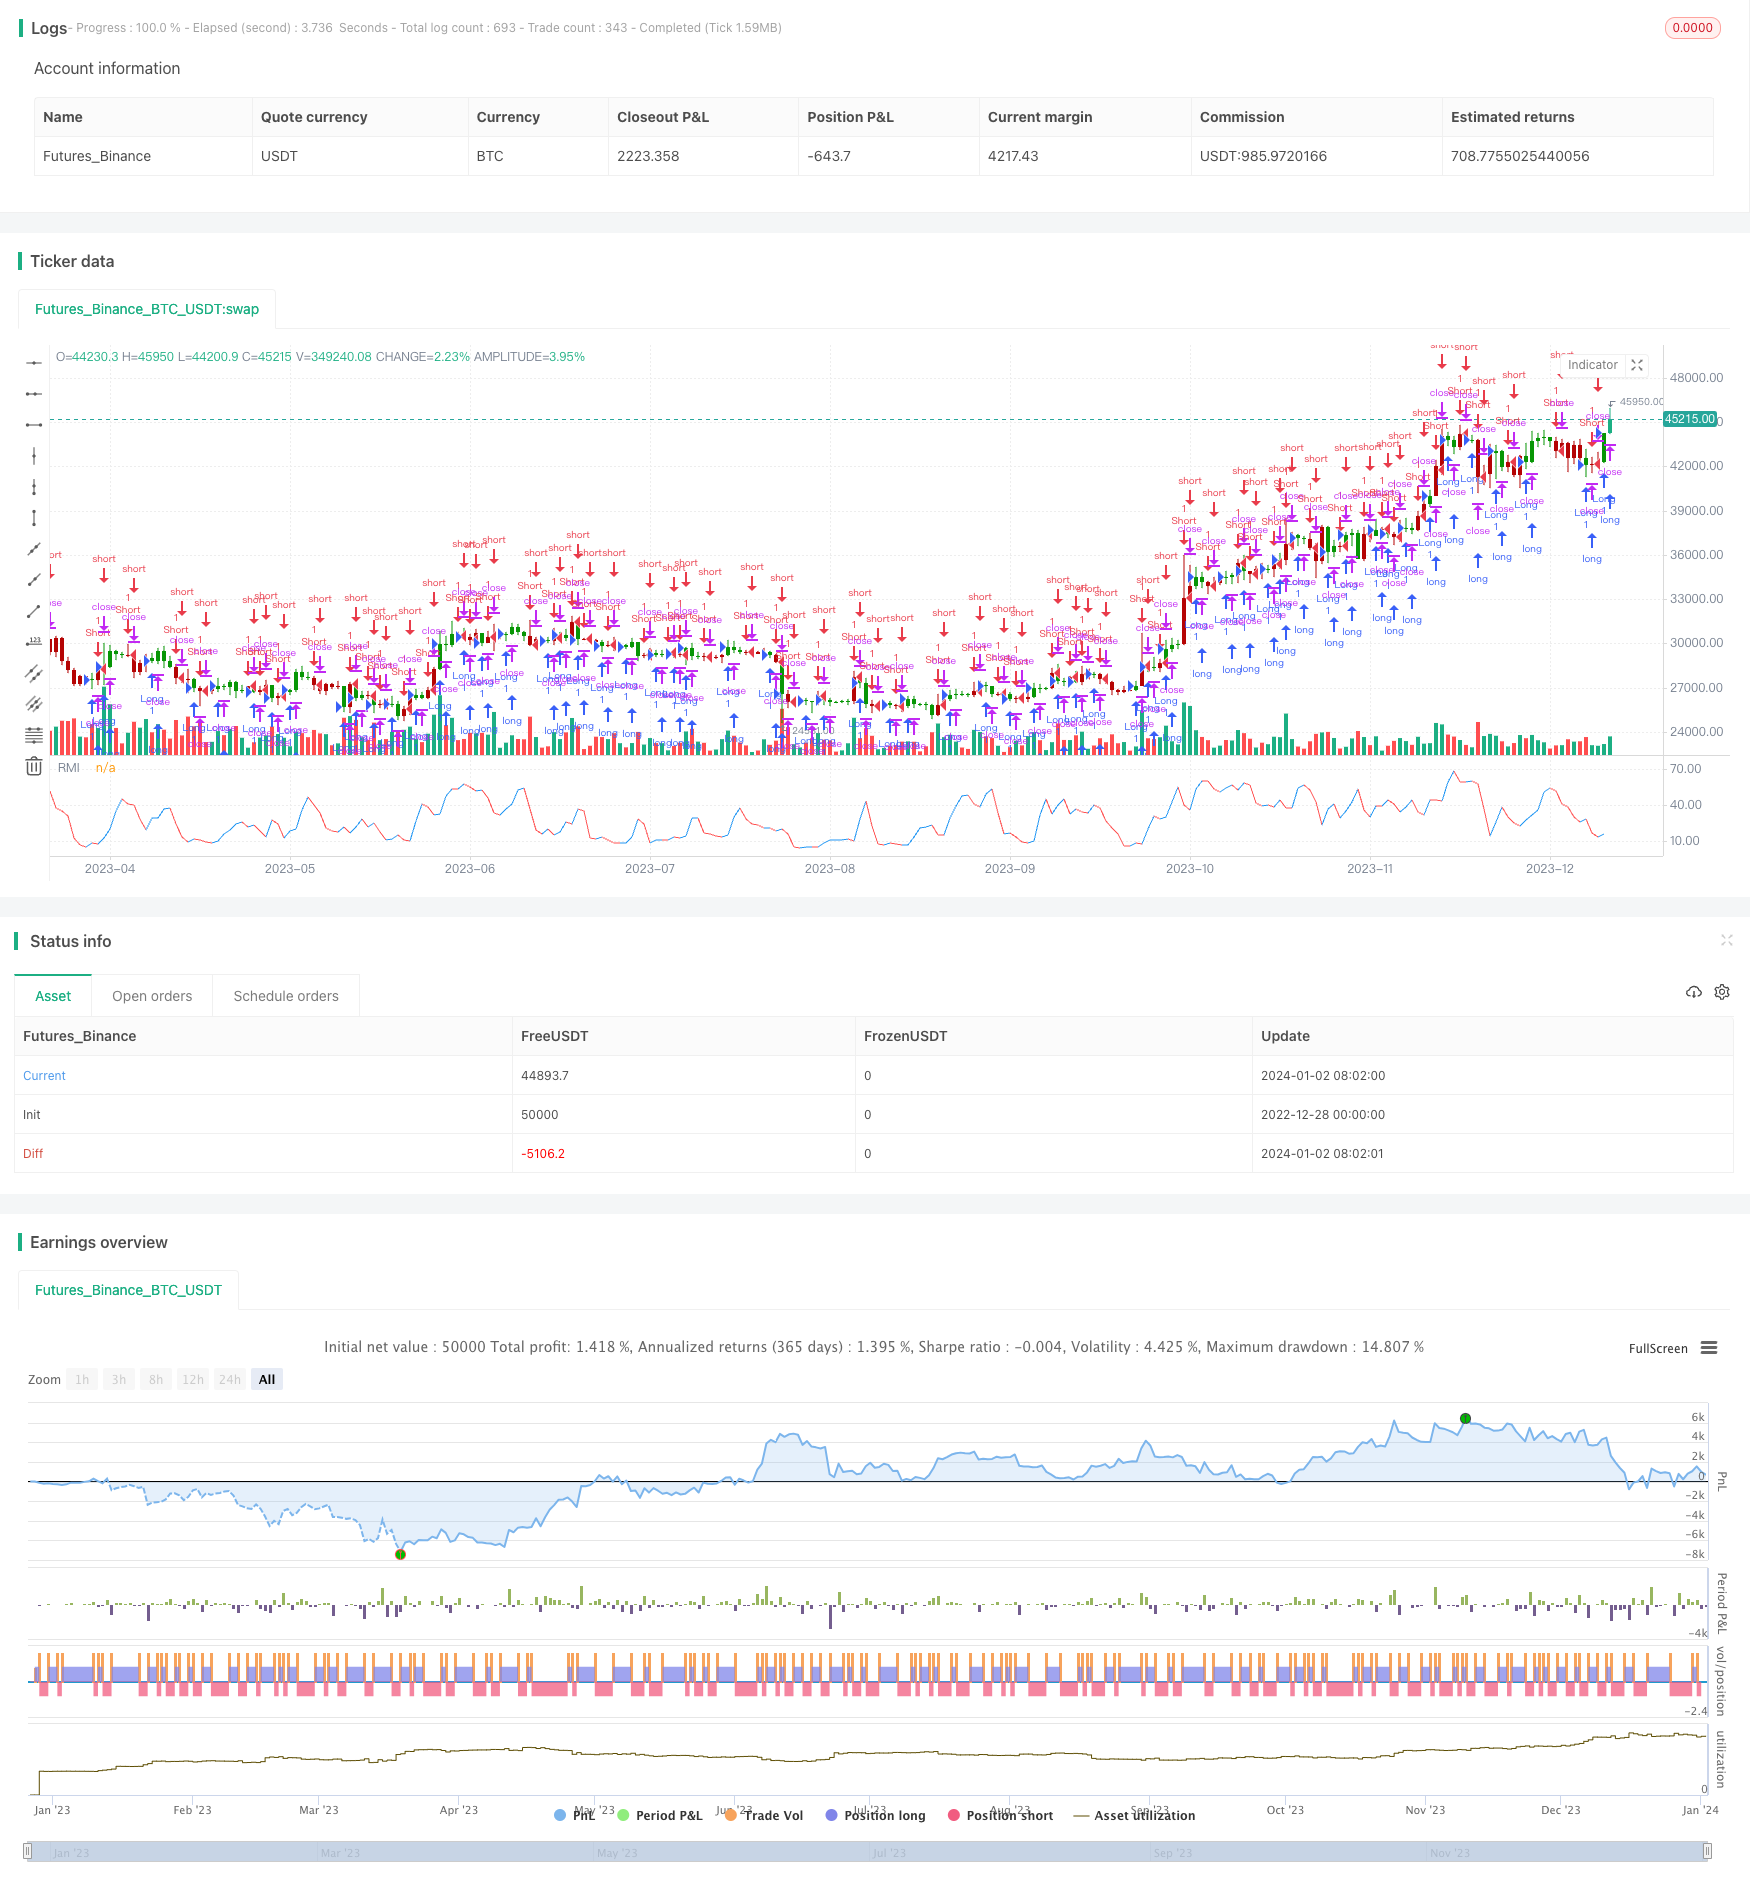
Overview
The Momentum Trend Tracking Strategy is a strategy that uses Relative Strength Index (RSI), Stochastic and Momentum indicators to identify trends. It combines signals from multiple indicators with good backtesting results and is suitable for medium-to-long-term holding.
Strategy Logic
The strategy first calculates the 9-period RSI, Stochastic and Momentum indicators respectively. Then multiply the Stochastic by the RSI and divide by the Momentum to get a combined indicator called KNRP. This indicator reflects information from multiple sub-indicators simultaneously.
After that, a 2-period moving average of KNRP is calculated. Trading signals are generated when this moving average crosses above or below its previous value. That is, go long when the average is greater than the previous period and go short when less than the previous period. This signal reflects the short-term trend of the KNRP indicator.
Advantage Analysis
The biggest advantage of this strategy is that the indicator design is reasonable and effectively combines information from multiple technical indicators to accurately determine the trend direction. Compared with a single indicator, it reduces the probability of erroneous signals and improves signal reliability.
In addition, the main basis for the strategy to determine the trend is the moving average of KNRP, which avoids the risk of chasing highs and selling lows and is in line with the concept of trend trading. Moreover, the parameters are flexible for users to adjust according to their own style.
Risk Analysis
The main risk of this strategy lies in the combined indicator itself. If the combination method is improper, there may be conflicts between different indicators. This will increase erroneous signals and affect strategy performance. In addition, improper parameter settings can also have a greater impact on the results.
To reduce risks, it is recommended to optimize parameters and test the impacts of different parameter lengths and combinations on the strategy indicator and overall backtest results. It is also necessary to pay attention to the impact of long-term market conditions on parameter stability.
Optimization Directions
The main aspects that this strategy can be optimized include:
Test more types of technical indicators combinations to find more effective ways to determine trends
Optimize indicator parameters to find values more suitable for current market conditions
Add stop loss/profit taking logic to lock in profits and reduce losses
Test on longer time frames such as daily or weekly to evaluate performance as a medium-long term strategy
Add position sizing module to adjust positions based on market conditions
Summary
The Momentum Trend Tracking Strategy is generally a relatively stable and reliable trend strategy. It solves the problem that a single indicator is prone to false signals and effectively determines the trend through weighted multiple indicators. The parameters are flexible with large optimization space, suitable for technical indicator traders. With further improvements, this strategy has the potential to become a long-term quantitative strategy worth holding.
Parameters
| Name | Default | What it controls |
|---|---|---|
| v_input_1 | 9 | Length_Momentum |
| v_input_2 | 9 | Length_RSI |
| v_input_3 | 9 | Length_Stoch |
| v_input_4 | 2 | Length_NRP |
| v_input_5 | false | Trade reverse |
Source Pine Script
/*backtest
start: 2022-12-28 00:00:00
end: 2024-01-03 00:00:00
period: 1d
basePeriod: 1h
exchanges: [{"eid":"Futures_Binance","currency":"BTC_USDT"}]
*/

//@version=4
////////////////////////////////////////////////////////////
//  Copyright by HPotter v1.0 27/07/2021
// To calculate the coordinates in which the kink of the line will cross,
//the standard Forex instruments are used - Relative Strenght Index, Stochastic and Momentum.
//It is very easy to optimize them for the existing trading strategy: they all have very
//flexible and easily customizable parameters. Signals to enter the market can be 2 situations:
//    Change of color of the indicator line from red to blue. At the same time, it is worth entering into the purchase;
//    Change of color of the indicator line from blue to red. In this case, it is worth entering for sale.
//The signals are extremely clear and can be used in practice even by beginners. The indicator
//itself shows when to make deals: the user only has to accompany them and set the values
//of Take Profit and Stop Loss. As a rule, the signal to complete trading is the approach of
//the indicator level to the levels of the maximum or minimum of the previous time period.
////////////////////////////////////////////////////////////
strategy(title="Kwan NRP Backtest", shorttitle="KNRP")
xPrice = open
Length_Momentum = input(9, minval=1)
Length_RSI = input(9, minval=1)
Length_Stoch = input(9, minval = 1)
Length_NRP = input(2, minval=1)
reverse = input(false, title="Trade reverse")
var xKNRP = array.new_float(1,na)
xMom = close / close[Length_Momentum] * 100
xRSI = rsi(xPrice, Length_RSI)
xStoch = stoch(xPrice, high, low, 9)
if xMom != 0
    val=xStoch*xRSI/xMom
    array.push(xKNRP,val)
    nz(na)
avr = 0.0
if array.size(xKNRP) > Length_NRP
    for i = array.size(xKNRP)-Length_NRP to array.size(xKNRP)-1
	    avr+= array.get(xKNRP, i)
    nz(na)
avr := avr / Length_NRP
clr = avr > avr[1] ? color.blue : color.red
pos = iff(avr > avr[1] , 1,
	   iff(avr < avr[1], -1, 0))
possig = iff(reverse and pos == 1, -1,
          iff(reverse and pos == -1 , 1, pos))
if (possig == 1 )
    strategy.entry("Long", strategy.long)
if (possig == -1 )
    strategy.entry("Short", strategy.short)
if (possig == 0)
    strategy.close_all()
barcolor(possig == -1 ? #b50404: possig == 1 ? #079605 : #0536b3 )
plot(avr, color=clr, title="RMI")
Published by ChaoZhang on the FMZ strategy square · last modified 2024-01-04. Collected in the Quant Trading Vault. Unvalidated research: re-test with your own data and costs before trusting it.
Build this with AgenKit
A spec is not a trading system. Paste this into your coding agent and AgenKit runs a specialist team — architecture, test-first build, risk gates, review — with paper trading on by default.
/agenkit build a production-grade trading bot with a backtest engine, risk controls and paper trading by default from strategies/Momentum-Trend-Tracking-Strategy.md- npx agenkit install engineering-kit in your project
- Paste the command into your agent and approve each phase
- Get tests, backtest, risk controls and a paper-trading switch
Understand it first
Before you run this, read the lesson behind the idea and how to backtest it honestly. Specs like this one are the survivors of an unknown number of trials; deflate their results accordingly.
Related specs
- Advanced Multi Indicator Trend Following and Momentum Quantitative Trading StrategyPine Script · Momentum · 1h
- MoonFlag MACD Momentum StochRSI Trading StrategyPine Script · Momentum · 1d
- Multi EMA Trend Momentum Trading Strategy with Risk Management SystemPine Script · Momentum · 1h
- Multi Indicator Probability Threshold Momentum Trend Trading StrategyPine Script · Momentum · 1d
- Multi factor Adaptive Momentum Tracking StrategyPine Script · Momentum · 3m
- Pivot and Momentum StrategyPine Script · Momentum · 1d