Strategy vault / Tools & templates
Monthly Returns Strategy with Benchmark
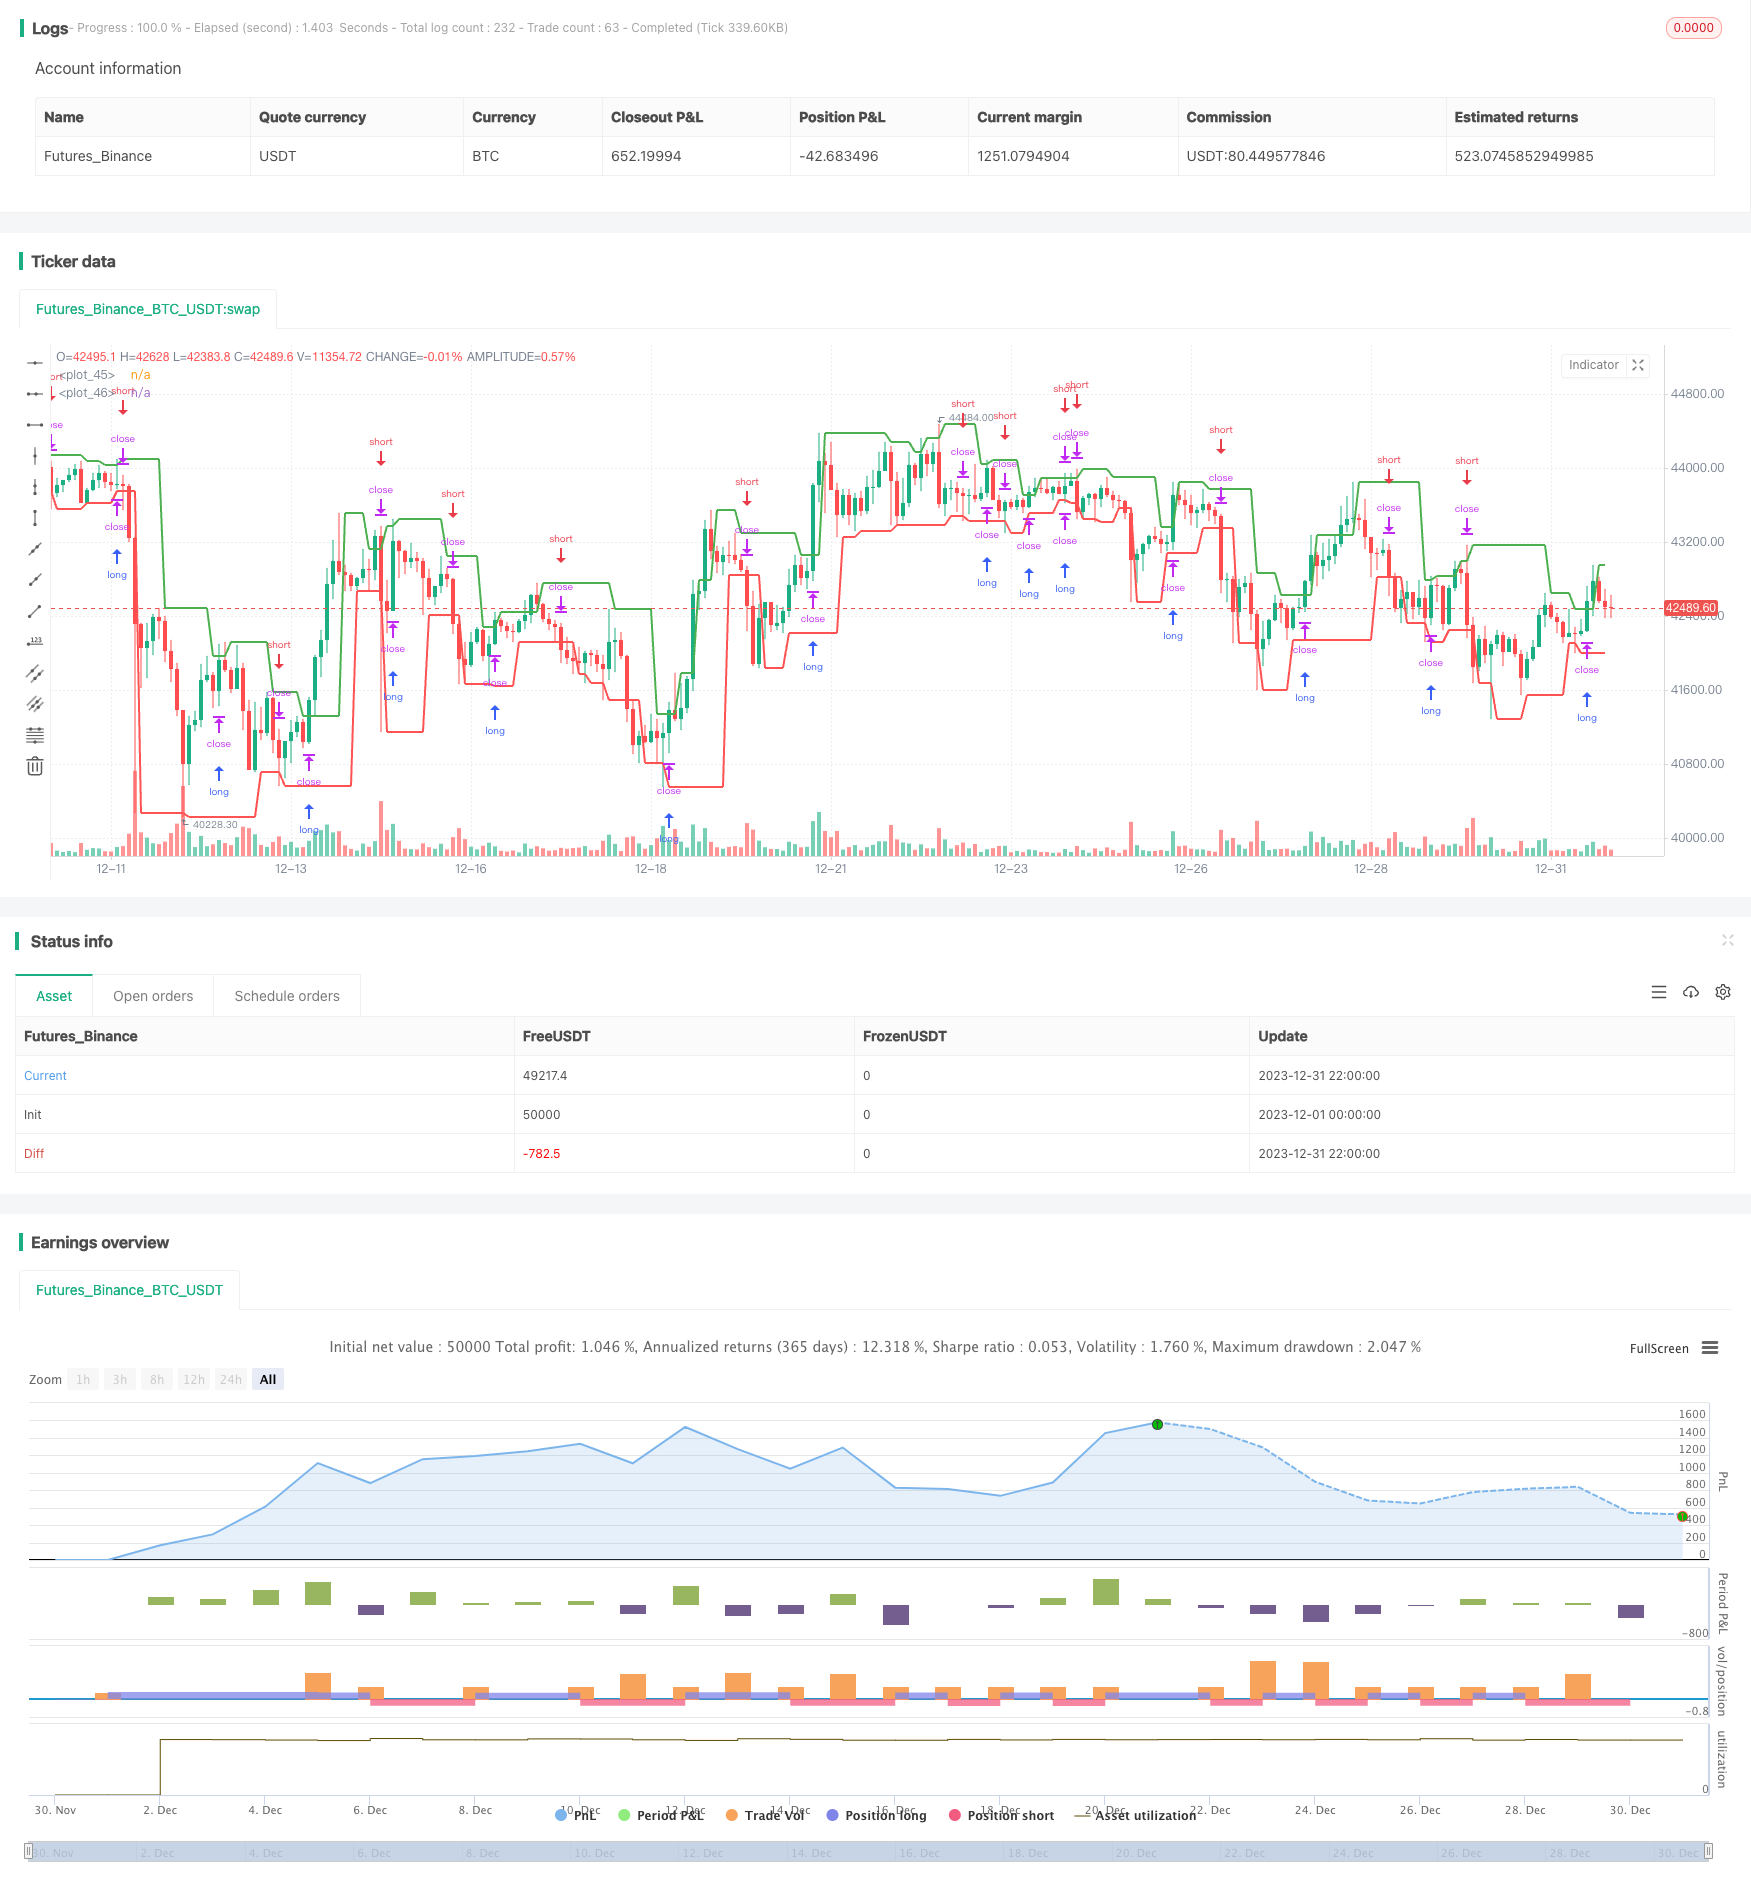
This is a quantitative trading strategy based on monthly returns display. It uses Pine Script to calculate and present monthly and yearly returns of the strategy, as well as benchmark returns, in a table on the chart…
Overview
This is a quantitative trading strategy based on monthly returns display. It uses Pine Script to calculate and present monthly and yearly returns of the strategy, as well as benchmark returns, in a table on the chart for analysis.
Strategy Logic
The core logic of this strategy is to track and calculate monthly and yearly performance, and display it in a table format. The key steps are:
Calculate monthly and yearly return based on change in equity.
Calculate benchmark monthly and yearly returns based on price change.
Store the monthly and yearly returns in arrays.
When bar is confirmed, populate a table using the stored return arrays to present monthly perf.
Display benchmark in second table row. Display alpha in third row.
By doing so, this script can clearly present the monthly returns in an organized table, along with benchmark comparison. This helps analyze performance.
Advantages
The main advantages of this monthly return strategy are:
Intuitive display of monthly returns. The table format makes performance easy to analyze.
Clear benchmark comparison. Displaying a separate benchmark row allows strategy vs market performance analysis.
Alpha calculation. The alpha row shows if strategy is outperforming/underperforming the benchmark.
Customizable parameters for flexibility. User can set colors, date range, benchmark symbol etc as needed.
Risks
Some risks to note with this strategy are:
No trading logic. This merely displays returns, does not include actual trades.
Historical performance may not continue. As with any backtest, past returns do not guarantee future performance.
Potential errors in return calculation. Bugs could lead to incorrect monthly return figures.
Overall this script mainly serves as a performance visualization tool. The risks can be mitigated by ensuring accuracy of return calculations and not relying solely on backtests.
Enhancement Opportunities
Some ways this monthly return strategy could be improved are:
Add actual trading strategy whose performance is displayed. Combine with a quant strategy.
Add further benchmark customization parameters like benchmark symbol, timeframe etc.
Enhance table formatting for better visuals - colors, cells, formatting etc.
Add other return metrics - CAGR, Sharpe ratio etc for more analysis.
Conclusion
This is a strategy focused specifically on displaying monthly returns of system and benchmark in table format for easier analysis. Its advantages are intuitive visualization and comparison of strategy vs benchmark. Risks are lack of trading logic and reliance on backtest. It can be enhanced by combining with quant strategy, adding further customization options and more metrics.
Parameters
| Name | Default | What it controls |
|---|---|---|
| v_input_1 | 2 | (?Pivot Points)leftBars |
| v_input_2 | true | rightBars |
| v_input_3 | 2 | (?Monthly Table)Return Precision |
| v_input_4 | timestamp(01 Jan 2000 00:00 +0000) | From Date |
| v_input_color_1 | green | Gradient Colors |
| v_input_color_2 | red | loss_color |
| v_input_bool_1 | true | (?Benchmark)Use current Symbol for Benchmark |
| v_input_5 | BTC_USDT:swap | Benchmark |
| v_input_bool_2 | true | Display Benchmark? |
| v_input_bool_3 | true | Display Alpha? |
Source Pine Script
/*backtest
start: 2023-12-01 00:00:00
end: 2023-12-31 23:59:59
period: 2h
basePeriod: 15m
exchanges: [{"eid":"Futures_Binance","currency":"BTC_USDT"}]
*/

//@version=5
strategy('Monthly Returns with Benchmark', overlay=true, default_qty_type=strategy.percent_of_equity, default_qty_value=25, commission_type=strategy.commission.percent, commission_value=0.1)

////////////
// Inputs //

// Pivot points inputs
leftBars   = input(2, group = "Pivot Points")
rightBars  = input(1, group = "Pivot Points")

// Styling inputs
prec       = input(2, title='Return Precision',                            group = "Monthly Table")
from_date  = input(timestamp("01 Jan 2000 00:00 +0000"), "From Date", group = "Monthly Table")
prof_color = input.color(color.green, title = "Gradient Colors", group = "Monthly Table", inline = "colors")
loss_color = input.color(color.red,   title = "",                group = "Monthly Table", inline = "colors")

// Benchmark inputs
use_cur    = input.bool(true,        title = "Use current Symbol for Benchmark", group = "Benchmark")
symb_bench = input('BTC_USDT:swap', title = "Benchmark",                        group = "Benchmark")
disp_bench = input.bool(true,        title = "Display Benchmark?",               group = "Benchmark")
disp_alpha = input.bool(true,        title = "Display Alpha?",                   group = "Benchmark")

// Pivot Points Strategy
swh = ta.pivothigh(leftBars, rightBars)
swl = ta.pivotlow(leftBars, rightBars)

hprice = 0.0
hprice := not na(swh) ? swh : hprice[1]

lprice = 0.0
lprice := not na(swl) ? swl : lprice[1]

le = false
le := not na(swh) ? true : le[1] and high > hprice ? false : le[1]

se = false
se := not na(swl) ? true : se[1] and low < lprice ? false : se[1]

if le
    strategy.entry('PivRevLE', strategy.long, comment='PivRevLE', stop=hprice + syminfo.mintick)

if se
    strategy.entry('PivRevSE', strategy.short, comment='PivRevSE', stop=lprice - syminfo.mintick)

plot(hprice, color=color.new(color.green, 0), linewidth=2)
plot(lprice, color=color.new(color.red, 0), linewidth=2)

///////////////////
// MONTHLY TABLE //

new_month = month(time) != month(time[1])
new_year  = year(time)  != year(time[1])

eq       = strategy.equity
bench_eq = close

// benchmark eq
bench_eq_htf = request.security(symb_bench, timeframe.period, close)

if (not use_cur)
    bench_eq := bench_eq_htf

bar_pnl   = eq / eq[1] - 1
bench_pnl = bench_eq / bench_eq[1] - 1

cur_month_pnl = 0.0
cur_year_pnl  = 0.0

// Current Monthly P&L
cur_month_pnl := bar_index == 0 ? 0 :
                 time >= from_date and (time[1] < from_date or new_month) ? bar_pnl :
                 (1 + cur_month_pnl[1]) * (1 + bar_pnl) - 1

// Current Yearly P&L
cur_year_pnl  := bar_index == 0 ? 0 :
                 time >= from_date and (time[1] < from_date or new_year) ? bar_pnl :
                 (1 + cur_year_pnl[1]) * (1 + bar_pnl) - 1

bench_cur_month_pnl = 0.0
bench_cur_year_pnl  = 0.0

// Current Monthly P&L - Bench
bench_cur_month_pnl := bar_index == 0 or (time[1] < from_date and time >= from_date) ? 0 :
                       time >= from_date and new_month ? bench_pnl :
                       (1 + bench_cur_month_pnl[1]) * (1 + bench_pnl) - 1

// Current Yearly P&L - Bench
bench_cur_year_pnl :=  bar_index == 0 ? 0 :
                       time >= from_date and (time[1] < from_date  or new_year) ? bench_pnl :
                       (1 + bench_cur_year_pnl[1]) * (1 + bench_pnl) - 1

var month_time = array.new_int(0)
var year_time  = array.new_int(0)

var month_pnl = array.new_float(0)
var year_pnl  = array.new_float(0)

var bench_month_pnl = array.new_float(0)
var bench_year_pnl  = array.new_float(0)

// Filling monthly / yearly pnl arrays
if array.size(month_time) > 0
    if month(time) == month(array.get(month_time, array.size(month_time) - 1))
        array.pop(month_pnl)
        array.pop(bench_month_pnl)
        array.pop(month_time)

if array.size(year_time) > 0
    if year(time) == year(array.get(year_time, array.size(year_time) - 1))
        array.pop(year_pnl)
        array.pop(bench_year_pnl)
        array.pop(year_time)

if (time >= from_date)
    array.push(month_time, time)
    array.push(year_time,  time)

    array.push(month_pnl, cur_month_pnl)
    array.push(year_pnl,  cur_year_pnl)

    array.push(bench_year_pnl,  bench_cur_year_pnl)
    array.push(bench_month_pnl, bench_cur_month_pnl)

// Monthly P&L Table
var monthly_table = table(na)

if array.size(year_pnl) > 0 and barstate.islastconfirmedhistory

    monthly_table := table.new(position.bottom_right, columns=15, rows=array.size(year_pnl) * 3 + 5, border_width=1)

    // Fill monthly performance

    table.cell(monthly_table, 0, 0,  'Perf', bgcolor = #999999)
    table.cell(monthly_table, 1, 0,  'Jan',  bgcolor = #999999)
    table.cell(monthly_table, 2, 0,  'Feb',  bgcolor = #999999)
    table.cell(monthly_table, 3, 0,  'Mar',  bgcolor = #999999)
    table.cell(monthly_table, 4, 0,  'Apr',  bgcolor = #999999)
    table.cell(monthly_table, 5, 0,  'May',  bgcolor = #999999)
    table.cell(monthly_table, 6, 0,  'Jun',  bgcolor = #999999)
    table.cell(monthly_table, 7, 0,  'Jul',  bgcolor = #999999)
    table.cell(monthly_table, 8, 0,  'Aug',  bgcolor = #999999)
    table.cell(monthly_table, 9, 0,  'Sep',  bgcolor = #999999)
    table.cell(monthly_table, 10, 0, 'Oct',  bgcolor = #999999)
    table.cell(monthly_table, 11, 0, 'Nov',  bgcolor = #999999)
    table.cell(monthly_table, 12, 0, 'Dec',  bgcolor = #999999)
    table.cell(monthly_table, 13, 0, ' ', bgcolor = #999999)
    table.cell(monthly_table, 14, 0, 'Year', bgcolor = #999999)

    max_abs_y = math.max(math.abs(array.max(year_pnl)),  math.abs(array.min(year_pnl)))
    max_abs_m = math.max(math.abs(array.max(month_pnl)), math.abs(array.min(month_pnl)))

    for yi = 0 to array.size(year_pnl) - 1 by 1
        table.cell(monthly_table, 0,  yi + 1, str.tostring(year(array.get(year_time, yi))), bgcolor=#cccccc)
        table.cell(monthly_table, 13, yi + 1, ' ',   bgcolor=#999999)
        y_color = color.from_gradient(array.get(year_pnl, yi), -max_abs_y, max_abs_y, loss_color, prof_color)
        table.cell(monthly_table, 14, yi + 1, str.tostring(math.round(array.get(year_pnl, yi) * 100, prec)), bgcolor=y_color)

    for mi = 0 to array.size(month_time) - 1 by 1
        m_row = year(array.get(month_time, mi)) - year(array.get(year_time, 0)) + 1
        m_col = month(array.get(month_time, mi))
        m_color = color.from_gradient(array.get(month_pnl, mi), -max_abs_m, max_abs_m, loss_color, prof_color)

        table.cell(monthly_table, m_col, m_row, str.tostring(math.round(array.get(month_pnl, mi) * 100, prec)), bgcolor=m_color)

    // Fill benchmark performance
    next_row =  array.size(year_pnl) + 1

    if (disp_bench)

        table.cell(monthly_table, 0,  next_row, 'Bench', bgcolor=#999999)
        table.cell(monthly_table, 1,  next_row, 'Jan',   bgcolor=#999999)
        table.cell(monthly_table, 2,  next_row, 'Feb',   bgcolor=#999999)
        table.cell(monthly_table, 3,  next_row, 'Mar',   bgcolor=#999999)
        table.cell(monthly_table, 4,  next_row, 'Apr',   bgcolor=#999999)
        table.cell(monthly_table, 5,  next_row, 'May',   bgcolor=#999999)
        table.cell(monthly_table, 6,  next_row, 'Jun',   bgcolor=#999999)
        table.cell(monthly_table, 7,  next_row, 'Jul',   bgcolor=#999999)
        table.cell(monthly_table, 8,  next_row, 'Aug',   bgcolor=#999999)
        table.cell(monthly_table, 9,  next_row, 'Sep',   bgcolor=#999999)
        table.cell(monthly_table, 10, next_row, 'Oct',   bgcolor=#999999)
        table.cell(monthly_table, 11, next_row, 'Nov',   bgcolor=#999999)
        table.cell(monthly_table, 12, next_row, 'Dec',   bgcolor=#999999)
        table.cell(monthly_table, 13, next_row, ' ',     bgcolor = #999999)
        table.cell(monthly_table, 14, next_row, 'Year',  bgcolor=#999999)

        max_bench_abs_y = math.max(math.abs(array.max(bench_year_pnl)),  math.abs(array.min(bench_year_pnl)))
        max_bench_abs_m = math.max(math.abs(array.max(bench_month_pnl)), math.abs(array.min(bench_month_pnl)))

        for yi = 0 to array.size(year_time) - 1 by 1
            table.cell(monthly_table, 0,  yi + 1 + next_row + 1, str.tostring(year(array.get(year_time, yi))), bgcolor=#cccccc)
            table.cell(monthly_table, 13, yi + 1 + next_row + 1, ' ',   bgcolor=#999999)
            y_color = color.from_gradient(array.get(bench_year_pnl, yi), -max_bench_abs_y, max_bench_abs_y, loss_color, prof_color)
            table.cell(monthly_table, 14, yi + 1 + next_row + 1, str.tostring(math.round(array.get(bench_year_pnl, yi) * 100, prec)), bgcolor=y_color)

        for mi = 0 to array.size(month_time) - 1 by 1
            m_row = year(array.get(month_time, mi)) - year(array.get(year_time, 0)) + 1
            m_col = month(array.get(month_time, mi))
            m_color = color.from_gradient(array.get(bench_month_pnl, mi), -max_bench_abs_m, max_bench_abs_m, loss_color, prof_color)

            table.cell(monthly_table, m_col, m_row  + next_row + 1, str.tostring(math.round(array.get(bench_month_pnl, mi) * 100, prec)), bgcolor=m_color)

    // Fill Alpha
    if (disp_alpha)

        next_row :=  array.size(year_pnl) * 2 + 3
        table.cell(monthly_table, 0,  next_row, 'Alpha', bgcolor=#999999)
        table.cell(monthly_table, 1,  next_row, 'Jan',   bgcolor=#999999)
        table.cell(monthly_table, 2,  next_row, 'Feb',   bgcolor=#999999)
        table.cell(monthly_table, 3,  next_row, 'Mar',   bgcolor=#999999)
        table.cell(monthly_table, 4,  next_row, 'Apr',   bgcolor=#999999)
        table.cell(monthly_table, 5,  next_row, 'May',   bgcolor=#999999)
        table.cell(monthly_table, 6,  next_row, 'Jun',   bgcolor=#999999)
        table.cell(monthly_table, 7,  next_row, 'Jul',   bgcolor=#999999)
        table.cell(monthly_table, 8,  next_row, 'Aug',   bgcolor=#999999)
        table.cell(monthly_table, 9,  next_row, 'Sep',   bgcolor=#999999)
        table.cell(monthly_table, 10, next_row, 'Oct',   bgcolor=#999999)
        table.cell(monthly_table, 11, next_row, 'Nov',   bgcolor=#999999)
        table.cell(monthly_table, 12, next_row, 'Dec',   bgcolor=#999999)
        table.cell(monthly_table, 13, next_row, '',      bgcolor=#999999)
        table.cell(monthly_table, 14, next_row, 'Year',  bgcolor=#999999)

        max_alpha_abs_y = 0.0
        for yi = 0 to array.size(year_time) - 1 by 1
            if (math.abs(array.get(year_pnl, yi)  - array.get(bench_year_pnl, yi)) > max_alpha_abs_y)
                max_alpha_abs_y := math.abs(array.get(year_pnl, yi)  - array.get(bench_year_pnl, yi))

        max_alpha_abs_m = 0.0
        for mi = 0 to array.size(month_pnl) - 1 by 1
            if (math.abs(array.get(month_pnl, mi) - array.get(bench_month_pnl, mi)) > max_alpha_abs_m)
                max_alpha_abs_m := math.abs(array.get(month_pnl, mi) - array.get(bench_month_pnl, mi))

        for yi = 0 to array.size(year_time) - 1 by 1
            table.cell(monthly_table, 0,  yi + 1 + next_row + 1, str.tostring(year(array.get(year_time, yi))), bgcolor=#cccccc)
            table.cell(monthly_table, 13, yi + 1 + next_row + 1, ' ',   bgcolor=#999999)
            y_color = color.from_gradient(array.get(year_pnl, yi)  - array.get(bench_year_pnl, yi), -max_alpha_abs_y, max_alpha_abs_y, loss_color, prof_color)
            table.cell(monthly_table, 14, yi + 1 + next_row + 1, str.tostring(math.round((array.get(year_pnl, yi)  - array.get(bench_year_pnl, yi)) * 100, prec)), bgcolor=y_color)

        for mi = 0 to array.size(month_time) - 1 by 1
            m_row = year(array.get(month_time, mi)) - year(array.get(year_time, 0)) + 1
            m_col = month(array.get(month_time, mi))
            m_color = color.from_gradient(array.get(month_pnl, mi) - array.get(bench_month_pnl, mi), -max_alpha_abs_m, max_alpha_abs_m, loss_color, prof_color)

            table.cell(monthly_table, m_col, m_row  + next_row + 1, str.tostring(math.round((array.get(month_pnl, mi) - array.get(bench_month_pnl, mi)) * 100, prec)), bgcolor=m_color)
Published by ChaoZhang on the FMZ strategy square · last modified 2024-01-30. Collected in the Quant Trading Vault. Unvalidated research: re-test with your own data and costs before trusting it.
Build this with AgenKit
A spec is not a trading system. Paste this into your coding agent and AgenKit runs a specialist team — architecture, test-first build, risk gates, review — with paper trading on by default.
/agenkit build a tested, production-ready module from strategies/Monthly-Returns-Strategy-with-Benchmark.md- npx agenkit install engineering-kit in your project
- Paste the command into your agent and approve each phase
- Get tests, backtest, risk controls and a paper-trading switch
Understand it first
Before you run this, read the lesson behind the idea and how to backtest it honestly. Specs like this one are the survivors of an unknown number of trials; deflate their results accordingly.
Related specs
- Trade05 K Line Support and Resistance ATR Take ProfitMyLanguage · Tools & templates
- CSO Custom Signal Oscillator Strategy CSOPine Script · Tools & templates · 2h
- Mechanical Trading StrategyPine Script · Tools & templates · 4h
- Multi Indicator Configurable Strategy GeneratorPine Script · Tools & templates · 5m
- MA MACD BB Multi Indicator Trading Strategy Backtesting ToolPine Script · Tools & templates · 1d
- ML Alerts TemplatePine Script · Tools & templates · 2h