Strategy vault / Mean reversion
Moving Average and RSI Comprehensive Trading Strategy
This strategy combines multiple moving averages and the Relative Strength Index (RSI) to generate trading signals. It uses four moving averages with different periods: 9-day, 21-day, 25-day, and 99-day, and…
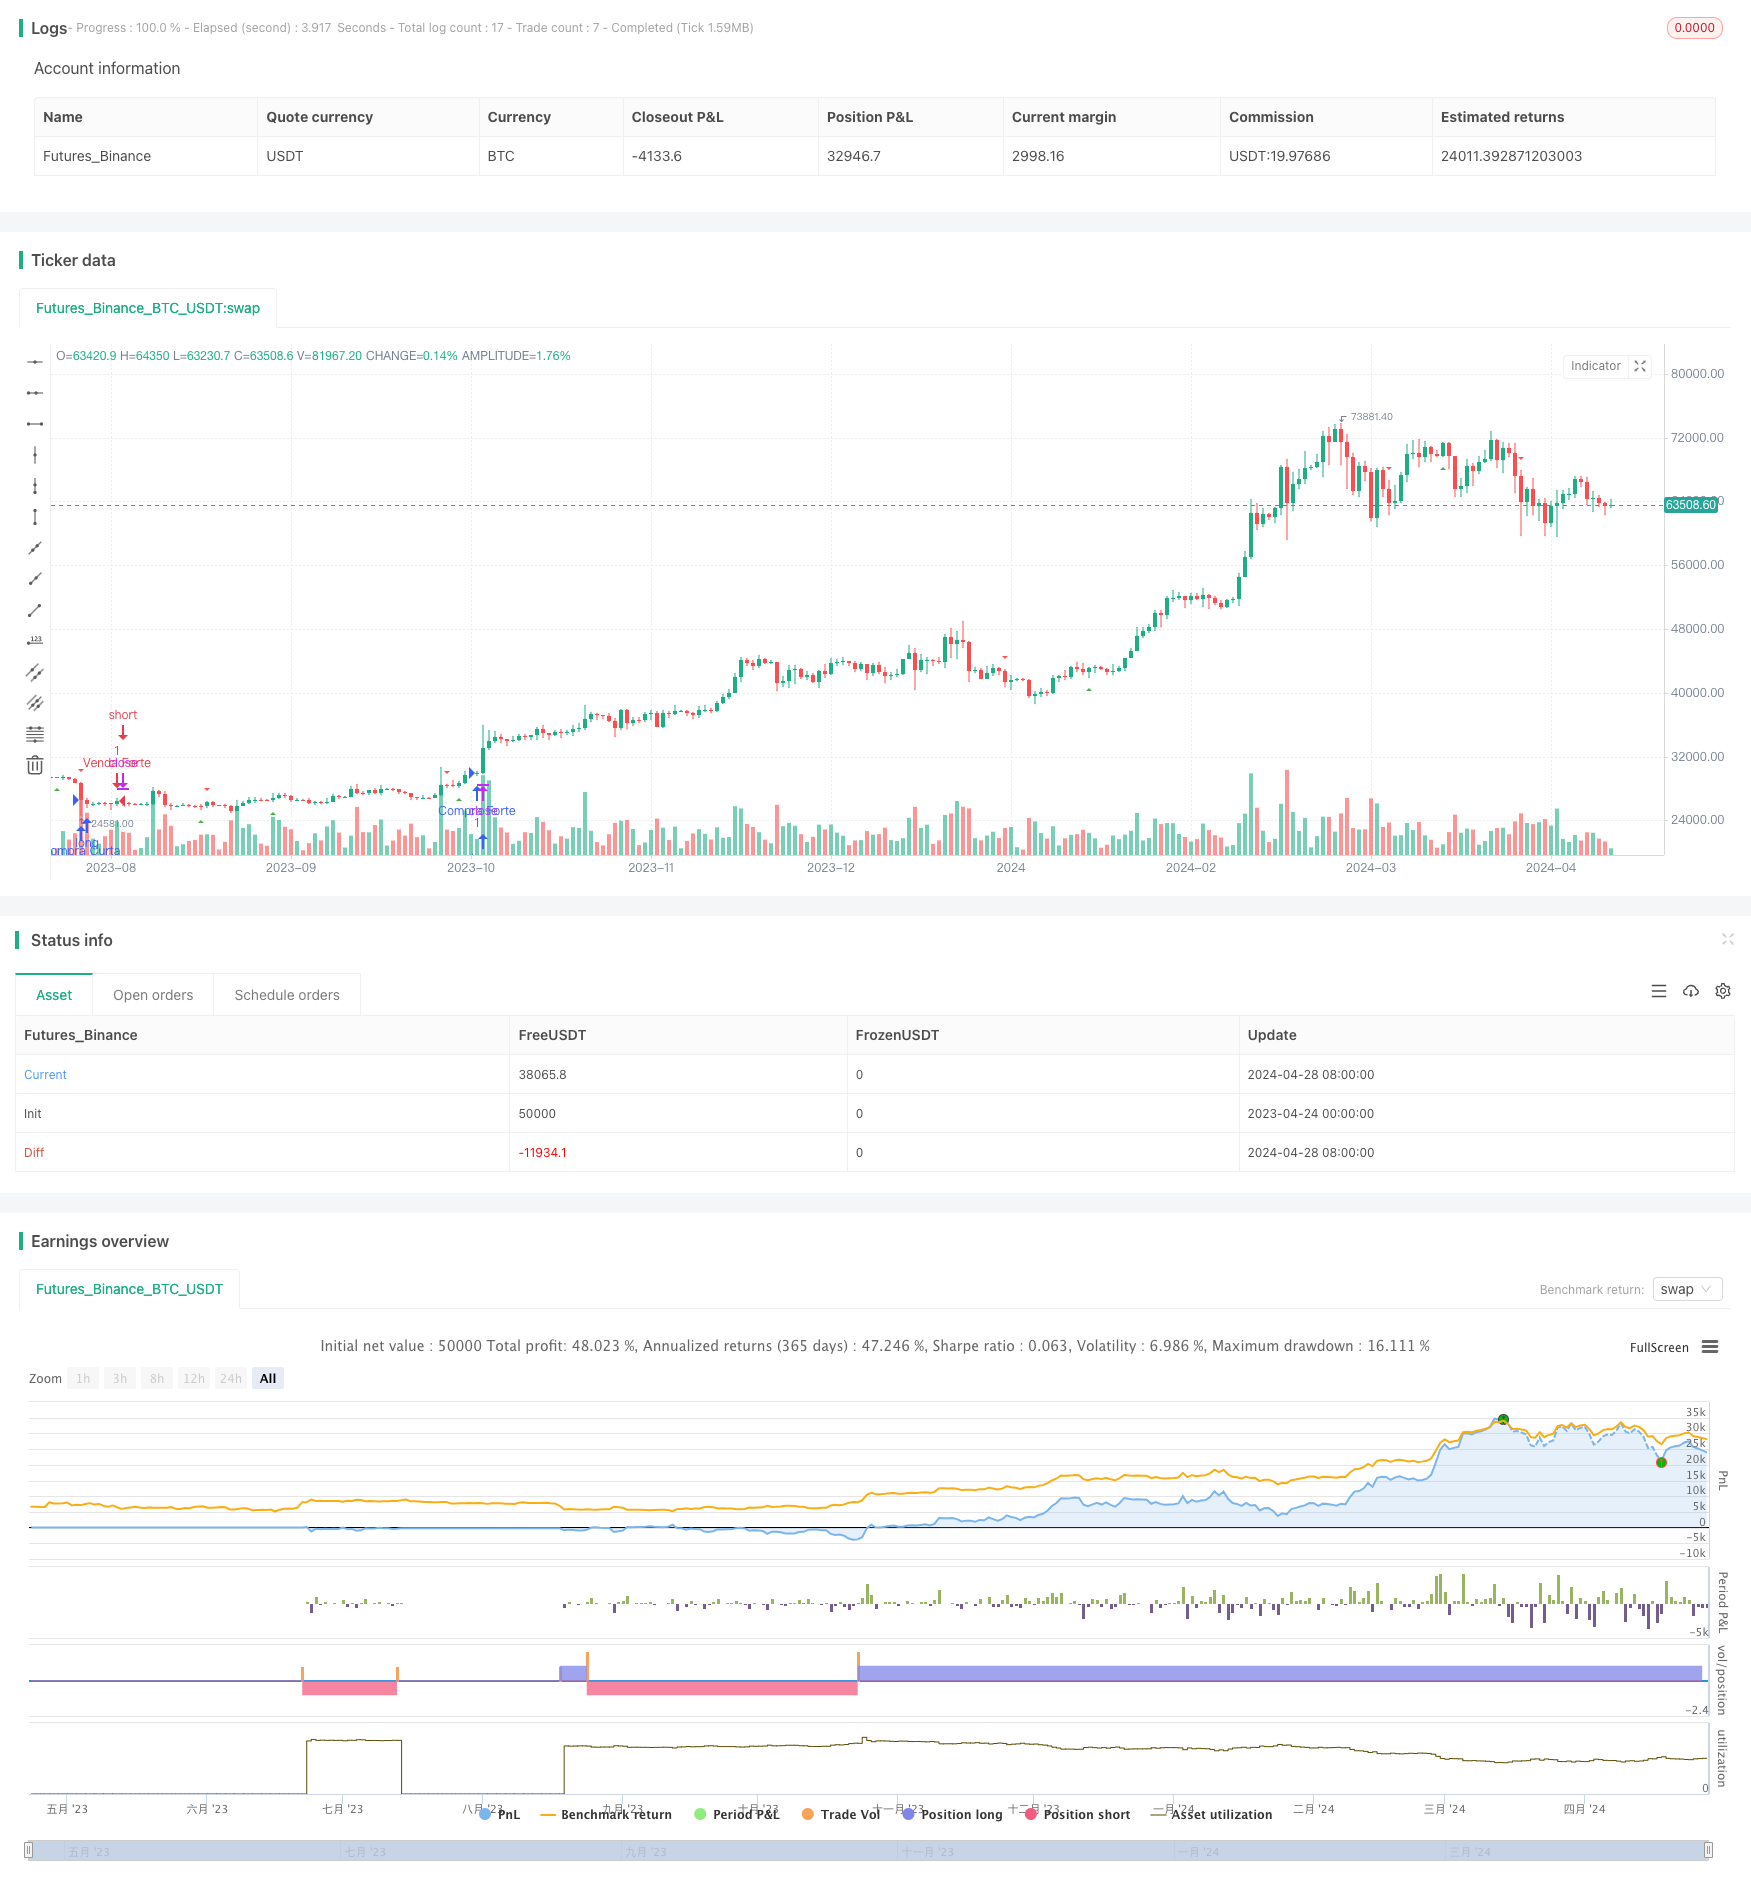
Overview
This strategy combines multiple moving averages and the Relative Strength Index (RSI) to generate trading signals. It uses four moving averages with different periods: 9-day, 21-day, 25-day, and 99-day, and determines the trend direction based on the crossovers between them. Additionally, the strategy incorporates the RSI indicator as a supplementary judgment, providing extra trading signals when the market is overbought or oversold.
The main idea of this strategy is to utilize the trend characteristics of moving averages with different periods and determine the main market trend based on their bullish or bearish alignments. A short-term moving average crossing above a long-term moving average is considered a bullish signal, while the opposite is considered a bearish signal. The RSI indicator is used to gauge market sentiment, providing reversal signals when the market is overbought or oversold.
Strategy Principles
- Calculate simple moving averages for four different periods: 9-day, 21-day, 25-day, and 99-day.
- Determine the crossover situations between the 9-day and 21-day moving averages. When the 9-day moving average crosses above the 21-day moving average, it generates a long signal; when the 9-day moving average crosses below the 21-day moving average, it generates a short signal.
- Determine the crossover situations between the 25-day and 99-day moving averages. When the 25-day moving average crosses above the 99-day moving average, it generates a long signal; when the 25-day moving average crosses below the 99-day moving average, it generates a short signal.
- Calculate the 14-day RSI indicator. When RSI is above 70, the market is considered overbought; when RSI is below 30, the market is considered oversold.
- Combine the moving average crossover signals and RSI signals to generate final trading signals:
- When the 9-day moving average crosses above the 21-day moving average and RSI is above 70, open a short position;
- When the 9-day moving average crosses below the 21-day moving average and RSI is below 30, open a long position;
- When the 25-day moving average crosses above the 99-day moving average and RSI is above 70, open a long position;
- When the 25-day moving average crosses below the 99-day moving average and RSI is below 30, open a short position.
- Moving average crossover signals are also used for closing positions. When the corresponding moving average crossover occurs, close the previous position.
Advantage Analysis
- Trend following: The strategy leverages the trend characteristics of moving averages with different periods and determines the main market trend based on their bullish or bearish alignments, helping to capture the overall market direction.
- Noise filtering: Compared to using a single moving average, this strategy employs multiple moving averages with different periods, which helps filter out short-term noise and improves signal reliability.
- Sentiment judgment: The inclusion of the RSI indicator as a supplementary judgment provides reversal signals when market sentiment is overly optimistic or pessimistic, potentially preventing the strategy from experiencing large drawdowns during extreme market conditions.
- Clear logic: The trading logic of the strategy is simple and straightforward, making it easy to understand and implement.
- Adaptability: The strategy can be adapted to different market environments and trading instruments by adjusting the periods of the moving averages and the parameters of the RSI.
Risk Analysis
- Parameter sensitivity: The performance of the strategy may be sensitive to the choice of moving average periods and RSI parameter settings. Different parameters may lead to significant variations in strategy performance.
- Trend recognition lag: Moving averages are inherently lagging indicators and may experience a certain degree of lag at market turning points, leading to missed trading opportunities or false signals.
- Underperformance in range-bound markets: In range-bound markets, frequent moving average crossovers may cause the strategy to generate numerous trading signals, potentially resulting in suboptimal performance.
- Black swan events: The strategy primarily relies on historical data for judgment and may not respond adequately to sudden black swan events.
Optimization Directions
- Parameter optimization: Optimize the periods of the moving averages and the parameters of the RSI to find the best-performing parameter combination for a specific market. Optimization methods such as genetic algorithms can be used to automatically search for optimal parameters.
- Signal filtering: In addition to moving average crossovers and RSI signals, introduce other technical indicators or price behavior patterns for secondary filtering to enhance signal accuracy. For example, consider incorporating Bollinger Bands or MACD indicators.
- Position sizing: Introduce the concept of position sizing into the current strategy. Dynamically adjust position sizes based on the strength and certainty of market trends to better control risk and improve returns.
- Stop-loss and take-profit: Implement stop-loss and take-profit mechanisms, particularly volatility-based or trailing stop-losses, to control the maximum risk exposure per trade.
- Multi-market adaptation: Expand the strategy to multiple markets and instruments. Through appropriate parameter adjustments and risk control, capture trading opportunities across different markets.
Summary
This strategy combines moving averages with different periods and the RSI indicator to form a trend-following and sentiment-judging trading strategy. Its advantages lie in its clear logic and adaptability. By integrating multiple moving averages, it can effectively capture market trends. However, it also faces risks such as parameter sensitivity, trend recognition lag, and underperformance in range-bound markets. Future improvements can be made through parameter optimization, signal filtering, position sizing, stop-loss and take-profit mechanisms, and multi-market adaptation to further enhance the performance and robustness of the strategy.
Parameters
| Name | Default | What it controls |
|---|---|---|
| v_input_int_1 | 9 | Length 1 |
| v_input_int_2 | 21 | Length 2 |
| v_input_int_3 | 25 | Length 3 |
| v_input_int_4 | 99 | Length 4 |
| v_input_int_5 | 14 | RSI Length |
| v_input_float_1 | 30 | RSI Oversold Level |
| v_input_float_2 | 70 | RSI Overbought Level |
| v_input_1_close | 0 | Source: close | high | low | open | hl2 | hlc3 | hlcc4 | ohlc4 |
Source Pine Script
/*backtest
start: 2023-04-24 00:00:00
end: 2024-04-29 00:00:00
period: 1d
basePeriod: 1h
exchanges: [{"eid":"Futures_Binance","currency":"BTC_USDT"}]
*/

//@version=5
strategy("Estratégia de Médias Móveis e RSI (por Svitorino_trade)", shorttitle="Estratégia-Médias Móveis", overlay=true)

len1 = input.int(9, minval=1, title="Length 1")
len2 = input.int(21, minval=1, title="Length 2")
len3 = input.int(25, minval=1, title="Length 3")
len4 = input.int(99, minval=1, title="Length 4")
rsi_length = input.int(14, minval=1, title="RSI Length")
rsi_oversold = input.float(30, minval=0, maxval=100, title="RSI Oversold Level")
rsi_overbought = input.float(70, minval=0, maxval=100, title="RSI Overbought Level")

src = input(close, title="Source")

ama(src, length) =>
    sum = 0.0
    for i = 0 to length - 1
        sum := sum + src[i]
    sum / length

avg1 = ama(src, len1)
avg2 = ama(src, len2)
avg3 = ama(src, len3)
avg4 = ama(src, len4)

rsi_value = ta.rsi(src, rsi_length)

// Condições de entrada e saída para períodos de 9 e 21
cruzamento_9_21_acima = avg1 > avg2 and avg1[1] <= avg2[1]
cruzamento_9_21_abaixo = avg1 < avg2 and avg1[1] >= avg2[1]

// Condições de entrada e saída para períodos de 25 e 99
cruzamento_25_99_acima = avg3 > avg4 and avg3[1] <= avg4[1]
cruzamento_25_99_abaixo = avg3 < avg4 and avg3[1] >= avg4[1]

// Plotando os sinais de entrada e saída
plotshape(series=cruzamento_9_21_acima, style=shape.triangleup, color=color.green, size=size.small, location=location.belowbar)
plotshape(series=cruzamento_9_21_abaixo, style=shape.triangledown, color=color.red, size=size.small, location=location.abovebar)
plotshape(series=cruzamento_25_99_acima, style=shape.triangleup, color=color.green, size=size.small, location=location.belowbar)
plotshape(series=cruzamento_25_99_abaixo, style=shape.triangledown, color=color.red, size=size.small, location=location.abovebar)

// Entradas e saídas para períodos de 9 e 21
if cruzamento_9_21_acima and rsi_value > rsi_overbought
    strategy.entry("Venda Curta", strategy.short)
if cruzamento_9_21_abaixo and rsi_value < rsi_oversold
    strategy.entry("Compra Curta", strategy.long)
if cruzamento_9_21_acima
    strategy.close("Compra Curta")
if cruzamento_9_21_abaixo
    strategy.close("Venda Curta")

// Entradas e saídas para períodos de 25 e 99
if cruzamento_25_99_acima and rsi_value > rsi_overbought
    strategy.entry("Compra Forte", strategy.long)
if cruzamento_25_99_abaixo and rsi_value < rsi_oversold
    strategy.entry("Venda Forte", strategy.short)
if cruzamento_25_99_acima
    strategy.close("Venda Forte")
if cruzamento_25_99_abaixo
    strategy.close("Compra Forte")
Published by ChaoZhang on the FMZ strategy square · last modified 2024-04-30. Collected in the Quant Trading Vault. Unvalidated research: re-test with your own data and costs before trusting it.
Build this with AgenKit
A spec is not a trading system. Paste this into your coding agent and AgenKit runs a specialist team — architecture, test-first build, risk gates, review — with paper trading on by default.
/agenkit build a production-grade trading bot with a backtest engine, risk controls and paper trading by default from strategies/Moving-Average-and-RSI-Comprehensive-Trading-Strategy.md- npx agenkit install engineering-kit in your project
- Paste the command into your agent and approve each phase
- Get tests, backtest, risk controls and a paper-trading switch
Understand it first
Before you run this, read the lesson behind the idea and how to backtest it honestly. Specs like this one are the survivors of an unknown number of trials; deflate their results accordingly.
Related specs
- Adaptive Mean Reversion Trading Strategy Based on Chande Momentum OscillatorPine Script · Mean reversion · 1d
- Advanced 15 Minute Chart Trading Signal StrategyPine Script · Mean reversion · 3h
- Advanced Momentum EMA Trend Following with RSI Overbought Oversold Trading StrategyPine Script · Mean reversion · 1d
- Advanced Quantitative Trading Strategy Combining RSI Divergence and Moving AveragesPine Script · Mean reversion · 1h
- Advanced Strategy with Volume and Price Pullback Multiple Take ProfitPine Script · Mean reversion · 1h
- BONK Multi Factor Trading StrategyPine Script · Mean reversion · 1d