Moving Average Based Supply Demand Zone Trading System with Dynamic Risk Management
This is a comprehensive trading strategy that combines moving average crossovers, supply/demand zone identification, and dynamic risk management. The strategy determines trade direction through short-term and…
Overview
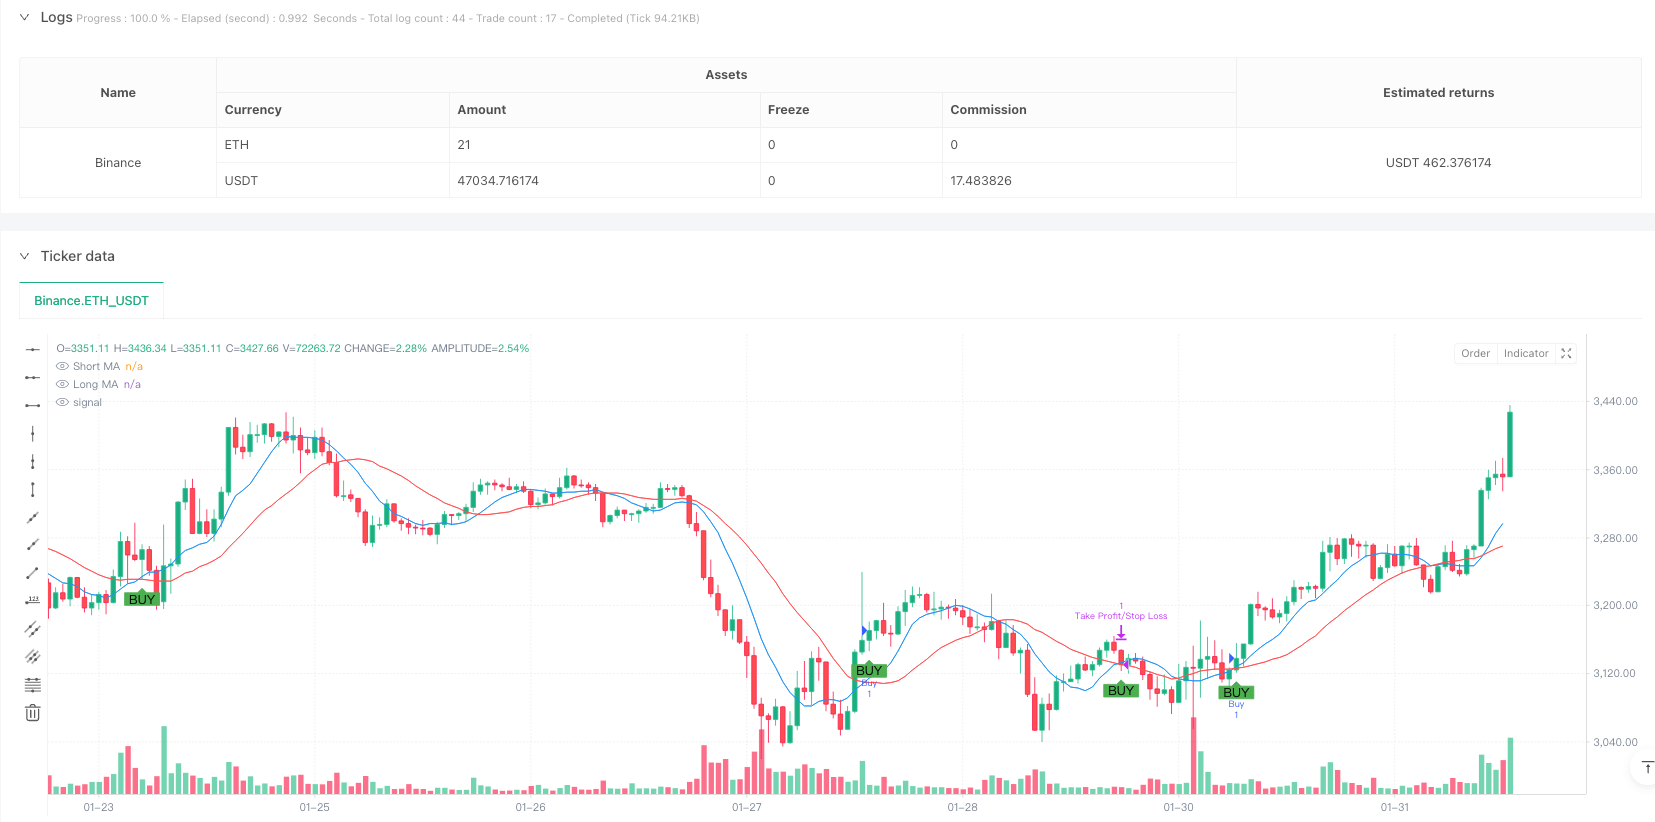
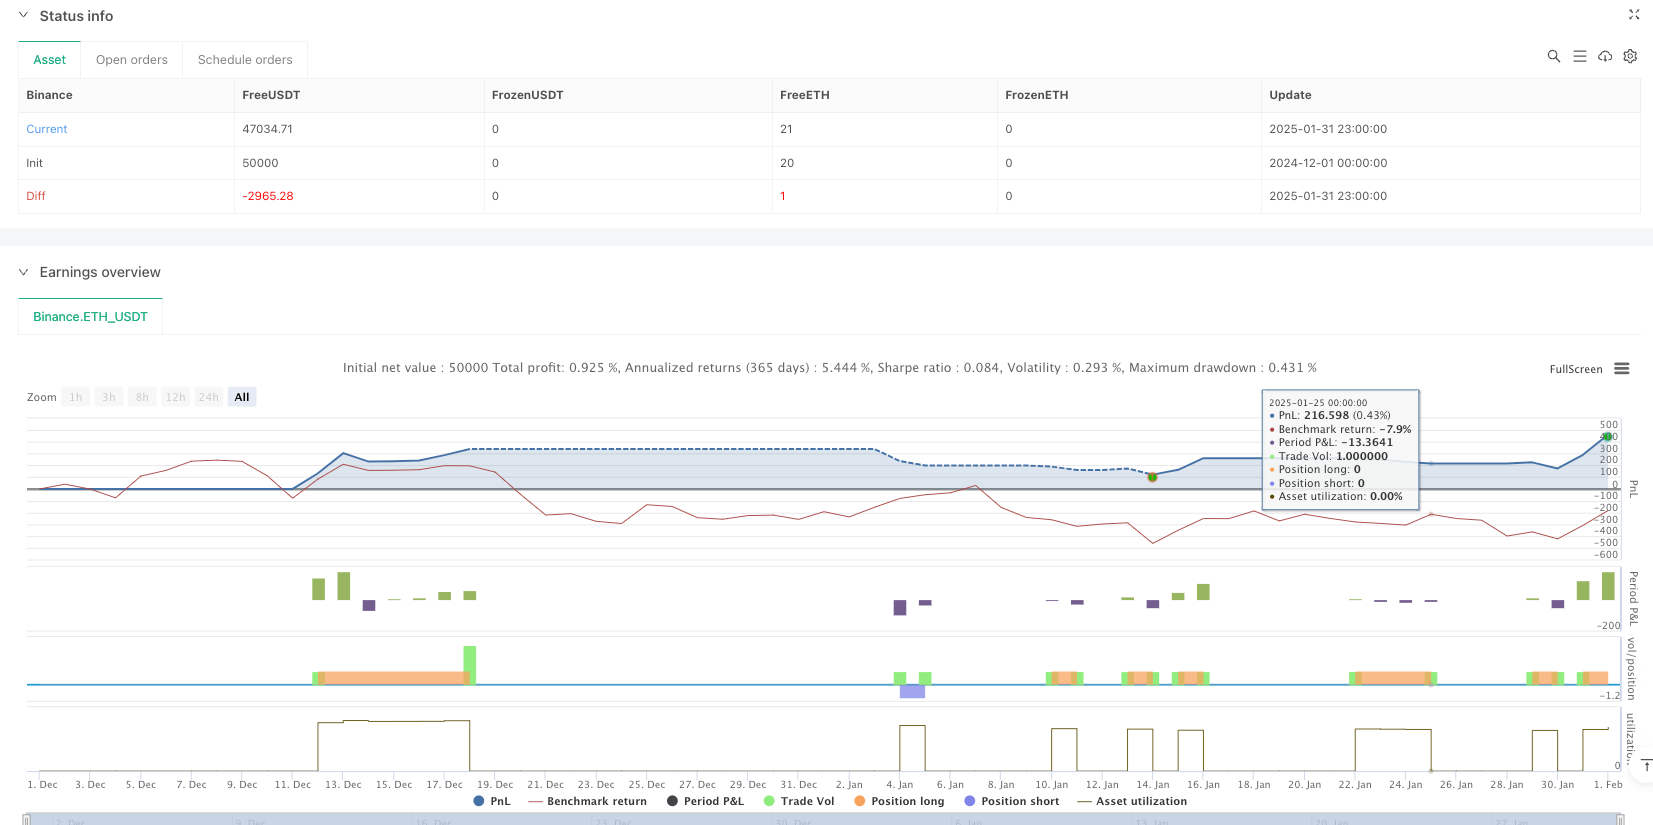
This is a comprehensive trading strategy that combines moving average crossovers, supply/demand zone identification, and dynamic risk management. The strategy determines trade direction through short-term and long-term moving average crossovers, utilizes supply/demand zones as key support and resistance levels, and manages risk with percentage-based stop-loss and take-profit levels. The strategy's core principle is to only enter trades near specific supply/demand zones to improve win rate.
Strategy Principles
The strategy employs 9-period and 21-period Simple Moving Averages (SMA) to determine trend direction. Buy signals are generated when price is within 1% of a demand zone (support) and the short-term MA crosses above the long-term MA; sell signals occur when price is within 1% of a supply zone (resistance) and the short-term MA crosses below the long-term MA. Supply/demand zones are identified based on significant highs/lows within 50 periods, requiring at least 2 confirmation candles. The system automatically sets dynamic stop-loss (default 1%) and take-profit (default 2%) levels based on entry price.
Strategy Advantages
- Multiple confirmation mechanism: Combines technical indicators (MA crossover) and price structure (supply/demand zones) to reduce false breakout risks
- Dynamic risk management: Stop-loss and take-profit levels based on entry price percentages, adapting to different market conditions
- Visual trade signals: Clear visualization of supply/demand zones and trade signals for analysis and verification
- Flexible parameters: MA periods, supply/demand zone confirmation conditions, and risk management levels can be adjusted for different markets
- Clear strategy logic: Well-defined entry and exit conditions for backtesting and optimization
Strategy Risks
- Choppy market risk: Frequent MA crossovers may generate excessive false signals
- Slippage risk: Trading near supply/demand zones may face significant slippage
- Parameter sensitivity: Optimal parameters may vary significantly across different market conditions
- Fixed stop-loss risk: Percentage-based stops may not suit all market environments
- Money management risk: Strategy lacks position sizing functionality
Optimization Directions
- Volume confirmation: Incorporate volume indicators in MA crossover and supply/demand zone analysis to improve signal reliability
- Dynamic parameter optimization: Automatically adjust stop-loss/take-profit percentages and zone ranges based on market volatility
- Trend filtering: Add longer-term trend analysis to avoid trading against major trends
- Enhanced money management: Include volatility-based position sizing calculations
- Improved zone identification: Introduce additional technical indicators to confirm supply/demand zone validity
Summary
This strategy system combines classical technical analysis methods with modern risk management concepts. By trading near significant price zones and incorporating moving average crossover signals, the strategy provides a relatively reliable trading framework. The dynamic stop-loss and take-profit design helps adapt to different market conditions, but practical application requires optimization based on specific market characteristics. Thorough parameter optimization and backtesting are recommended before live trading.
Source Pine Script
/*backtest
start: 2024-12-01 00:00:00
end: 2025-02-01 00:00:00
period: 1h
basePeriod: 1h
exchanges: [{"eid":"Binance","currency":"ETH_USDT"}]
*/

//@version=5
strategy("MA Crossover with Demand/Supply Zones + Stop Loss/Take Profit", overlay=true)

// Input parameters for Moving Averages
shortLength = input.int(9, title="Short MA Length", minval=1)
longLength = input.int(21, title="Long MA Length", minval=1)

// Input parameters for Demand/Supply Zones
zoneLookback = input.int(50, title="Zone Lookback Period", minval=10)
zoneStrength = input.int(2, title="Zone Strength (Candles)", minval=1)

// Input parameters for Stop Loss and Take Profit
stopLossPerc = input.float(1.0, title="Stop Loss (%)", minval=0.1) / 100
takeProfitPerc = input.float(2.0, title="Take Profit (%)", minval=0.1) / 100

// Calculate moving averages
shortMA = ta.sma(close, shortLength)
longMA = ta.sma(close, longLength)

// Plot moving averages
plot(shortMA, color=color.blue, title="Short MA")
plot(longMA, color=color.red, title="Long MA")

// Identify Demand and Supply Zones
var float demandZone = na
var float supplyZone = na

// Detect Demand Zones (Price makes a significant low and bounces up)
if (ta.lowest(low, zoneLookback) == low[zoneStrength] and close[zoneStrength] > open[zoneStrength])
    demandZone := low[zoneStrength]

// Detect Supply Zones (Price makes a significant high and drops down)
if (ta.highest(high, zoneLookback) == high[zoneStrength] and close[zoneStrength] < open[zoneStrength])
    supplyZone := high[zoneStrength]

// Draw Demand and Supply Zones using lines
var line demandLine = na
var line supplyLine = na


// Trade Logic: Only open trades near Demand/Supply Zones
isNearDemand = demandZone > 0 and close <= demandZone * 1.01  // Within 1% of demand zone
isNearSupply = supplyZone > 0 and close >= supplyZone * 0.99  // Within 1% of supply zone

// Calculate Stop Loss and Take Profit levels
stopLossLevel = strategy.position_avg_price * (1 - stopLossPerc)  // Stop loss for long positions
takeProfitLevel = strategy.position_avg_price * (1 + takeProfitPerc)  // Take profit for long positions

stopLossLevelShort = strategy.position_avg_price * (1 + stopLossPerc)  // Stop loss for short positions
takeProfitLevelShort = strategy.position_avg_price * (1 - takeProfitPerc)  // Take profit for short positions

// Generate buy/sell signals based on MA crossover and zones
if (ta.crossover(shortMA, longMA) and isNearDemand)
    strategy.entry("Buy", strategy.long)
    strategy.exit("Take Profit/Stop Loss", from_entry="Buy", stop=stopLossLevel, limit=takeProfitLevel)

if (ta.crossunder(shortMA, longMA) and isNearSupply)
    strategy.entry("Sell", strategy.short)
    strategy.exit("Take Profit/Stop Loss", from_entry="Sell", stop=stopLossLevelShort, limit=takeProfitLevelShort)

// Optional: Plot buy/sell signals on the chart
plotshape(series=ta.crossover(shortMA, longMA) and isNearDemand, title="Buy Signal", location=location.belowbar, color=color.green, style=shape.labelup, text="BUY")
plotshape(series=ta.crossunder(shortMA, longMA) and isNearSupply, title="Sell Signal", location=location.abovebar, color=color.red, style=shape.labeldown, text="SELL")Published by ianzeng123 on the FMZ strategy square · last modified 2025-02-20. Collected in the Quant Trading Vault. Unvalidated research: re-test with your own data and costs before trusting it.
Build this with AgenKit
A spec is not a trading system. Paste this into your coding agent and AgenKit runs a specialist team — architecture, test-first build, risk gates, review — with paper trading on by default.
/agenkit build a production-grade trading bot with a backtest engine, risk controls and paper trading by default from strategies/Moving-Average-Based-Supply-Demand-Zone-Trading-System-with-Dynamic-Risk-Management.md- npx agenkit install engineering-kit in your project
- Paste the command into your agent and approve each phase
- Get tests, backtest, risk controls and a paper-trading switch
Understand it first
Before you run this, read the lesson behind the idea and how to backtest it honestly. Specs like this one are the survivors of an unknown number of trials; deflate their results accordingly.
Related specs
- Momentum Breakout Trading Strategy 435896Pine Script · Breakout · 1d
- Multi factor Intelligent Trading StrategyPine Script · Breakout · 1d
- Advanced Long Only Dynamic Trendline Breakout StrategyPine Script · Breakout · 1d
- Bollinger Bands Breakout Strategy 442259Pine Script · Breakout · 1h
- Market Structure Breakthrough with Volume Spike and RSI Confluence StrategyPine Script · Breakout · 1h
- Multi Indicator Dynamic Trading StrategyPine Script · Breakout · 1h