Moving Average Channel Breakout Strategy
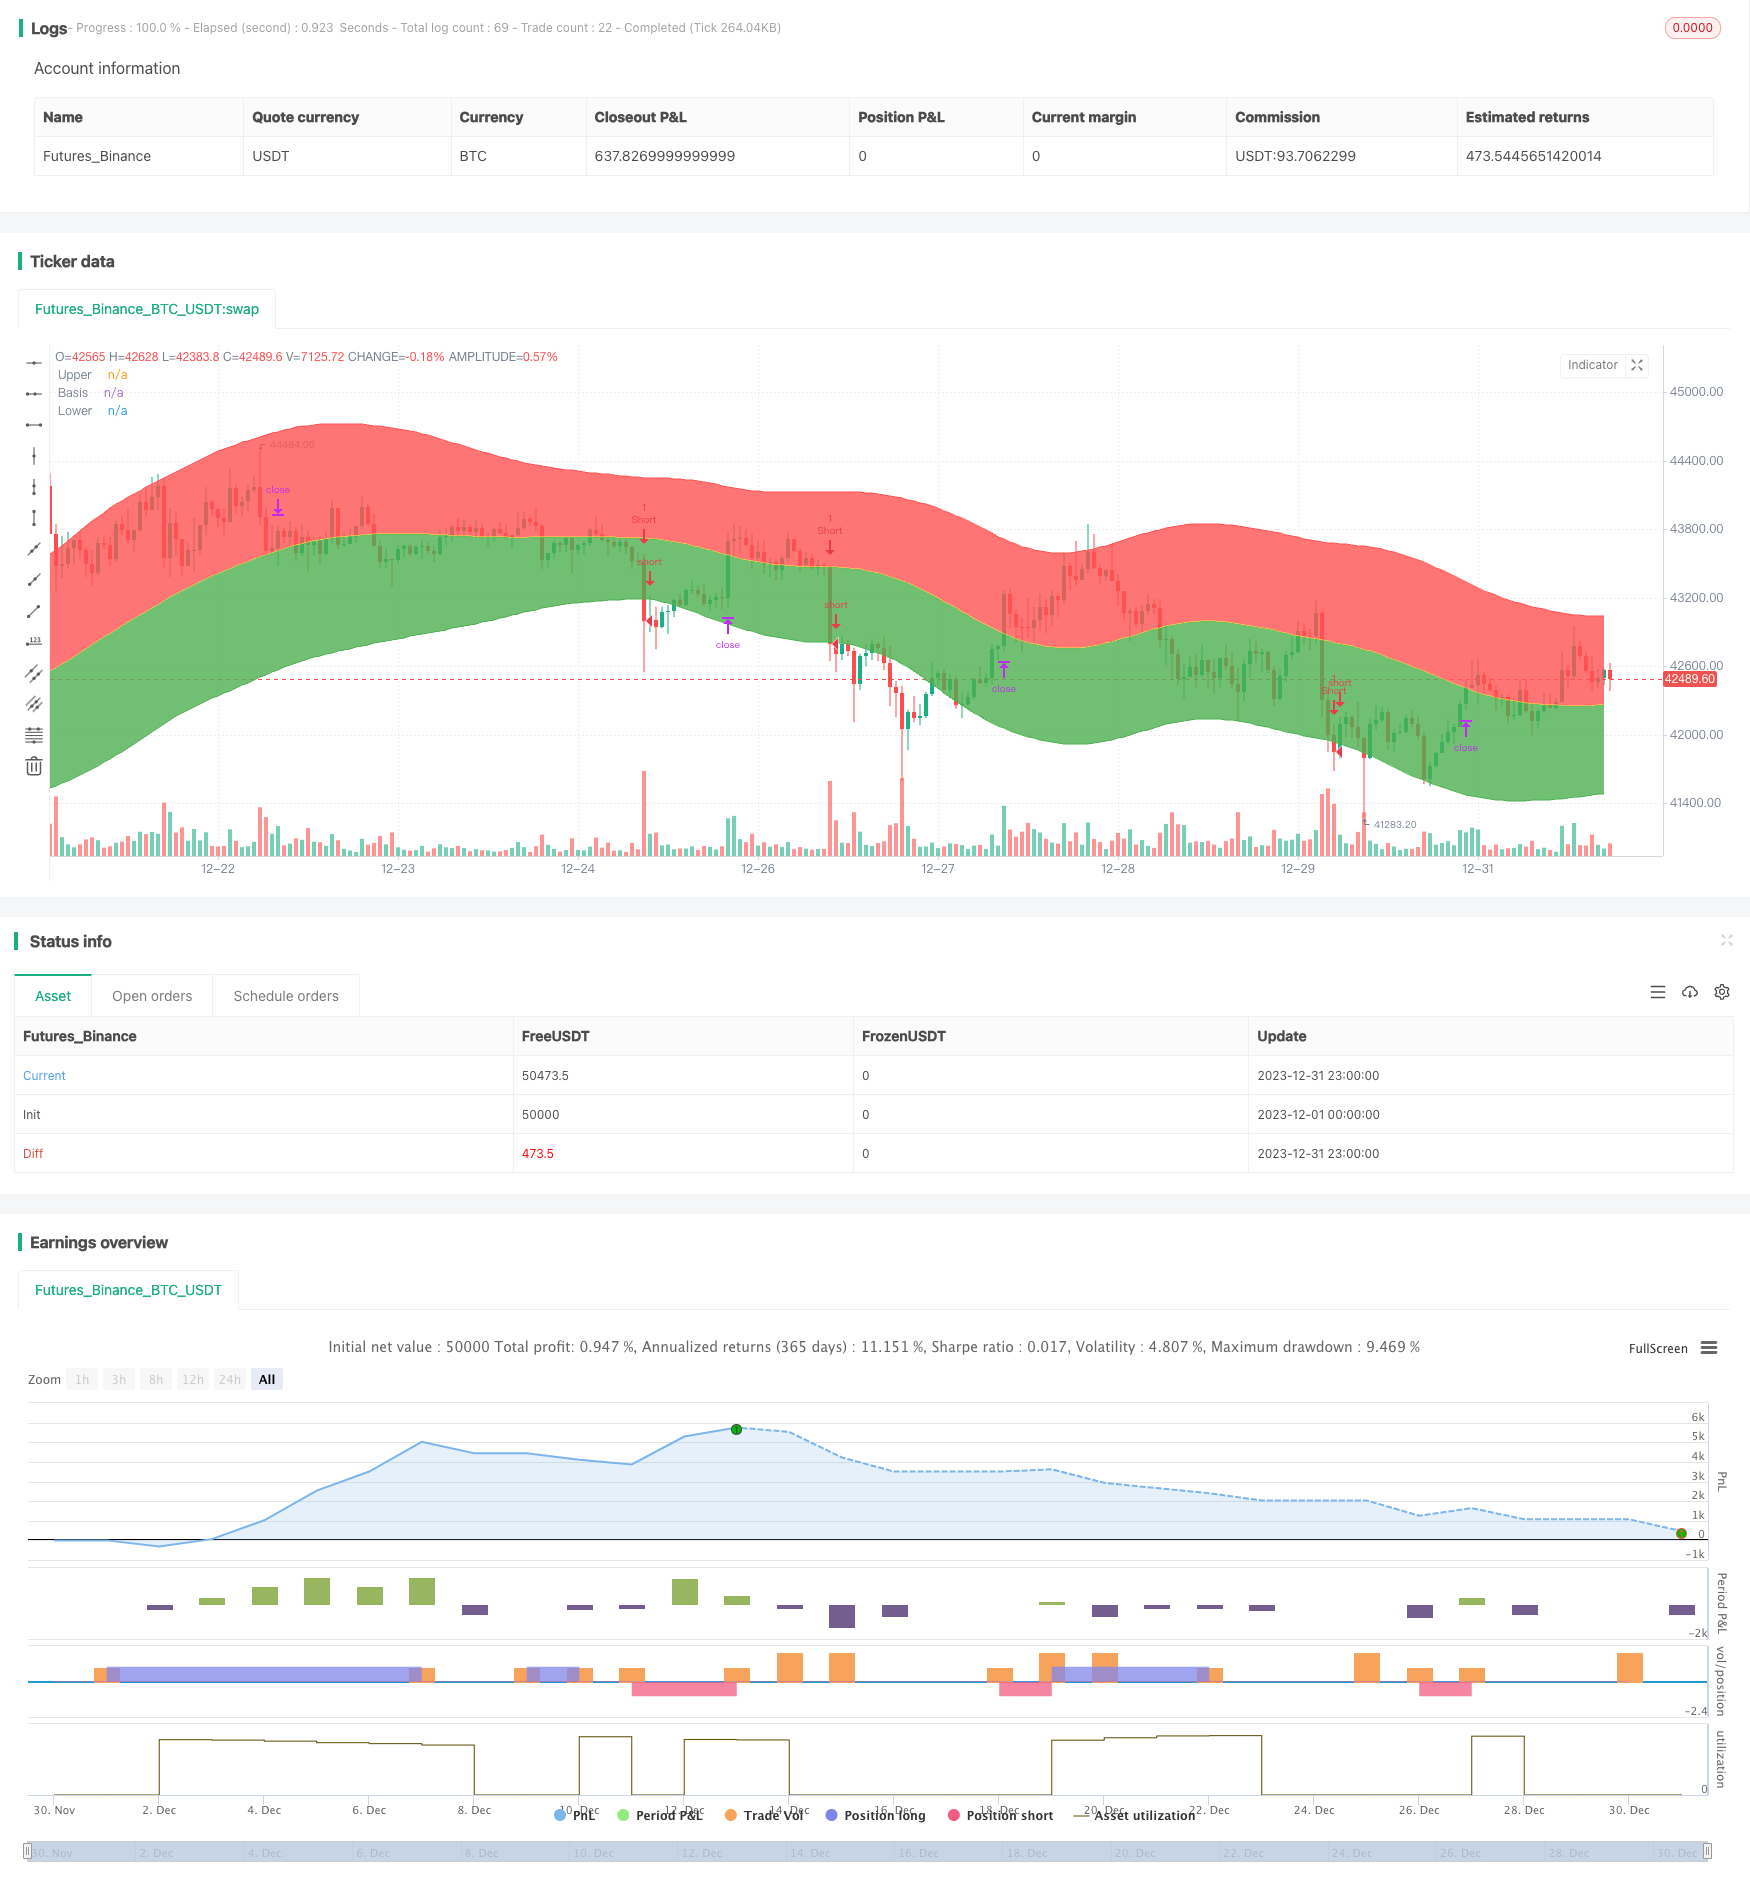
This strategy calculates the middle, upper and lower rails of the Keltner Channel. It fills the color ABOVE the middle and lower rails. After determining the direction of the channel, it breaks through and buys and…
Overview
This strategy calculates the middle, upper and lower rails of the Keltner Channel. It fills the color ABOVE the middle and lower rails. After determining the direction of the channel, it breaks through and buys and sells. It is a kind of trend tracking strategy.
Strategy Principle
The core indicator is the Keltner Channel. The middle rail of the channel is the N-day weighted moving average of the typical price (highest price + lowest price + closing price)/3. The upper and lower rail lines of the channel are respectively one trading range N-day weighted moving average away from the middle rail line. Where the trading range can choose the true volatility ATR, or directly take the amplitude (highest price - lowest price). The latter is adopted in this strategy.
Specifically, the strategy mainly judges whether the price breaks through the upper rail or the lower rail, and makes long or short decisions with the middle rail as the boundary. If the closing price is greater than the upper rail, go long; if the closing price is less than the lower rail, go short. The stop loss line is the MA value of the middle rail.
Advantage Analysis
- Using the Keltner Channel indicator, it has a good judgment on the price fluctuation range, avoiding false breakthroughs.
- Using the middle rail moving average as support can reduce losses.
- Breaking through the upper rail for long and the lower rail for short belongs to the trend tracking strategy, which is in line with the price change law of most stocks.
Risk Analysis
- Breakthrough channel strategies are very sensitive to parameters and require repeated testing to find the best parameter combination.
- When stock prices fluctuate sharply in the short term, trading risks will increase. Appropriately relax the channel width to reduce the risk of erroneous transactions.
- The effect has a high correlation with parameter settings and varieties, and adjustments are required to adapt to different varieties.
Optimization Directions
- Combine other indicators to filter signals and avoid erroneous transactions. Such as momentum indicator, volatility indicator, etc.
- Optimize parameters to find the best parameter combination. Mainly adjust the moving average parameter and the channel multiple.
- There will be considerable differences in parameter settings for different varieties, which need to be optimized separately.
Summary
In general, this strategy is relatively simple and direct, and it is a common price breakthrough strategy. The advantage is that the idea is clear and easy to understand and implement, which is suitable for beginners to learn. But there are also certain limitations. It is sensitive to parameters, the results are uneven, and repeated testing and optimization are required. If it can be combined with more complex judgment indicators, it can form a more powerful trading strategy.
Parameters
| Name | Default | What it controls |
|---|---|---|
| v_input_1 | true | useTrueRange |
| v_input_2 | 20 | length |
| v_input_3 | 2.618 | mult |
Source Pine Script
/*backtest
start: 2023-12-01 00:00:00
end: 2023-12-31 23:59:59
period: 1h
basePeriod: 15m
exchanges: [{"eid":"Futures_Binance","currency":"BTC_USDT"}]
*/

// This source code is subject to the terms of the Mozilla Public License 2.0 at https://mozilla.org/MPL/2.0/
// © WMX_Q_System_Trading
//@version=3

strategy(title = "WMX Keltner Channels strategy", shorttitle = "WMX Keltner Channels strategy", overlay = true)

useTrueRange = input(true)
length = input(20, minval=5)
mult = input(2.618, minval=0.1)
mah =ema(ema( ema(high, length),length),length)
mal =ema(ema( ema(low, length),length),length)
range = useTrueRange ? tr : high - low
rangema =ema(ema( ema(range, length),length),length)
upper = mah + rangema * mult
lower = mal - rangema * mult
ma=(upper+lower)/2
uc = red
lc=green
u = plot(upper, color=uc, title="Upper")
basis=plot(ma, color=yellow, title="Basis")
l = plot(lower, color=lc, title="Lower")
fill(u, basis, color=uc, transp=95)
fill(l, basis, color=lc, transp=95)


strategy.entry("Long", strategy.long,  stop = upper, when = strategy.position_size <= 0 and close >upper)
strategy.entry("Short", strategy.short,  stop = lower, when = strategy.position_size >= 0 and close<lower)
if strategy.position_size > 0
    strategy.exit("Stop Long", "Long", stop = ma)

if strategy.position_size < 0
    strategy.exit("Stop Short", "Short", stop = ma)
Published by ChaoZhang on the FMZ strategy square · last modified 2024-01-29. Collected in the Quant Trading Vault. Unvalidated research: re-test with your own data and costs before trusting it.
Build this with AgenKit
A spec is not a trading system. Paste this into your coding agent and AgenKit runs a specialist team — architecture, test-first build, risk gates, review — with paper trading on by default.
/agenkit build a production-grade trading bot with a backtest engine, risk controls and paper trading by default from strategies/Moving-Average-Channel-Breakout-Strategy.md- npx agenkit install engineering-kit in your project
- Paste the command into your agent and approve each phase
- Get tests, backtest, risk controls and a paper-trading switch
Understand it first
Before you run this, read the lesson behind the idea and how to backtest it honestly. Specs like this one are the survivors of an unknown number of trials; deflate their results accordingly.
Related specs
- Dual Breakout Volatility Channel StrategyPine Script · Breakout · 1h
- Flexible Long Short Trading Strategy Based on Keltner ChannelsPine Script · Breakout · 1d
- Keltner Channels EMA ATR Strategy KeltnerPine Script · Breakout · 1h
- Quantitative Trading Price Breakthrough StrategyPine Script · Breakout · 1d
- Dynamic Channel Breakout Strategy 427017Pine Script · Breakout · 1m
- Integrated Ichimoku Keltner Trading System Based on Moving Average StrategyPine Script · Breakout · 1h