Strategy vault / Trend following
Moving Average Crossover Strategy 440107
The moving average crossover strategy is a quantitative trading strategy based on moving averages. By calculating the average price of securities over a period of time, it generates trading signals through the…
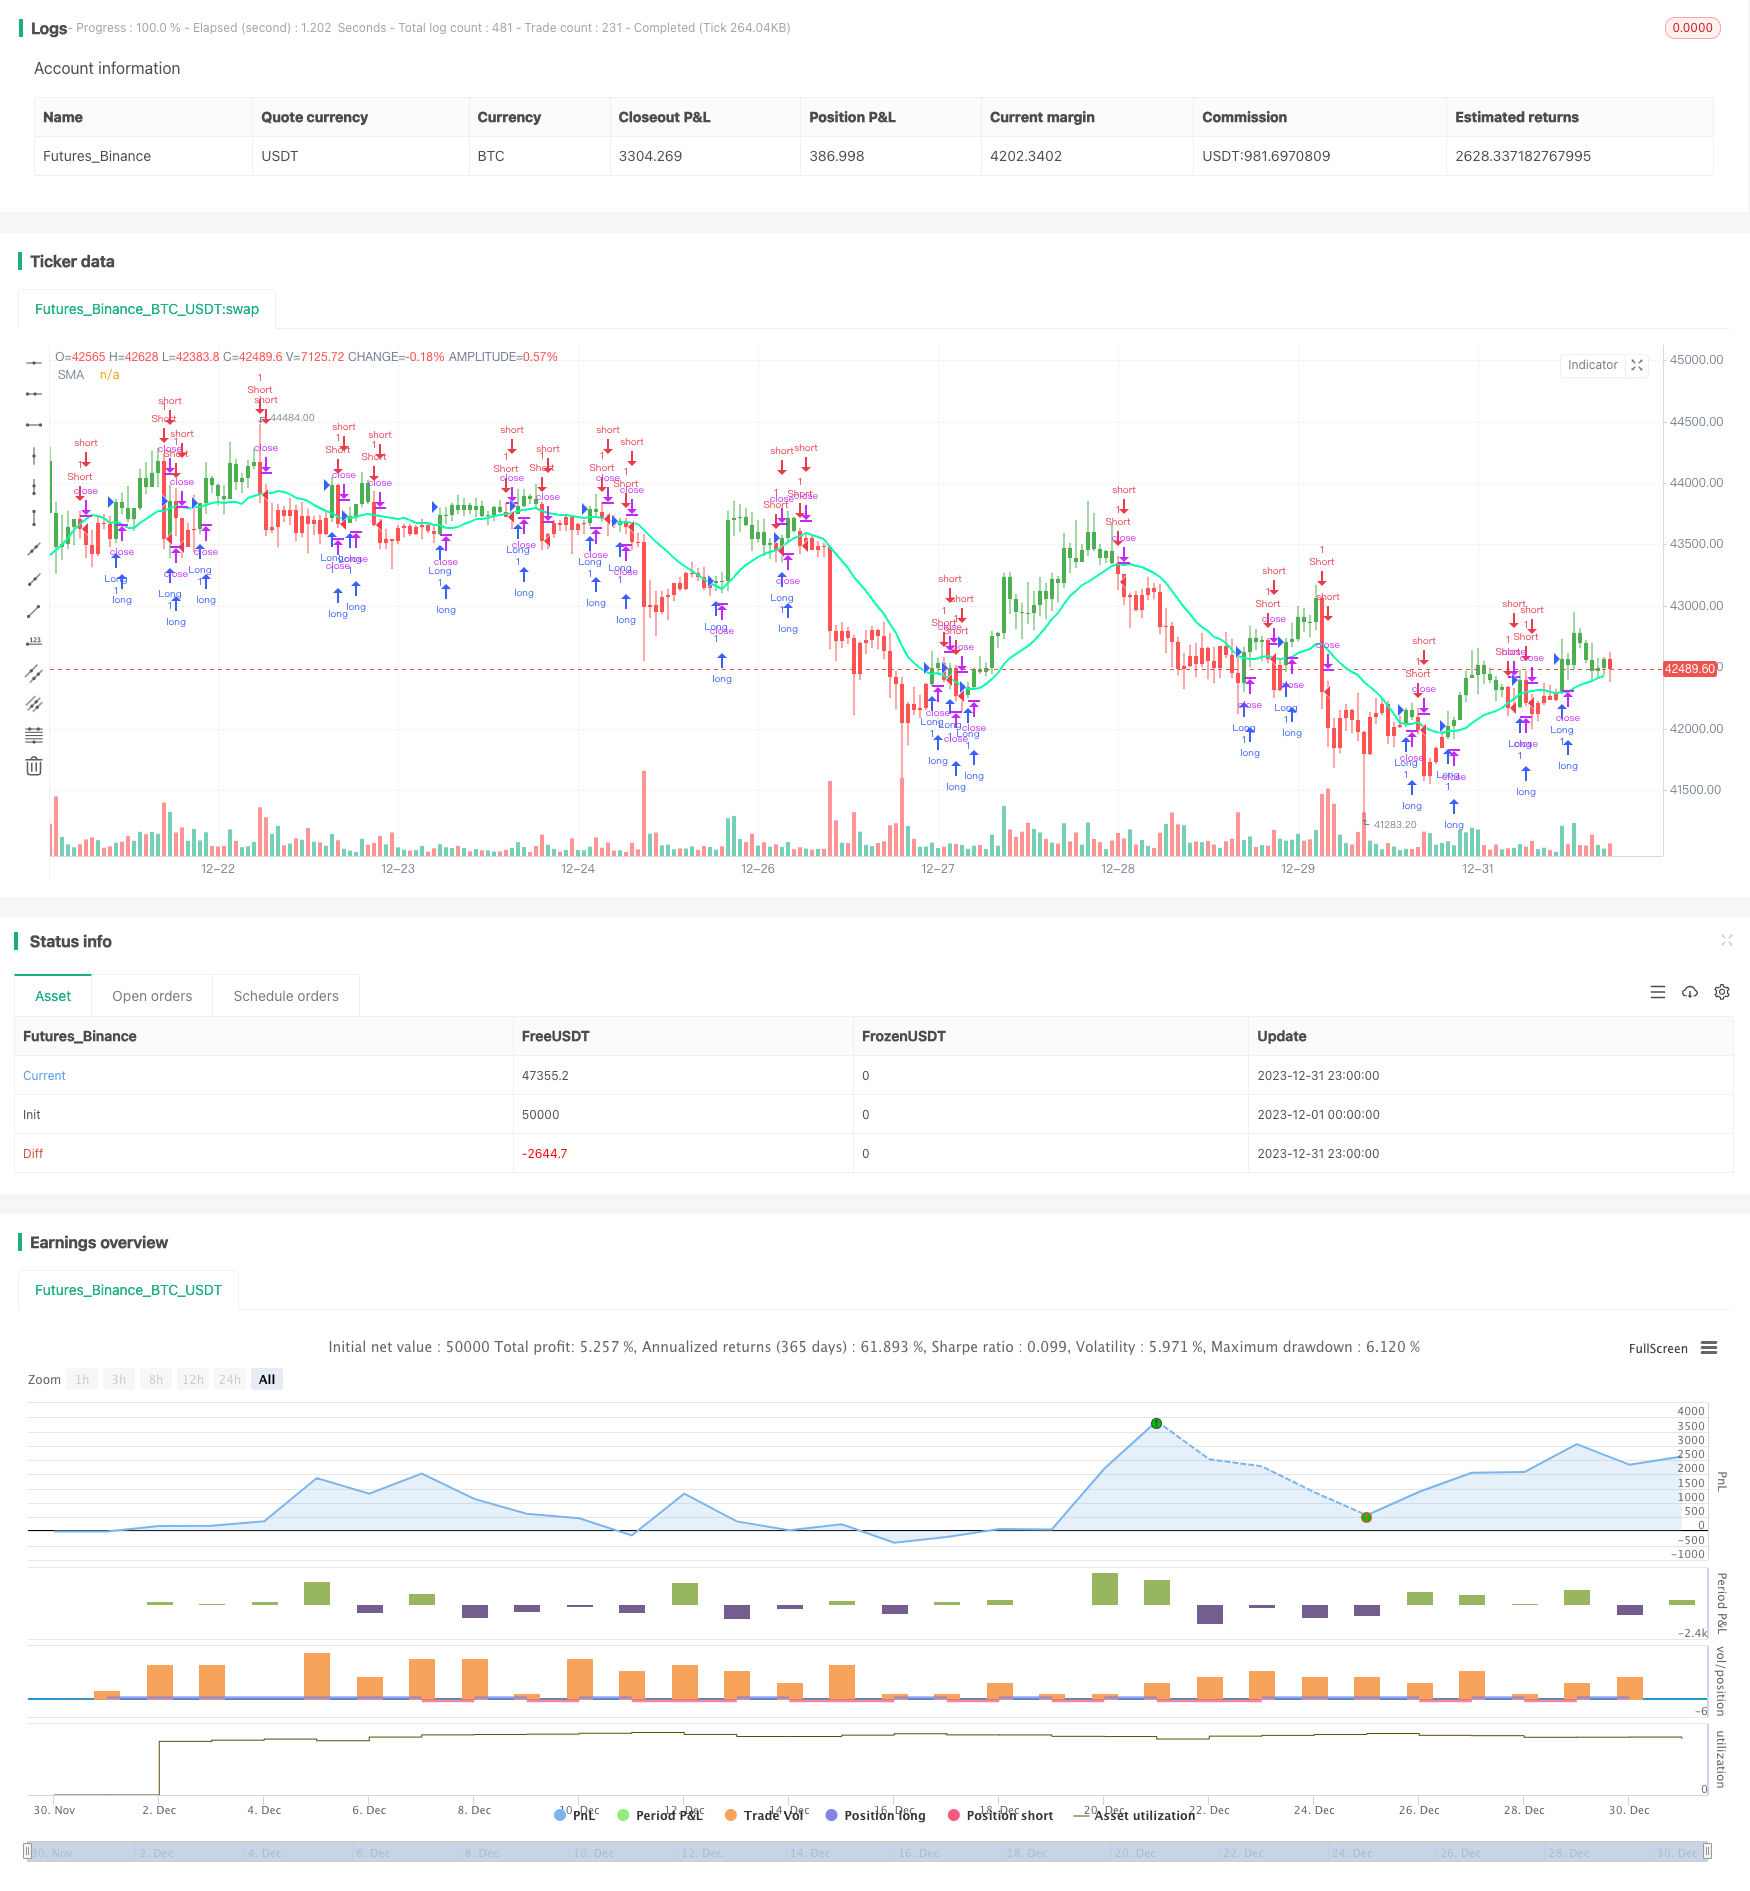
Overview
The moving average crossover strategy is a quantitative trading strategy based on moving averages. By calculating the average price of securities over a period of time, it generates trading signals through the crossover of price moving averages to make profits.
Strategy Principle
This strategy mainly uses the crossover of fast and slow moving average lines to determine price trends and generate trading signals. Specifically, it employs two moving averages with different period lengths, such as 10-day and 20-day lines.
When the fast moving average line breaks through the slow moving average line upward, the market is considered to turn from decline to rise, generating a buy signal. When the fast moving average line breaks through the slow moving average line downward, the market is thought to turn from rise to decline, producing a sell signal.
By capturing the inflection points of price trends, this strategy can buy during an improving market and sell during a worsening market to make profits.
Advantage Analysis
This strategy has the following advantages:
- The concept is simple and easy to understand and implement
- Highly customizable by adjusting moving average periods etc.
- Good backtesting results, especially suitable for trending markets
- Can incorporate take profit and stop loss to control risks
Risk Analysis
This strategy also has the following risks:
- Prone to generating false signals and overtrading during range-bound markets
- Parameter tuning needed as different parameter sets lead to varied backtest results
- Ignores transaction costs and slippage, actual results likely weaker than backtest
- Time lag exists, may miss opportunities from fast price reversals
These risks can be alleviated through appropriate optimizations.
Optimization Directions
This strategy can be optimized in the following aspects:
- Add filters like volume and volatility indicators to avoid wrong trades during consolidations
- Employ adaptive moving averages to allow dynamic period changes for better trend following
- Optimize moving average periods to find best parameter sets
- Set re-entry conditions to prevent excessive trades
- Consider actual trading costs and slippage, adjust take profit and stop loss
The above optimizations can greatly improve the actual performance of the strategy.
Summary
In summary, the moving average crossover strategy is an easy to grasp and implement quantitative trading strategy. It judges market trends and generates trading signals through the intuitive principle of price average line crossovers. With parameter tuning and combinations with other technical indicators, it can strengthen the actual performance of this strategy and make it a reliable profit generator.
Parameters
| Name | Default | What it controls |
|---|---|---|
| v_input_1 | D | Resolution |
| v_input_2_close | 0 | Source: close | high | low | open | hl2 | hlc3 | hlcc4 | ohlc4 |
| v_input_3 | 14 | Length |
| v_input_4_close | 0 | Trigger Price: close | high | low | open | hl2 | hlc3 | hlcc4 | ohlc4 |
| v_input_5 | 50 | Take Profit |
| v_input_6 | 20 | Stop Loss |
| v_input_7 | false | Use TakeStop |
| v_input_8 | true | Painting bars |
| v_input_9 | true | Show Line |
| v_input_10 | false | Use Alerts |
| v_input_11 | false | Trade Reverse |
Source Pine Script
/*backtest
start: 2023-12-01 00:00:00
end: 2023-12-31 23:59:59
period: 1h
basePeriod: 15m
exchanges: [{"eid":"Futures_Binance","currency":"BTC_USDT"}]
*/

// This source code is subject to the terms of the Mozilla Public License 2.0 at https://mozilla.org/MPL/2.0/
// © HPotter
//  Simple SMA strategy
//
// WARNING:
//      - For purpose educate only
//      - This script to change bars colors
//@version=4
strategy(title="Simple SMA Strategy Backtest", shorttitle="SMA Backtest", precision=6, overlay=true)
Resolution = input(title="Resolution", type=input.resolution, defval="D")
Source = input(title="Source", type=input.source, defval=close)
xSeries = security(syminfo.tickerid, Resolution, Source)
Length = input(title="Length", type=input.integer, defval=14, minval=2)
TriggerPrice = input(title="Trigger Price", type=input.source, defval=close)
TakeProfit = input(50, title="Take Profit", step=0.01)
StopLoss = input(20, title="Stop Loss", step=0.01)
UseTPSL = input(title="Use Take\Stop", type=input.bool, defval=false)
BarColors = input(title="Painting bars", type=input.bool, defval=true)
ShowLine = input(title="Show Line", type=input.bool, defval=true)
UseAlerts = input(title="Use Alerts", type=input.bool, defval=false)
reverse = input(title="Trade Reverse", type=input.bool, defval=false)
pos = 0
xSMA = sma(xSeries, Length)
pos := iff(TriggerPrice > xSMA, 1,
         iff(TriggerPrice < xSMA, -1, nz(pos[1], 0)))
nRes = ShowLine ? xSMA : na
alertcondition(UseAlerts == true and pos != pos[1] and pos == 1, title='Signal Buy', message='Strategy to change to BUY')
alertcondition(UseAlerts == true and pos != pos[1] and pos == -1, title='Signal Sell', message='Strategy to change to SELL')
alertcondition(UseAlerts == true and pos != pos[1] and pos == 0, title='FLAT', message='Strategy get out from position')
possig =iff(pos[1] != pos,
         iff(reverse and pos == 1, -1,
           iff(reverse and pos == -1, 1, pos)), 0)
if (possig == 1)
    strategy.entry("Long", strategy.long)
if (possig == -1)
    strategy.entry("Short", strategy.short)

if (UseTPSL)
    strategy.close("Long", when = high > strategy.position_avg_price + TakeProfit, comment = "close buy take profit")
    strategy.close("Long", when = low < strategy.position_avg_price - StopLoss, comment = "close buy stop loss")
    strategy.close("Short", when = low < strategy.position_avg_price - TakeProfit, comment = "close buy take profit")
    strategy.close("Short", when = high > strategy.position_avg_price + StopLoss, comment = "close buy stop loss")
nColor = BarColors ? strategy.position_avg_price != 0  and pos == 1 ? color.green :strategy.position_avg_price != 0 and pos == -1 ? color.red : color.blue : na
barcolor(nColor)
plot(nRes, title='SMA', color=#00ffaa, linewidth=2, style=plot.style_line)
Published by ChaoZhang on the FMZ strategy square · last modified 2024-01-26. Collected in the Quant Trading Vault. Unvalidated research: re-test with your own data and costs before trusting it.
Build this with AgenKit
A spec is not a trading system. Paste this into your coding agent and AgenKit runs a specialist team — architecture, test-first build, risk gates, review — with paper trading on by default.
/agenkit build a production-grade trading bot with a backtest engine, risk controls and paper trading by default from strategies/Moving-Average-Crossover-Strategy-440107.md- npx agenkit install engineering-kit in your project
- Paste the command into your agent and approve each phase
- Get tests, backtest, risk controls and a paper-trading switch
Understand it first
Before you run this, read the lesson behind the idea and how to backtest it honestly. Specs like this one are the survivors of an unknown number of trials; deflate their results accordingly.
Related specs
- ADX MA and EMA Long Only Trend Tracking StrategyPine Script · Trend following · 1d
- ATR and Moving Average Crossover Hybrid StrategyPine Script · Trend following · 1h
- Adaptive FVG Detection and MA Trend Trading Strategy with Dynamic ResistancePine Script · Trend following · 1d
- Adaptive Risk Management Strategy Based on Dynamic ATR and Moving Average CrossoverPine Script · Trend following · 2h
- Adaptive Trading Strategy Based on Stochastic RSI Dual Line CrossoverPine Script · Trend following · 4h
- Adaptive Volatility Based Trend Following Short Strategy with Time Delay and Stop Loss ProtectionPine Script · Trend following · 2m