Strategy vault / Mean reversion
Moving Average Pullback Strategy
The moving average pullback strategy tracks the crossovers of price moving averages, and identifies pullback opportunities to make counter-trend trades when golden crosses occur. This strategy utilizes Fibonacci…
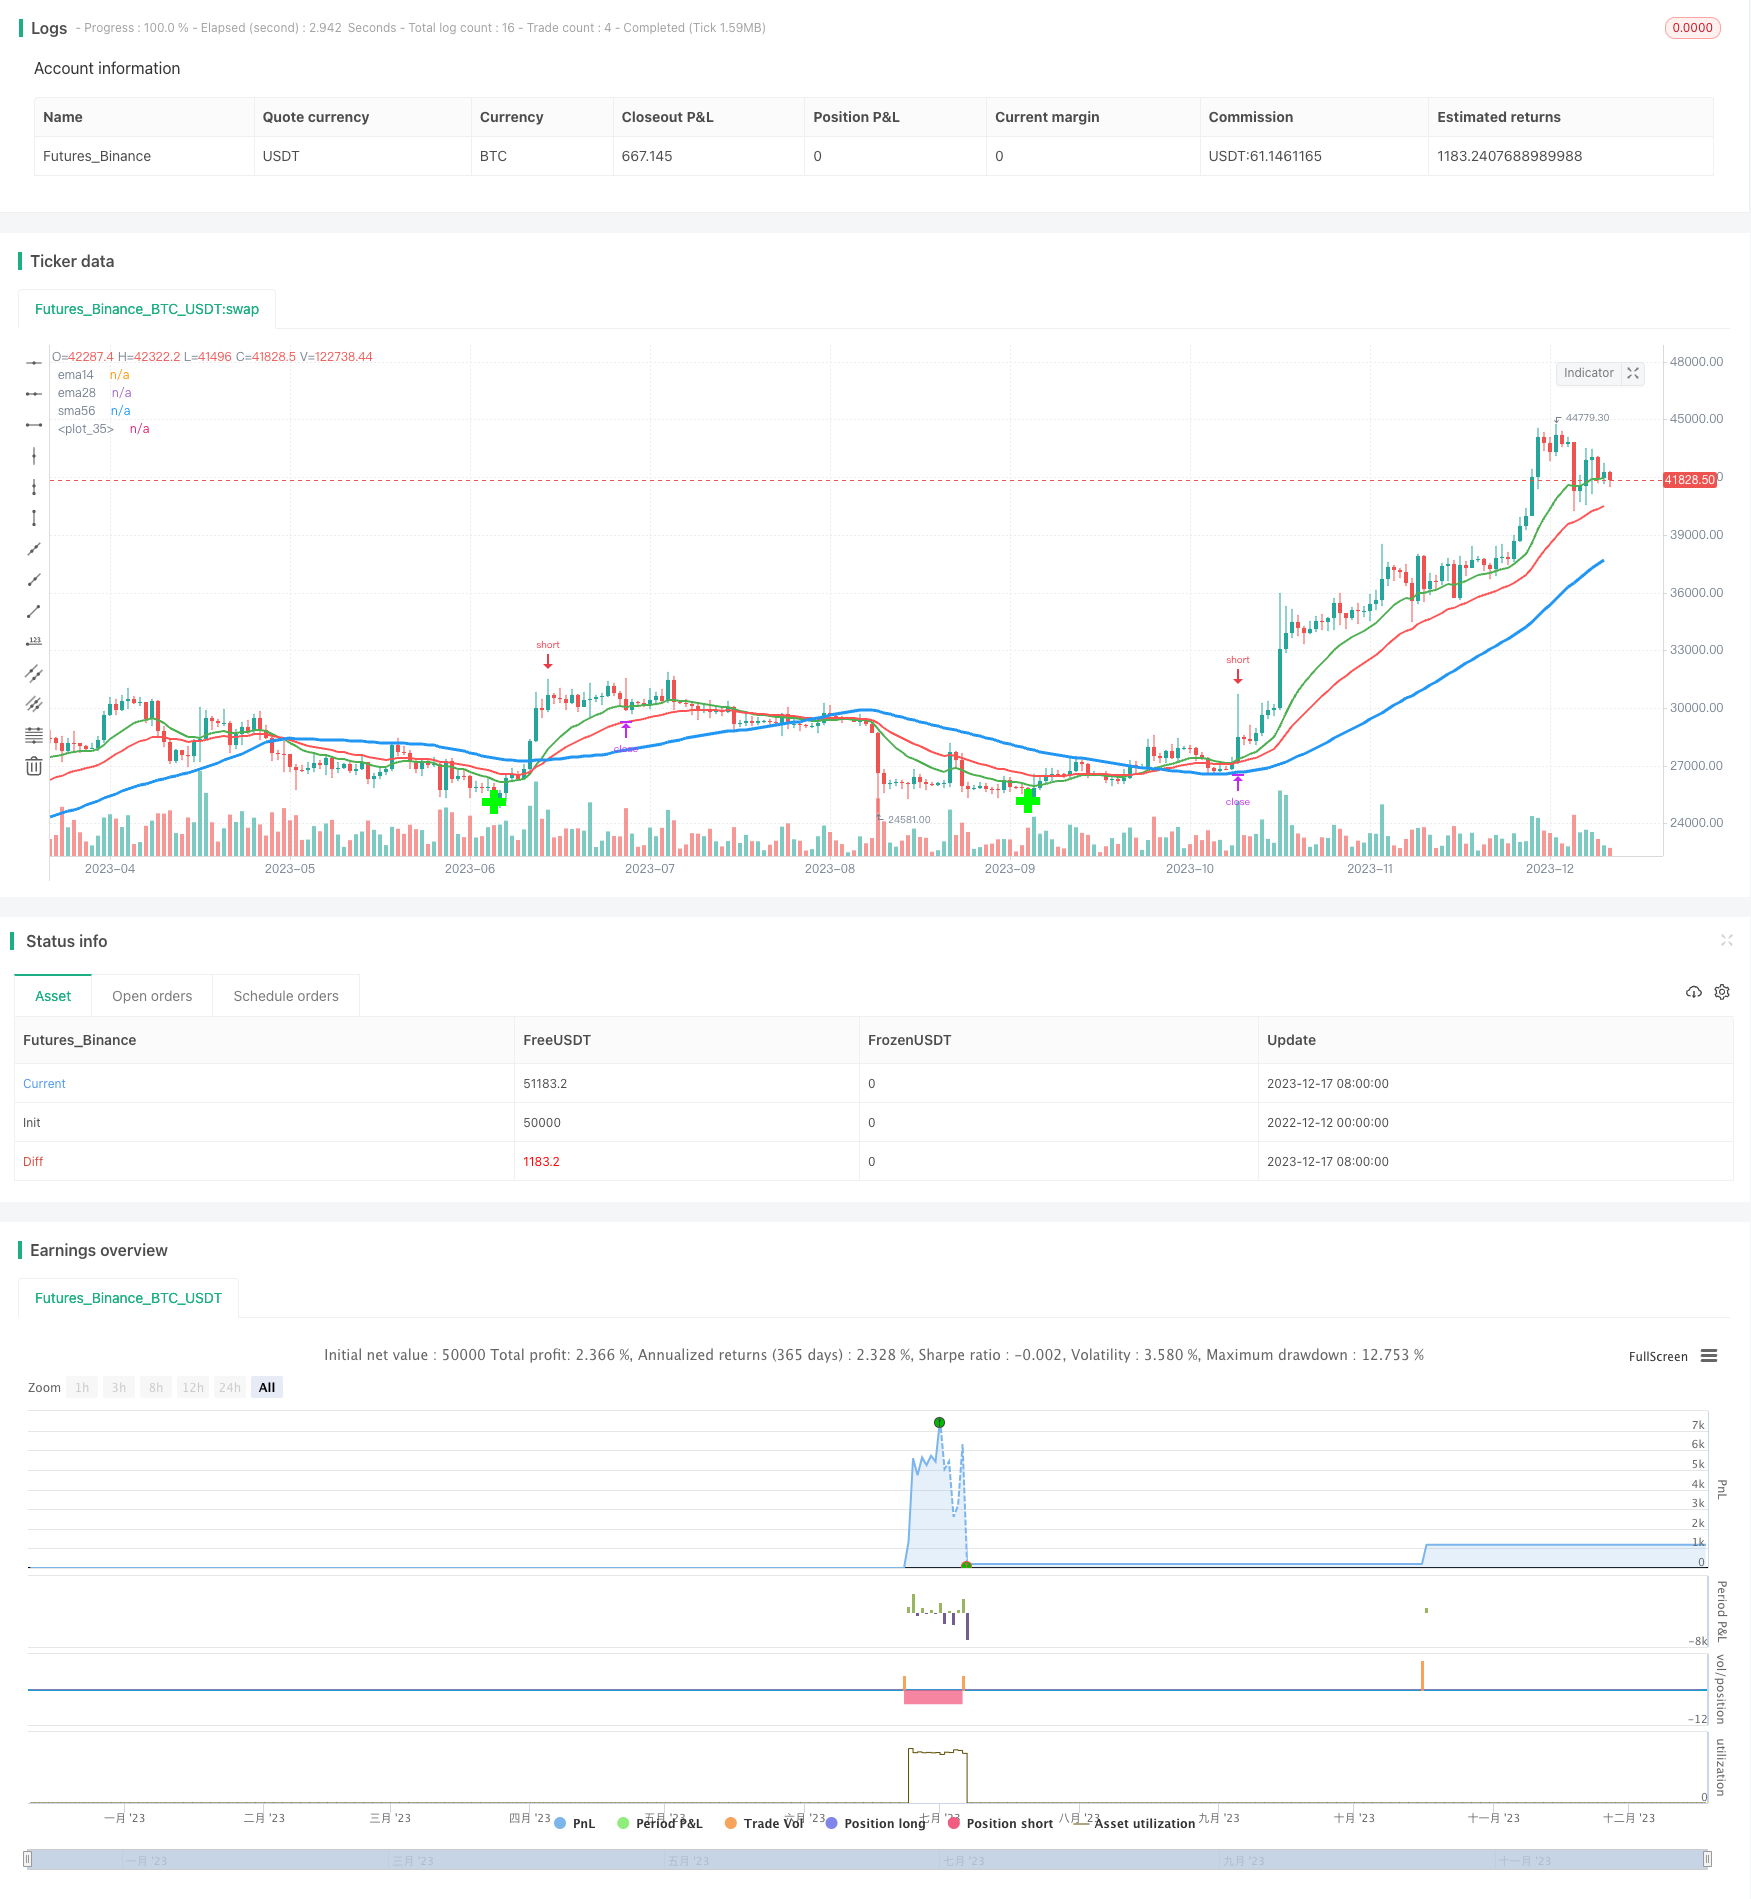
Overview
The moving average pullback strategy tracks the crossovers of price moving averages, and identifies pullback opportunities to make counter-trend trades when golden crosses occur. This strategy utilizes Fibonacci pullback lines to set entry and stop loss/profit taking levels to capture short-term price pullbacks.
Strategy Logic
The core of this strategy involves two moving averages - the 14-day EMA and the 56-day SMA. It triggers a buy signal when the 14-day EMA crosses above the 56-day SMA from below. Afterwards, the strategy looks back 20 days to find a swing low as support. Combined with the close price at crossover point, Fibonacci pullback lines are plotted, with 1.272 pullback line as entry and 0.618 as exit. Thus the strategy sets an entry point to go short after golden crosses, and takes profit if prices really pull back to 0.618 line.
The key steps of this strategy are:
- Calculate the 14-day EMA and 56-day SMA;
- Check if the EMA crosses above the SMA golden cross signal;
- Look back to find a swing low for support;
- Plot Fibonacci pullback lines with the low and crossover point;
- Set entry for short at the 1.272 pullback line;
- Set take profit stop at 0.618 pullback line.
The above explains the main workflow and logic behind this pullback strategy. It aims to capture opportunities when prices reverse short-term.
Advantages
The key advantages of this moving average pullback strategy are:
- The strategy idea is simple and easy to understand;
- Utilize Fibonacci theory to set better risk controls;
- Can capture short-term reversal opportunities for good profits;
- Only requires a moving average golden cross to trigger entries.
In summary, this is very suitable for short-term mean-reversion style trading. It captures pullback chances to profit. The strategy is also simple and straightforward to implement.
Risks
Despite the pros, there are also certain risks to note for this strategy:
- Long holding may lead to huge losses, as we are countertrend shorting;
- Pullback magnitude too small to reach take profits;
- Overly aggressive pullback line settings.
To mitigate the risks, we can set a short stop loss timeframe to control losses; also optimize the pullback line ranges to aim for reasonable profit targets.
Enhancement Opportunities
There is still much room to optimize this moving average pullback strategy:
Test different parameter settings on items like moving average periods, lookback days, Fibonacci multiples etc to find optimum;
Add stop loss mechanisms like multiple stops or trailing stops to better control risks;
Introduce other indicators as FILTERS to avoid unsuitable market conditions;
Optimize position sizing and risk management rules.
Through rigorous testing and optimization, significant improvement can be achieved for this trading strategy.
Conclusion
The moving average pullback strategy is a very practical short-term trading strategy. It captures mean-reverting opportunities when prices pull back in the short run. The strategy idea is simple and easy to grasp. There are still risks that need addressing through optimization and risk control. Overall this is a promising quantitative strategy worthy of further research and application.
Parameters
| Name | Default | What it controls |
|---|---|---|
| v_input_1 | 2014 | Backtest Start Year |
| v_input_2 | true | Backtest Start Month |
| v_input_3 | 2 | Backtest Start Day |
| v_input_4 | 2035 | Backtest Stop Year |
| v_input_5 | 12 | Backtest Stop Month |
| v_input_6 | 30 | Backtest Stop Day |
| v_input_7 | 20 | leftBars |
| v_input_8 | 20 | rightBars |
Source Pine Script
/*backtest
start: 2022-12-12 00:00:00
end: 2023-12-18 00:00:00
period: 1d
basePeriod: 1h
exchanges: [{"eid":"Futures_Binance","currency":"BTC_USDT"}]
*/

//@version=2
strategy("MAC Pullback", overlay=true)

// Setting up timeperiod for testing
startPeriodYear = input(2014, "Backtest Start Year")
startPeriodMonth = input(1, "Backtest Start Month")
startPeriodDay = input(2, "Backtest Start Day")
testPeriodStart = timestamp(startPeriodYear, startPeriodMonth, startPeriodDay, 0, 0)

stopPeriodYear = input(2035, "Backtest Stop Year")
stopPeriodMonth = input(12, "Backtest Stop Month")
stopPeriodDay = input(30, "Backtest Stop Day")
testPeriodStop = timestamp(stopPeriodYear, stopPeriodMonth, stopPeriodDay, 0, 0)

// Moving Averages
ema14 = ema(close, 14)
ema28 = ema(close, 28)
sma56 = sma(close, 56)

// Plot
plot(ema14, title="ema14", linewidth=2, color=green)
plot(ema28, title="ema28", linewidth=2, color=red)
plot(sma56, title="sma56", linewidth=3, color=blue)


// Strategy
goLong = cross(ema14, sma56) and ema14 > ema28
goShort = cross(ema14, sma56) and ema14 < ema28


// Locate Swing Lows
leftBars = input(20)
rightBars=input(20)
swinglow = pivotlow(close, leftBars, rightBars)
plot(swinglow, style=cross, linewidth=8, color=#00FF00, offset=-rightBars)

if goLong == true and time >= testPeriodStart and time <= testPeriodStop
    // We try to make sure that we're catching the first Pullback after the crossover
    if ema14[12] < sma56[12]
        pivotpoint = lowest(40)[0] //lowest value of the month as our swing low

        // We calculate a Fib 1.272 extension (from the previous swing low to
        // the crossover long entry's open) and use this as our entry target to short the Pullback
        extensiontarget = ((close[1] - pivotpoint) * 1.27) + pivotpoint
        shorttarget = ((close[1] - pivotpoint) * 0.618) + pivotpoint

        strategy.order("Pullback", strategy.short, 5.0, limit=extensiontarget)
        // I would like to use a trailing stop but for know we just hope to get
        // filled if the pullback reaches all the way down to the 0.618.
        // We also place a tight stop loss since we trying to short an uptrend
        strategy.exit("Pullback Exit", "Pullback", limit=shorttarget, loss=400)
Published by ChaoZhang on the FMZ strategy square · last modified 2023-12-19. Collected in the Quant Trading Vault. Unvalidated research: re-test with your own data and costs before trusting it.
Build this with AgenKit
A spec is not a trading system. Paste this into your coding agent and AgenKit runs a specialist team — architecture, test-first build, risk gates, review — with paper trading on by default.
/agenkit build a production-grade trading bot with a backtest engine, risk controls and paper trading by default from strategies/Moving-Average-Pullback-Strategy.md- npx agenkit install engineering-kit in your project
- Paste the command into your agent and approve each phase
- Get tests, backtest, risk controls and a paper-trading switch
Understand it first
Before you run this, read the lesson behind the idea and how to backtest it honestly. Specs like this one are the survivors of an unknown number of trials; deflate their results accordingly.
Related specs
- Fibonacci Channel Based Candlestick Reversal Trading StrategyPine Script · Mean reversion · 1h
- Mean Reversion Trading Strategy Based on Bollinger Bands and Golden RatioPine Script · Mean reversion · 1h
- Multi Dimensional Pivot Point Trading System with Dynamic Fibonacci IndicatorsPine Script · Mean reversion · 1d
- Quant Bitcoin Trading Strategy Combining MACD RSI and FIBPine Script · Mean reversion · 10m
- Advanced Momentum EMA Trend Following with RSI Overbought Oversold Trading StrategyPine Script · Mean reversion · 1d
- Advanced Quantitative Trading Strategy Combining RSI Divergence and Moving AveragesPine Script · Mean reversion · 1h