Strategy vault / Mean reversion
MTDAT Multi Technical Indicator Dynamic Adaptive Trading Strategy MTDAT
This strategy is a comprehensive trading system based on multiple technical indicators, combining MACD, RSI, Bollinger Bands, and ATR to capture both trend and reversal opportunities. The strategy employs dynamic…
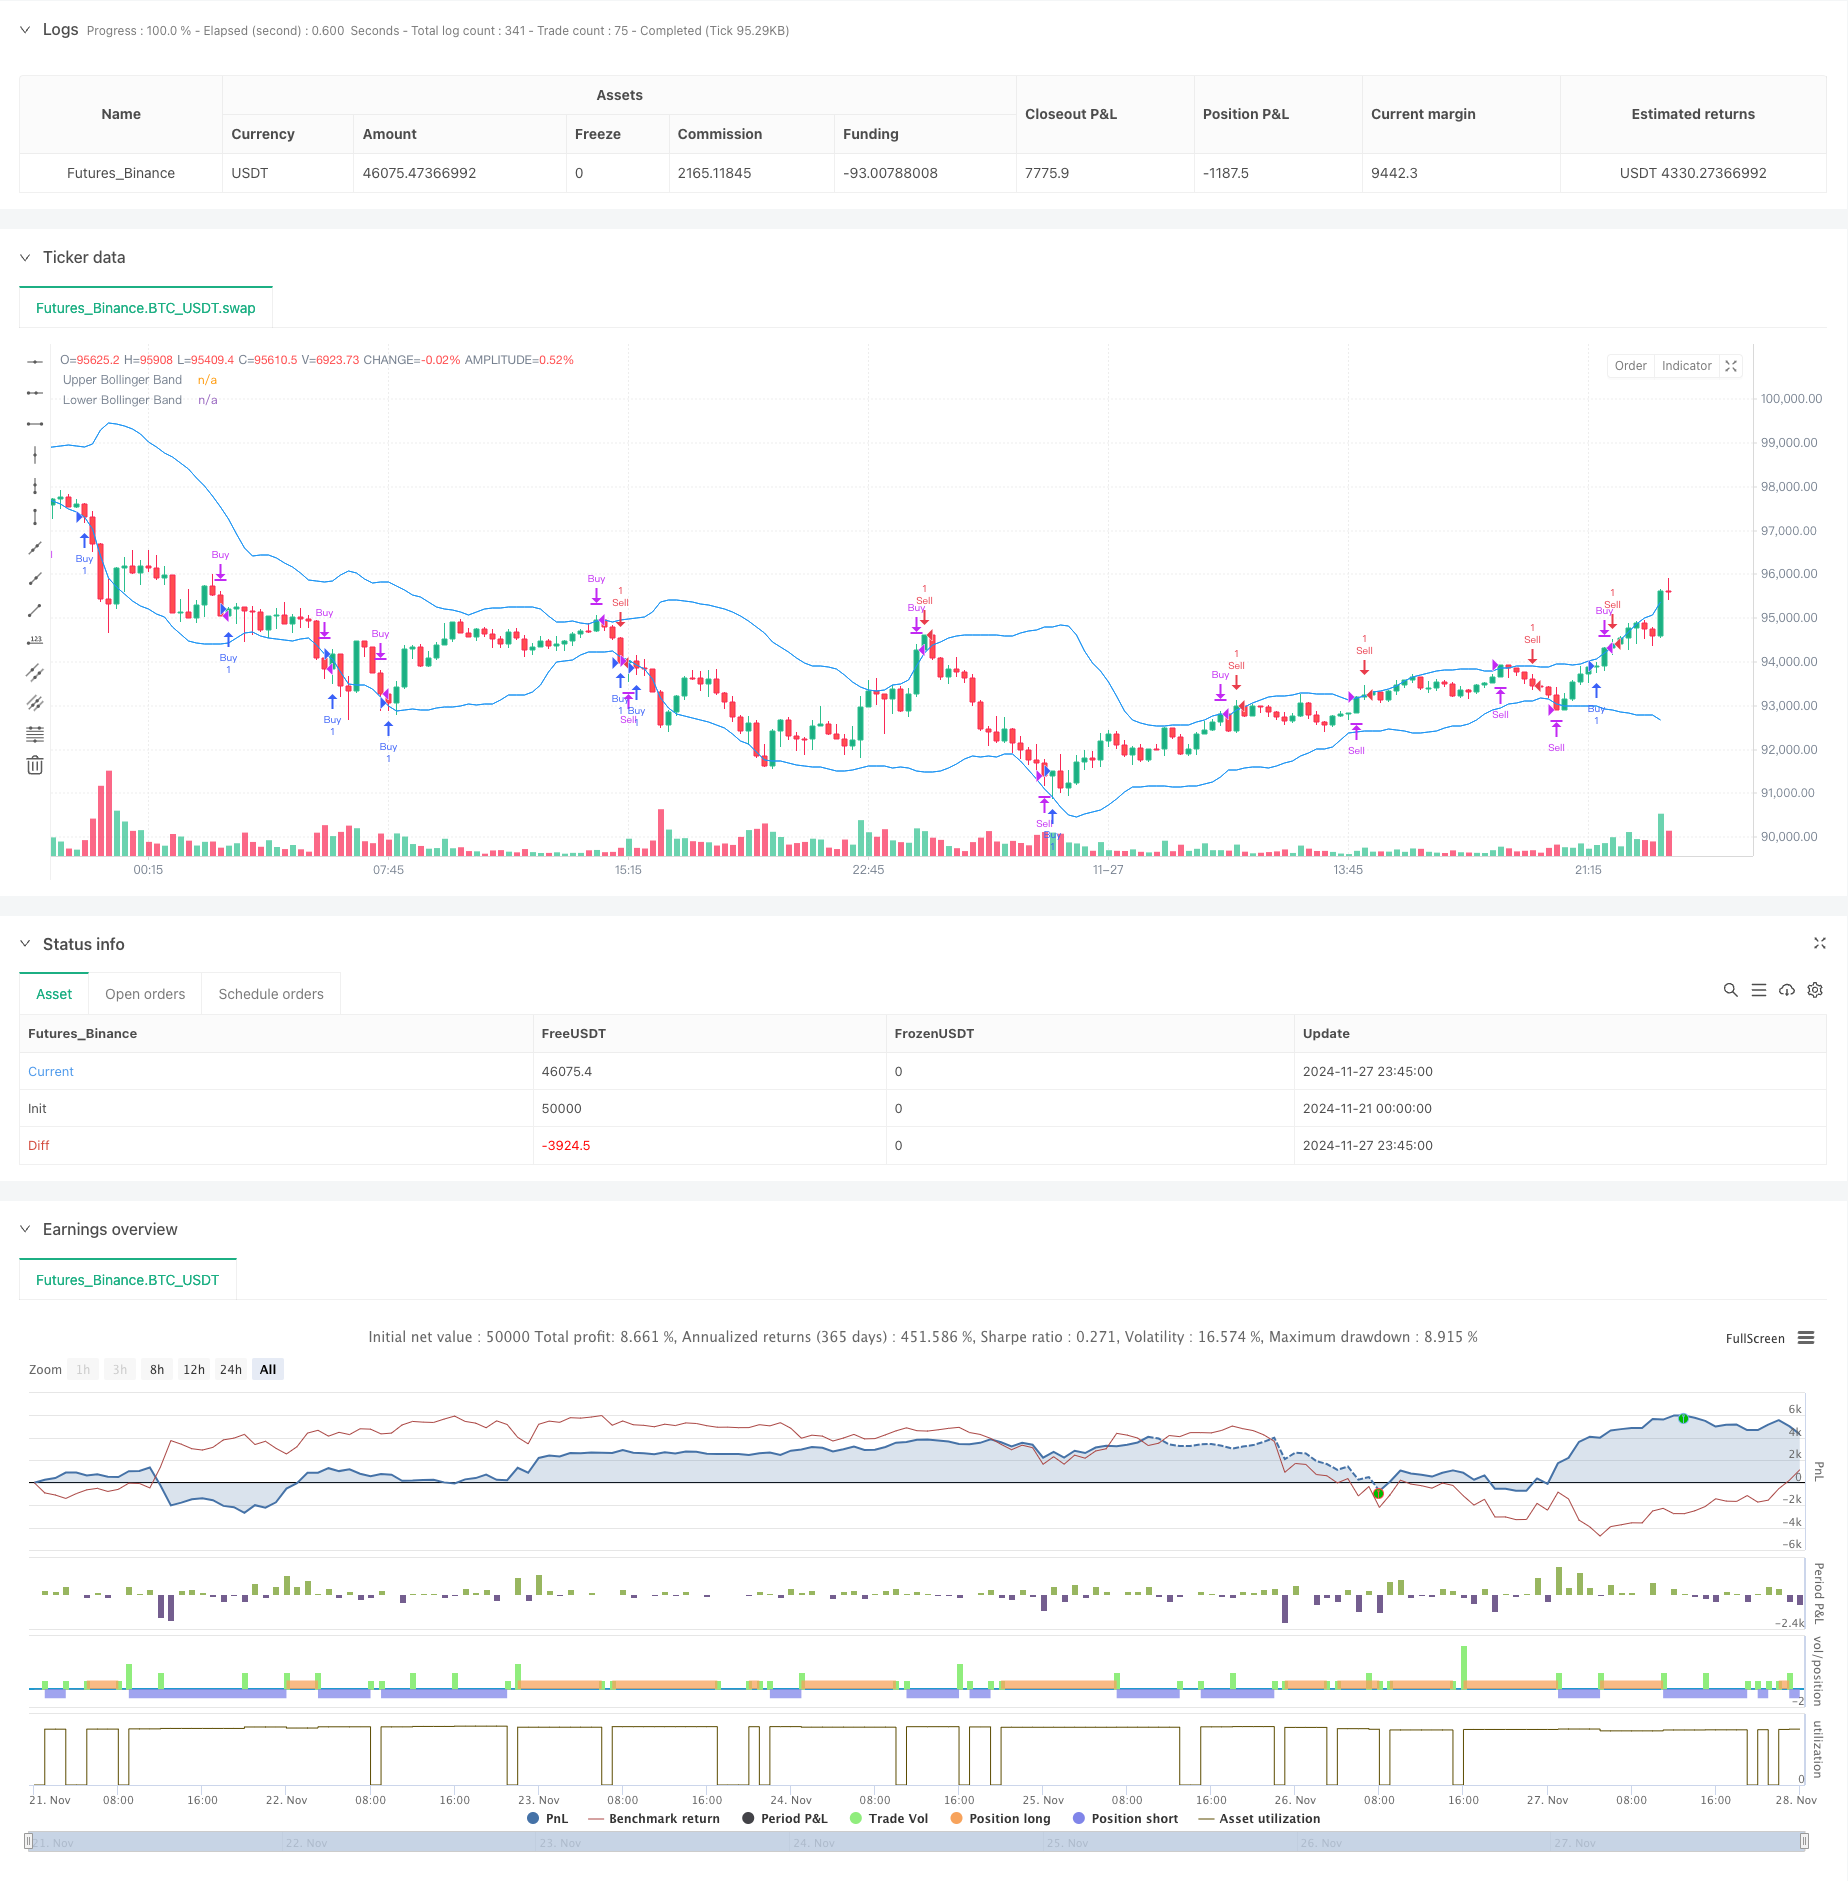
Overview
This strategy is a comprehensive trading system based on multiple technical indicators, combining MACD, RSI, Bollinger Bands, and ATR to capture both trend and reversal opportunities. The strategy employs dynamic stop-loss and profit-taking mechanisms, adapting trading parameters according to market volatility while effectively controlling risks. Backtesting results show a 676.27% return over the three-month testing period, demonstrating good market adaptability.
Strategy Principles
The strategy employs a multi-layer technical indicator validation system, including:
- MACD(12,26,9) for capturing momentum shift signals, generating buy signals when MACD line crosses above the signal line and sell signals when crossing below
- RSI(14) as a secondary filter, with readings below 35 considered oversold and above 65 overbought
- Bollinger Bands(20,2) for identifying price volatility ranges, considering buys at lower band touches and sells at upper band touches
- ATR for dynamic stop-loss and profit target setting, with stop-loss at 3x ATR and profit target at 5x ATR
The trading logic combines both trend-following and reversal trading strategies, improving accuracy through multiple validations. The system automatically adjusts stop-loss and profit levels based on real-time market volatility, optimizing risk management dynamically.
Strategy Advantages
- Multi-dimensional signal validation system improves trading reliability
- Dynamic stop-loss and profit-taking scheme adapts to different market conditions
- Combines trend and reversal trading approaches, increasing trading opportunities
- Automated risk management system reduces human judgment errors
- 53.99% win rate and 1.44 profit factor demonstrate strategy stability
- Strategy supports real-time trading alerts for convenient operation
Strategy Risks
- Multiple indicators may lead to signal lag, missing opportunities in fast markets
- 56.33% maximum drawdown requires significant risk tolerance
- Frequent trading may incur high transaction costs
- Strategy may face significant risks in highly volatile markets
Risk Control Recommendations:
- Strict implementation of money management plan
- Regular parameter review and adjustment
- Pause trading during major news releases
- Set daily maximum loss limits
Strategy Optimization Directions
Parameter Optimization:
- Consider using adaptive period indicator parameters
- Optimize ATR multiplier settings to improve risk-reward ratio
Signal System Improvements:
- Add volume indicator validation
- Incorporate market sentiment indicators
Risk Management Enhancement:
- Implement dynamic position sizing
- Add time-based filters
Technical Improvements:
- Add market volatility filters
- Optimize entry and exit timing
Summary
The strategy achieves good trading results through the combination of multiple technical indicators and dynamic risk management system. While there are drawdown risks, the strategy demonstrates good market adaptability and stability through strict risk control and continuous optimization. Traders are advised to strictly implement risk management protocols when using this strategy and adjust parameters according to market changes.
Source Pine Script
/*backtest
start: 2024-11-21 00:00:00
end: 2024-11-28 00:00:00
period: 15m
basePeriod: 15m
exchanges: [{"eid":"Futures_Binance","currency":"BTC_USDT"}]
*/

//@version=5
strategy("XAUUSD STRATEGY 10MIN", overlay=true)

// Spread Adjustment (38-point spread)
spread = 38 * syminfo.mintick

// MACD Calculation
[macdLine, signalLine, _] = ta.macd(close, 12, 26, 9)
macdBuy = ta.crossover(macdLine, signalLine)
macdSell = ta.crossunder(macdLine, signalLine)

// RSI Calculation
rsi = ta.rsi(close, 14)
rsiOverbought = rsi > 65
rsiOversold = rsi < 35

// Bollinger Bands Calculation
basis = ta.sma(close, 20)
dev = 2 * ta.stdev(close, 20)
upperBand = basis + dev
lowerBand = basis - dev

// ATR Calculation for Volatility-Based Stop Loss and Take Profit
atr = ta.atr(14)
stopLoss = 3 * atr
takeProfit = 5 * atr

// Variables to track entry price and line
var line entryLine = na
var int tradeNumber = 0
var string tradeType = ""
var string tradeSignalComment = ""

// Buy Condition
buyCondition = (macdBuy or rsiOversold or close < lowerBand)

// Sell Condition
sellCondition = (macdSell or rsiOverbought or close > upperBand)

// Strategy Entry and Alerts
if (buyCondition and strategy.opentrades == 0)  // Open a new buy trade
    // Remove the previous entry line if it exists
    // if not na(entryLine)
    //     line.delete(entryLine)

    // Adjust the entry price by adding the spread (ask price)
    buyPrice = close + spread

    // Enter a new buy trade at the ask price, and close it with the bid price
    strategy.entry("Buy", strategy.long, stop=buyPrice - stopLoss, limit=buyPrice + takeProfit, comment="Enter buy $" + str.tostring(buyPrice))
    tradeNumber := tradeNumber + 1  // Increment trade number
    tradeType := "Entry Long"
    tradeSignalComment := "Enter buy trade"

    // Plot new dotted entry line for the current trade
    // entryLine := line.new(bar_index, buyPrice, bar_index + 50, buyPrice, width=1, color=color.green, style=line.style_dotted)

    // Send alert for the buy entry
    alert("Trade No: " + str.tostring(tradeNumber) + "\n" +
          "Signal: " + tradeType + " - " + tradeSignalComment + "\n" +
          "Date/Time: " + str.format("{0,date,dd-MM-yyyy HH:mm}", time) + "\n" +
          "Price: " + str.tostring(buyPrice), alert.freq_once_per_bar_close)

if (sellCondition and strategy.opentrades == 0)  // Open a new sell trade
    // Remove the previous entry line if it exists
    // if not na(entryLine)
    //     line.delete(entryLine)

    // Adjust the entry price by subtracting the spread (bid price)
    sellPrice = close - spread

    // Enter a new sell trade at the bid price, and close it with the ask price
    strategy.entry("Sell", strategy.short, stop=sellPrice + stopLoss, limit=sellPrice - takeProfit, comment="Enter sell $" + str.tostring(sellPrice))
    tradeNumber := tradeNumber + 1  // Increment trade number
    tradeType := "Entry Short"
    tradeSignalComment := "Enter sell trade"

    // Plot new dotted entry line for the current trade
    // entryLine := line.new(bar_index, sellPrice, bar_index + 50, sellPrice, width=1, color=color.red, style=line.style_dotted)

    // Send alert for the sell entry
    alert("Trade No: " + str.tostring(tradeNumber) + "\n" +
          "Signal: " + tradeType + " - " + tradeSignalComment + "\n" +
          "Date/Time: " + str.format("{0,date,dd-MM-yyyy HH:mm}", time) + "\n" +
          "Price: " + str.tostring(sellPrice), alert.freq_once_per_bar_close)

// Exit conditions and alerts
if (strategy.position_size > 0 and sellCondition)  // Close buy when sell conditions met
    // Adjust the exit price by subtracting the spread (bid price)
    exitPrice = close - spread
    strategy.close("Buy", comment="Exit buy $" + str.tostring(exitPrice))

    // Remove the entry line when the trade is closed
    // if not na(entryLine)
    //     line.delete(entryLine)

    // Send alert for the buy exit
    tradeType := "Exit Long"
    tradeSignalComment := "Exit buy trade"
    alert("Trade No: " + str.tostring(tradeNumber) + "\n" +
          "Signal: " + tradeType + " - "  + tradeSignalComment + "\n" +
          "Date/Time: " + str.format("{0,date,dd-MM-yyyy HH:mm}", time) + "\n" +
          "Price: " + str.tostring(exitPrice), alert.freq_once_per_bar_close)

if (strategy.position_size < 0 and buyCondition)  // Close sell when buy conditions met
    // Adjust the exit price by adding the spread (ask price)
    exitPrice = close + spread
    strategy.close("Sell", comment="Exit sell $" + str.tostring(exitPrice))

    // Remove the entry line when the trade is closed
    // if not na(entryLine)
    //     line.delete(entryLine)

    // Send alert for the sell exit
    tradeType := "Exit Short"
    tradeSignalComment := "Exit sell trade"
    alert("Trade No: " + str.tostring(tradeNumber) + "\n" +
          "Signal: " + tradeType + " - " + tradeSignalComment + "\n" +
          "Date/Time: " + str.format("{0,date,dd-MM-yyyy HH:mm}", time) + "\n" +
          "Price: " + str.tostring(exitPrice), alert.freq_once_per_bar_close)

// Plot Indicators
plot(upperBand, title="Upper Bollinger Band", color=color.blue)
plot(lowerBand, title="Lower Bollinger Band", color=color.blue)
Published by ChaoZhang on the FMZ strategy square · last modified 2024-11-29. Collected in the Quant Trading Vault. Unvalidated research: re-test with your own data and costs before trusting it.
Build this with AgenKit
A spec is not a trading system. Paste this into your coding agent and AgenKit runs a specialist team — architecture, test-first build, risk gates, review — with paper trading on by default.
/agenkit build a production-grade trading bot with a backtest engine, risk controls and paper trading by default from strategies/MTDAT-Multi-Technical-Indicator-Dynamic-Adaptive-Trading-Strategy-MTDAT.md- npx agenkit install engineering-kit in your project
- Paste the command into your agent and approve each phase
- Get tests, backtest, risk controls and a paper-trading switch
Understand it first
Before you run this, read the lesson behind the idea and how to backtest it honestly. Specs like this one are the survivors of an unknown number of trials; deflate their results accordingly.
Related specs
- CCTBBO Reversal Tracking StrategyPine Script · Mean reversion · 45m
- Multi Timeframe Gold Reversal Tracking StrategyPine Script · Mean reversion · 2h
- MACD RSI and EMA StrategyPine Script · Mean reversion · 1d
- A Multi Period Trading Strategy Based on Moving AveragesPine Script · Mean reversion · 1h
- Advanced 15 Minute Chart Trading Signal StrategyPine Script · Mean reversion · 3h
- Customizable Non Repainting HTF MACD MFI Scalable Bot StrategyPine Script · Mean reversion · 1d