Strategy vault / Trend following
Multi Dimensional Dynamic ICT Trading Strategy with Engulfing Patterns and Supply Demand Zone Analysis System
This strategy is a comprehensive trading system that combines ICT (Internal Trader Concepts), engulfing patterns, and supply-demand zone analysis. It identifies high-probability trading opportunities through…
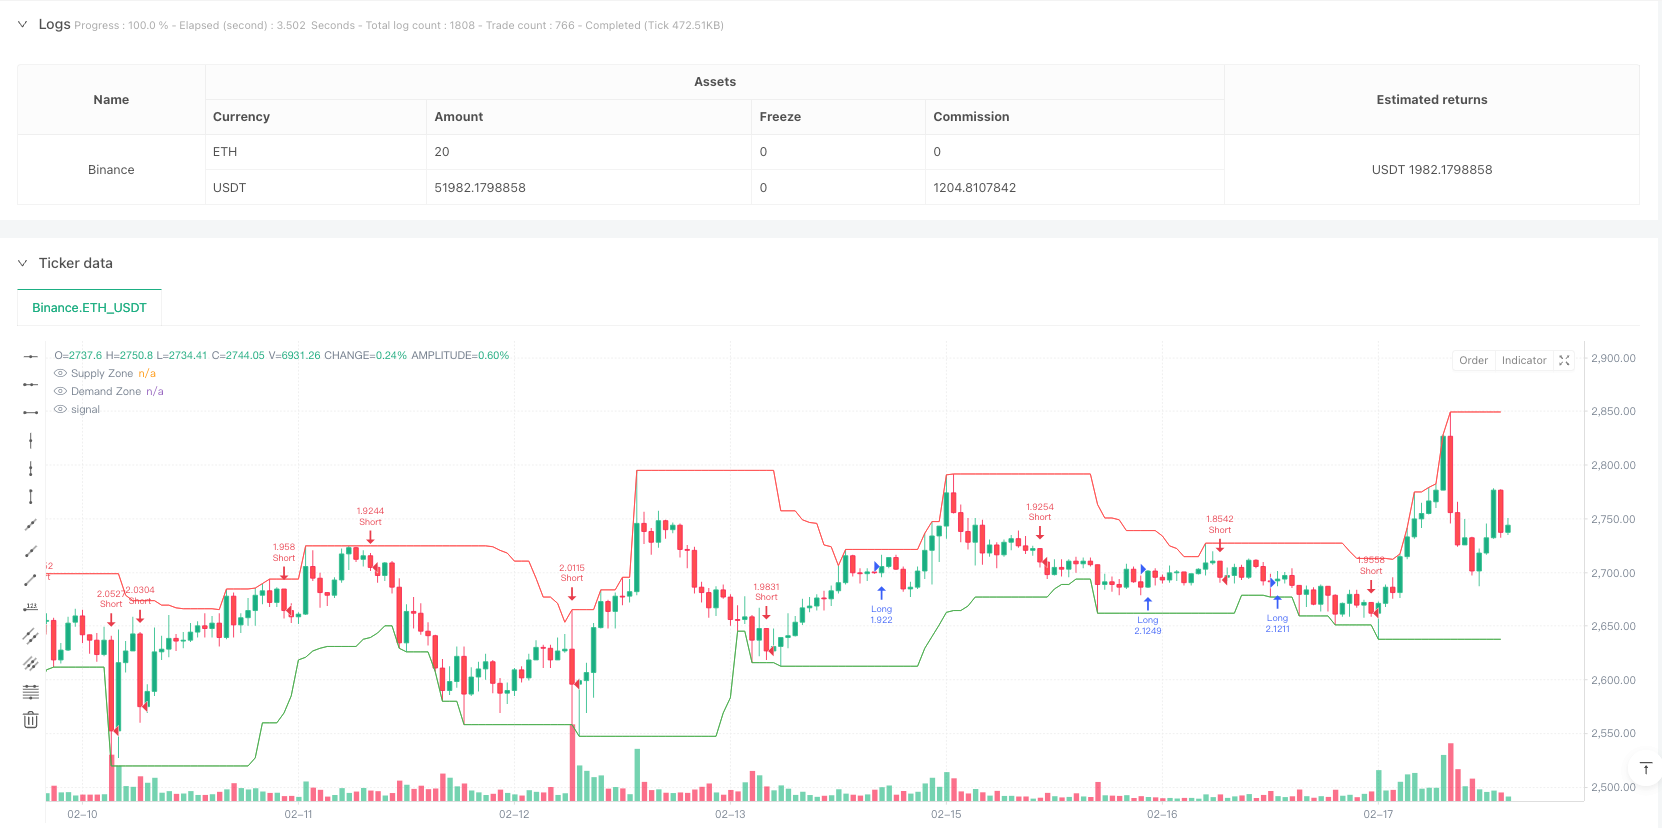
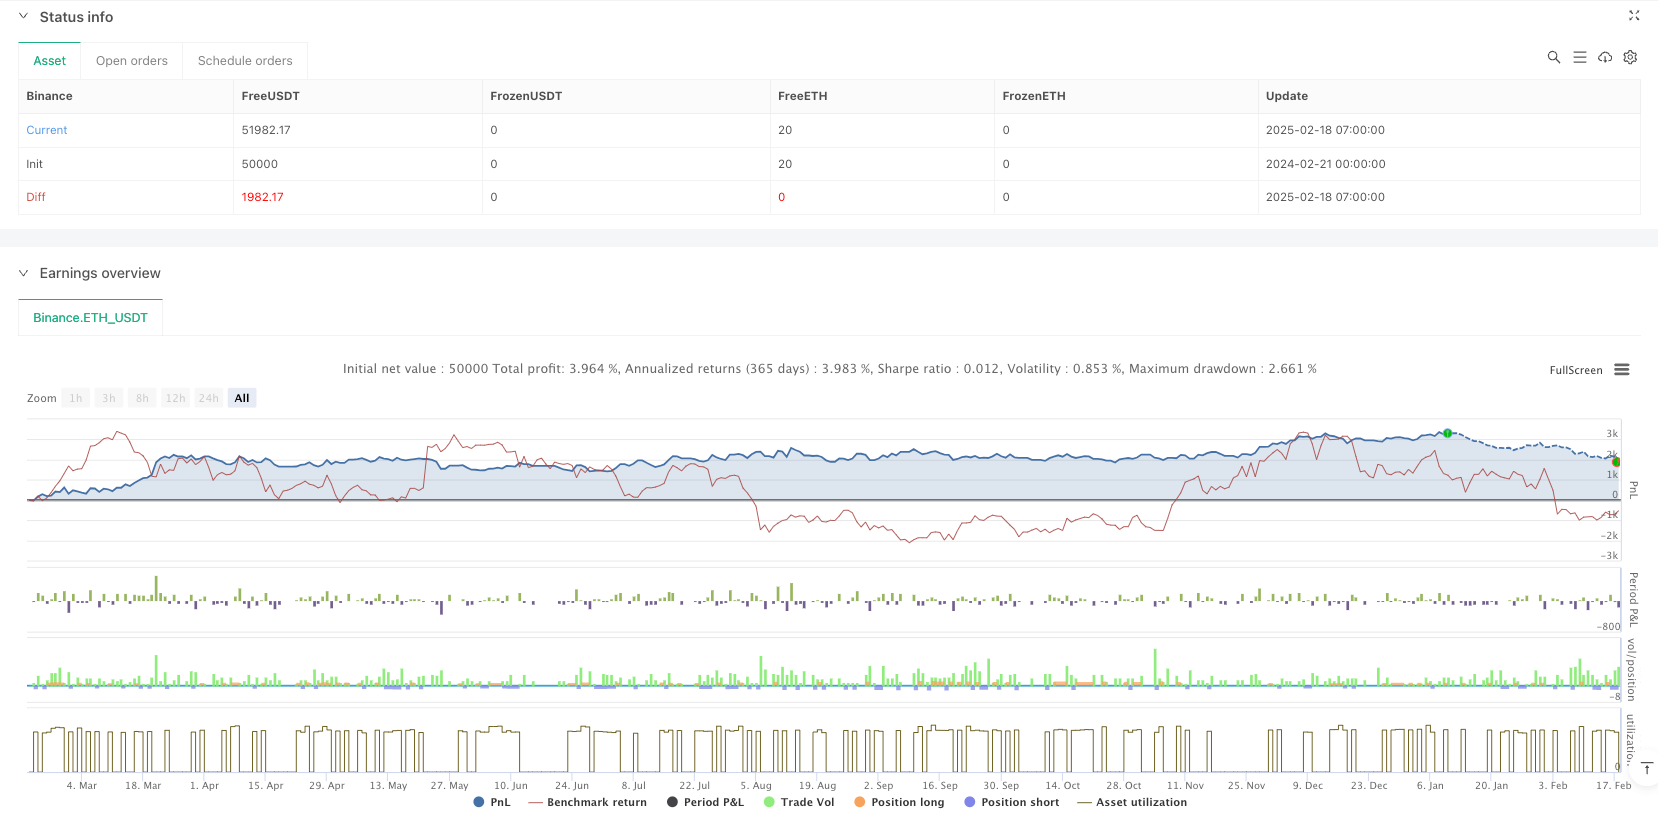
Overview
This strategy is a comprehensive trading system that combines ICT (Internal Trader Concepts), engulfing patterns, and supply-demand zone analysis. It identifies high-probability trading opportunities through multi-dimensional market structure analysis, integrating technical indicators and price action. The strategy operates on a 15-minute timeframe and uses percentage-based stop-loss and take-profit levels for risk management.
Strategy Principles
The core logic is based on three main components:
- Establishing supply and demand zones using 20-period high and low prices, which serve as significant support and resistance levels.
- Identifying bullish and bearish engulfing patterns by analyzing the relationship between adjacent candles.
- Executing trades when price breaks through supply/demand zones and engulfing patterns appear, with consideration for risk management.
The system uses 10% of equity for each trade, with a 1.5% stop-loss and 3% take-profit, providing a 2:1 risk-reward ratio.
Strategy Advantages
- Multi-dimensional analysis improves signal reliability
- Combination of price action and technical analysis reduces false signals
- Percentage-based stop-loss and take-profit adapt to different market conditions
- Reasonable money management system using 10% equity per trade reduces risk
- Parameters can be adjusted to adapt to different market environments
Strategy Risks
- May trigger frequent stop-losses in highly volatile markets
- Supply and demand zone identification might be inaccurate in certain market conditions
- 15-minute timeframe might generate too many trading signals
- Fixed percentage stop-loss and take-profit might not suit all market conditions
Risk Control Suggestions:
- Adjust parameters under different market conditions
- Consider adding confirmation indicators
- Dynamic adjustment of stop-loss and take-profit levels based on volatility
Strategy Optimization Directions
- Introduce volatility indicators for dynamic stop-loss and take-profit adjustment
- Add volume analysis to confirm signal strength
- Consider adding trend filters to reduce counter-trend trades
- Optimize supply and demand zone identification algorithm, possibly using multiple timeframe analysis
- Add market state recognition functionality to use different parameter sets under different market conditions
Summary
This is a well-structured comprehensive trading system that provides reliable trading signals through multi-dimensional analysis. The system's risk management is reasonable but has room for optimization. Traders are advised to thoroughly backtest before live trading and adjust parameters according to specific market conditions. The strategy's modular design provides good scalability, allowing for the addition of new analysis dimensions as needed.
Source Pine Script
/*backtest
start: 2024-02-21 00:00:00
end: 2025-02-18 08:00:00
period: 1h
basePeriod: 1h
exchanges: [{"eid":"Binance","currency":"ETH_USDT"}]
*/

//@version=5
strategy("ICT + Engulfing + Supply & Demand", overlay=true, default_qty_type=strategy.percent_of_equity, default_qty_value=10)

// Input settings
timeframe = input.timeframe("15", title="Backtest Timeframe")
use_snd = input(true, title="Enable Supply & Demand Zones")
stopLossPerc = input(1.5, title="Stop Loss %")
takeProfitPerc = input(3, title="Take Profit %")

// Identify Engulfing Patterns
bullishEngulfing = (close[1] < open[1]) and (close > open) and (close > open[1]) and (open < close[1])
bearishEngulfing = (close[1] > open[1]) and (close < open) and (close < open[1]) and (open > close[1])

// Supply & Demand Zones (basic identification)
highestHigh = ta.highest(high, 20)
lowestLow = ta.lowest(low, 20)
supplyZone = use_snd ? highestHigh : na
demandZone = use_snd ? lowestLow : na

// Entry & Exit Conditions
longCondition = bullishEngulfing and close > demandZone
shortCondition = bearishEngulfing and close < supplyZone

// Stop-Loss & Take-Profit Calculation
longSL = close * (1 - stopLossPerc / 100)
longTP = close * (1 + takeProfitPerc / 100)
shortSL = close * (1 + stopLossPerc / 100)
shortTP = close * (1 - takeProfitPerc / 100)

// Execute trades
if (longCondition)
    strategy.entry("Long", strategy.long)
    strategy.exit("Long Exit", from_entry="Long", stop=longSL, limit=longTP)

if (shortCondition)
    strategy.entry("Short", strategy.short)
    strategy.exit("Short Exit", from_entry="Short", stop=shortSL, limit=shortTP)

// Plot Supply & Demand Zones
plot(use_snd ? supplyZone : na, color=color.red, title="Supply Zone")
plot(use_snd ? demandZone : na, color=color.green, title="Demand Zone")
Published by ianzeng123 on the FMZ strategy square · last modified 2025-02-20. Collected in the Quant Trading Vault. Unvalidated research: re-test with your own data and costs before trusting it.
Build this with AgenKit
A spec is not a trading system. Paste this into your coding agent and AgenKit runs a specialist team — architecture, test-first build, risk gates, review — with paper trading on by default.
/agenkit build a production-grade trading bot with a backtest engine, risk controls and paper trading by default from strategies/Multi-Dimensional-Dynamic-ICT-Trading-Strategy-with-Engulfing-Patterns-and-Supply-Demand-Zone-Analysis-System.md- npx agenkit install engineering-kit in your project
- Paste the command into your agent and approve each phase
- Get tests, backtest, risk controls and a paper-trading switch
Understand it first
Before you run this, read the lesson behind the idea and how to backtest it honestly. Specs like this one are the survivors of an unknown number of trials; deflate their results accordingly.
Related specs
- Adaptive Bollinger Bands Trend Tracking StrategyPine Script · Trend following · 1h
- Automated Fibonacci Retracement Trading System StrategyPine Script · Trend following · 1d
- Bollinger Bands Precise Crossover Quantitative StrategyPine Script · Trend following · 1h
- Comprehensive Trading System Combining SMA Crossover Strategy with Fair Value Gap PullbackPine Script · Trend following · 1d
- Dual EMA Crossover StrategyPine Script · Trend following · 1d
- Dual Hull Moving Average Trading StrategyPine Script · Trend following · 1d