Multi Dimensional Integration Trading Strategy Based on Nadaraya Watson
This strategy is a multi-dimensional trading system based on Nadaraya-Watson kernel regression, which integrates market information from technical, emotional, extrasensory, and intentional dimensions to form…
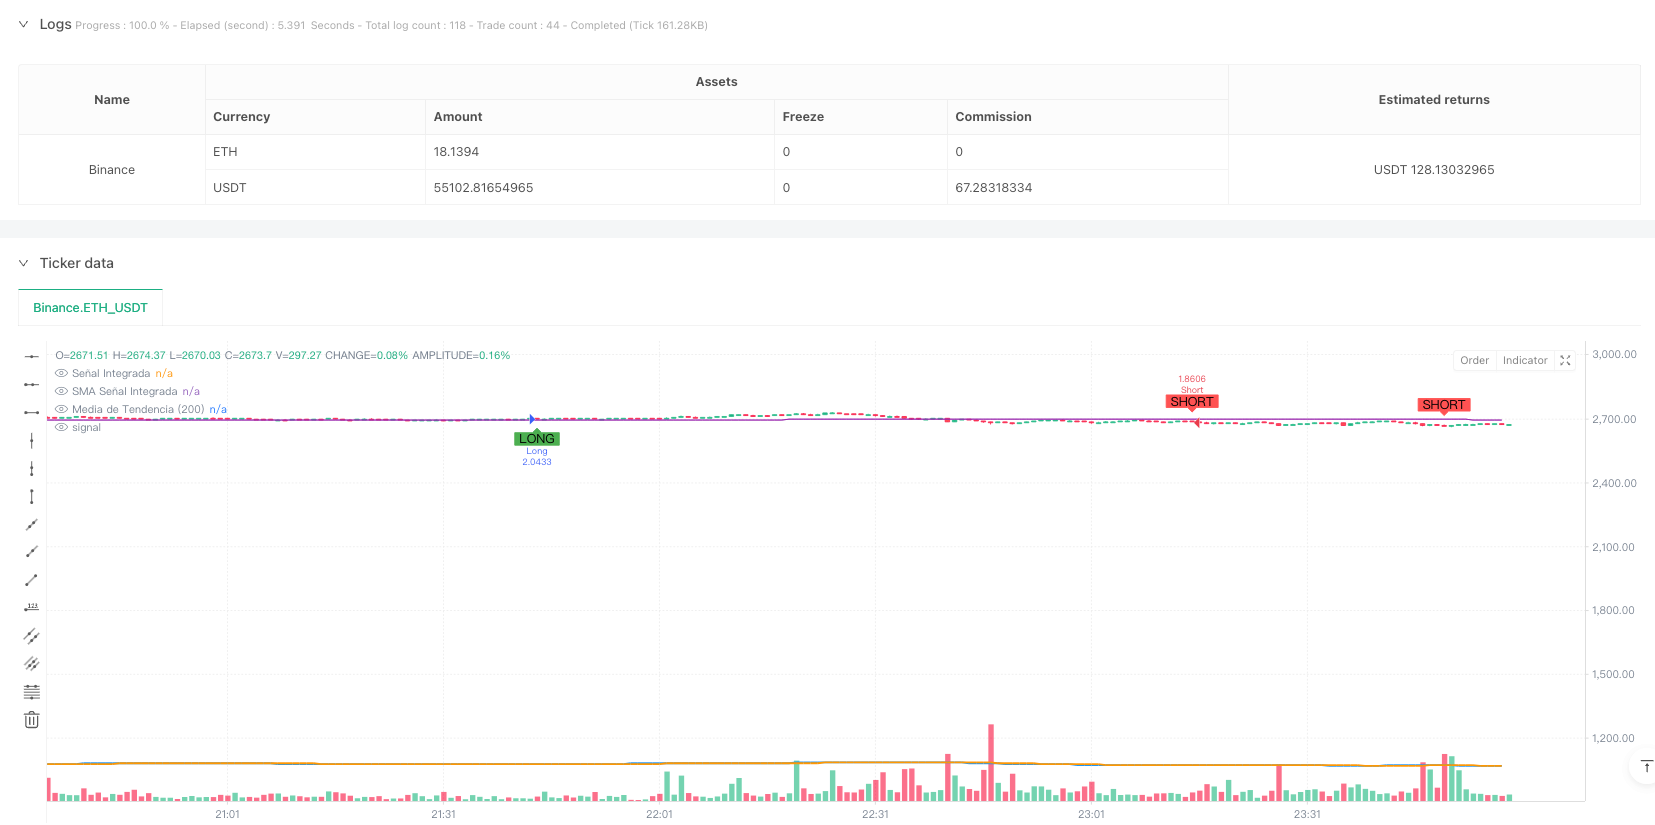
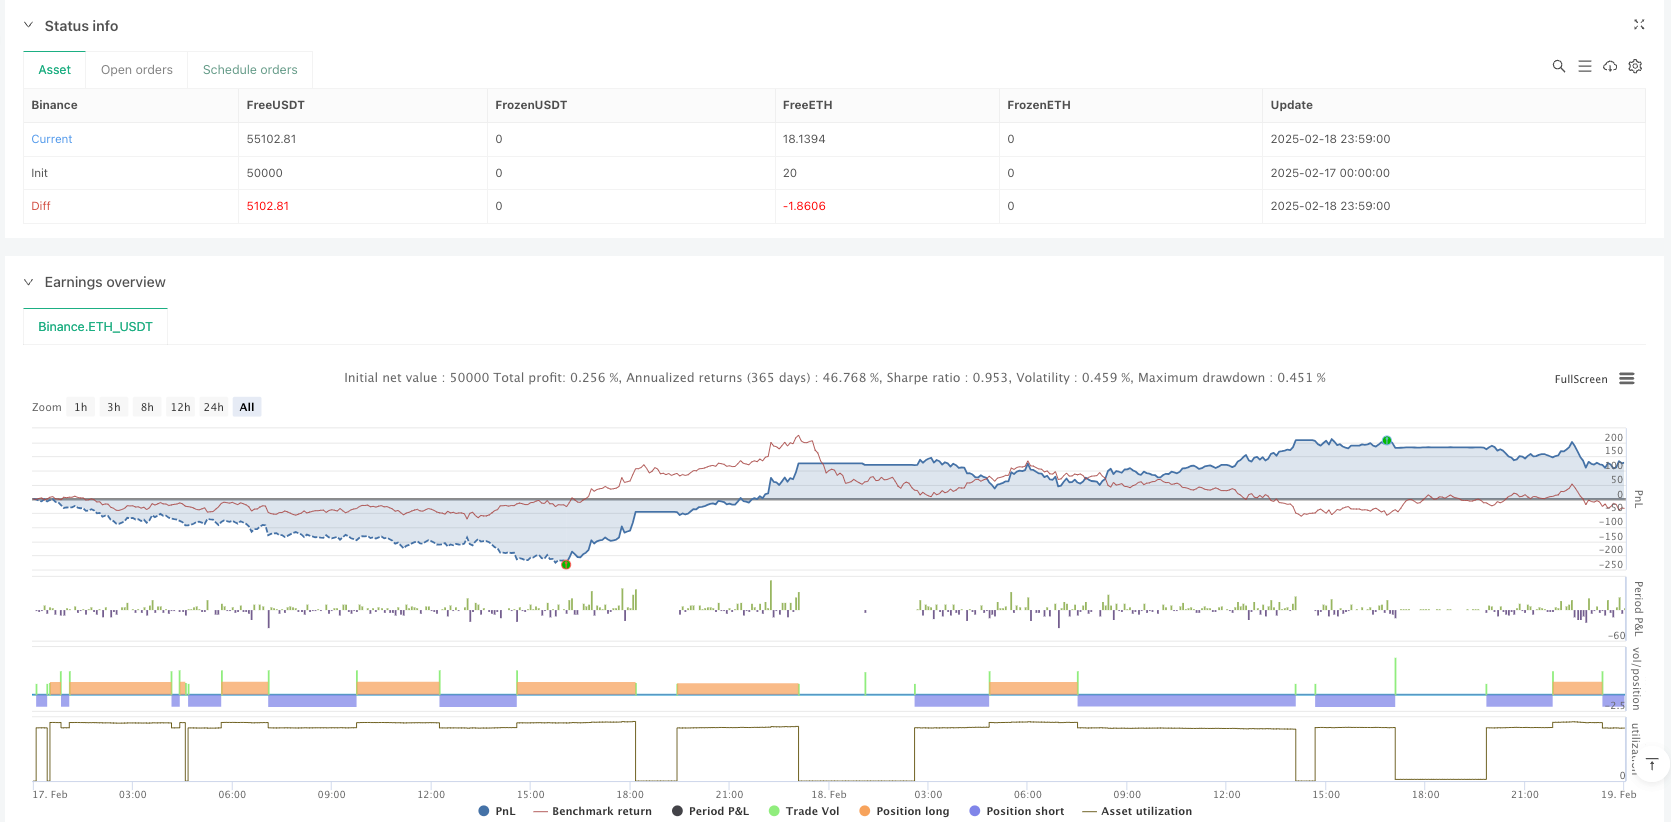
Overview
This strategy is a multi-dimensional trading system based on Nadaraya-Watson kernel regression, which integrates market information from technical, emotional, extrasensory, and intentional dimensions to form comprehensive signals for trading decisions. The strategy employs weight optimization methods, applies weighted processing to signals from different dimensions, and combines trend and momentum filters to improve signal quality. The system also includes a complete risk management module to protect capital through stop-loss and take-profit mechanisms.
Strategy Principles
The core of the strategy lies in using Nadaraya-Watson kernel regression to smooth multi-dimensional market data. Specifically:
- Technical dimension uses closing price
- Emotional dimension uses RSI indicator
- Extrasensory dimension uses ATR volatility
- Intentional dimension uses price deviation from moving average These dimensions are smoothed through kernel regression and then integrated using preset weights (Technical 0.4, Emotional 0.2, Extrasensory 0.2, Intentional 0.2) to form the final trading signal. Trading orders are issued when the integrated signal crosses its moving average, confirmed by trend and momentum filters.
Strategy Advantages
- Multi-dimensional analysis provides a more comprehensive market perspective, avoiding limitations of single indicators
- Nadaraya-Watson kernel regression effectively reduces market noise, providing smoother signals
- Weight optimization mechanism allows adjustment of dimensional importance based on market characteristics
- Addition of trend and momentum filters significantly improves signal quality
- Comprehensive risk management system ensures capital safety
Strategy Risks
- Parameter optimization may lead to overfitting
- Multiple filtering conditions might miss some valid signals
- Kernel regression has high computational complexity, potentially affecting real-time performance
- Improper weight distribution may weaken important market signals Mitigation measures include: using out-of-sample testing for parameter validation, dynamically adjusting filter conditions, optimizing computational efficiency, and periodically evaluating and adjusting weight distribution.
Strategy Optimization Directions
- Introduce adaptive weight system to dynamically adjust dimensional weights based on market conditions
- Develop smarter filtering mechanisms to balance signal quality and quantity
- Optimize Nadaraya-Watson algorithm implementation to improve computational efficiency
- Add market cycle recognition module to use different parameter settings in different market phases
- Expand risk management system to include dynamic stop-loss and position management functions
Summary
This is an innovative strategy combining mathematical methods with trading wisdom. Through multi-dimensional analysis and advanced mathematical tools, the strategy can capture multiple aspects of the market, providing relatively reliable trading signals. While there is room for optimization, the overall framework of the strategy is robust and has practical application value.
Source Pine Script
/*backtest
start: 2025-02-17 00:00:00
end: 2025-02-19 00:00:00
period: 1m
basePeriod: 1m
exchanges: [{"eid":"Binance","currency":"ETH_USDT"}]
*/

//@version=5
strategy("Enhanced Multidimensional Integration Strategy with Nadaraya", overlay=true, initial_capital=10000, currency=currency.USD, default_qty_type=strategy.percent_of_equity, default_qty_value=10)

//────────────────────────────────────────────────────────────────────────────
// 1. Configuration and Weight Optimization Parameters
//────────────────────────────────────────────────────────────────────────────
// Weights can be optimized to favor dimensions with higher historical correlation.
// Base values are maintained but can be fine-tuned.
w_technical   = input.float(0.4,   "Technical Weight",        step=0.05)
w_emotional   = input.float(0.2,   "Emotional Weight",      step=0.05)
w_extrasensor = input.float(0.2,   "Extrasensory Weight", step=0.05)
w_intentional = input.float(0.2,   "Intentional Weight",    step=0.05)

// Parameters for Nadaraya-Watson Smoothing Function:
// Smoothing period and bandwidth affect the "memory" and sensitivity of the signal.
smooth_length = input.int(20, "Smoothing Period", minval=5)
bw_param      = input.float(20, "Bandwidth", minval=1, step=1)

//────────────────────────────────────────────────────────────────────────────
// 2. Risk Management Parameters
//────────────────────────────────────────────────────────────────────────────
// Incorporate stop-loss and take-profit in percentage to protect capital.
// These parameters can be optimized through historical testing.
stopLossPerc   = input.float(1.5, "Stop Loss (%)", step=0.1) / 100   // 1.5% stop-loss
takeProfitPerc = input.float(3.0, "Take Profit (%)", step=0.1) / 100   // 3.0% take-profit

//────────────────────────────────────────────────────────────────────────────
// 3. Additional Filters (Trend and Momentum)
//────────────────────────────────────────────────────────────────────────────
// A long-term moving average is used to confirm the overall trend direction.
trend_length = input.int(200, "Trend MA Period", minval=50)
// RSI is used to confirm momentum. A level of 50 is common to distinguish bullish and bearish phases.
rsi_filter_level = input.int(50, "RSI Confirmation Level", minval=30, maxval=70)

//────────────────────────────────────────────────────────────────────────────
// 4. Definition of Dimensions
//────────────────────────────────────────────────────────────────────────────
tech_series         = close
emotional_series    = ta.rsi(close, 14) / 100
extrasensorial_series = ta.atr(14) / close
intentional_series  = (close - ta.sma(close, 50)) / close

//────────────────────────────────────────────────────────────────────────────
// 5. Nadaraya-Watson Smoothing Function
//────────────────────────────────────────────────────────────────────────────
// This function smooths each dimension using a Gaussian kernel.
// Proper smoothing reduces noise and helps obtain a more robust signal.
nadaraya_smooth(_src, _len, _bw) =>
    if bar_index < _len
        na
    else
        float sumW  = 0.0
        float sumWY = 0.0
        for i = 0 to _len - 1
            weight = math.exp(-0.5 * math.pow(((_len - 1 - i) / _bw), 2))
            sumW  := sumW + weight
            sumWY := sumWY + weight * _src[i]
        sumWY / sumW

//────────────────────────────────────────────────────────────────────────────
// 6. Apply Smoothing to Each Dimension
//────────────────────────────────────────────────────────────────────────────
sm_tech        = nadaraya_smooth(tech_series, smooth_length, bw_param)
sm_emotional   = nadaraya_smooth(emotional_series, smooth_length, bw_param)
sm_extrasens   = nadaraya_smooth(extrasensorial_series, smooth_length, bw_param)
sm_intentional = nadaraya_smooth(intentional_series, smooth_length, bw_param)

//────────────────────────────────────────────────────────────────────────────
// 7. Integration of Dimensions
//────────────────────────────────────────────────────────────────────────────
// The integrated signal is composed of the weighted sum of each smoothed dimension.
// This multidimensional approach seeks to capture different aspects of market behavior.
integrated_signal = (w_technical * sm_tech) + (w_emotional * sm_emotional) + (w_extrasensor * sm_extrasens) + (w_intentional * sm_intentional)
// Additional smoothing of the integrated signal to obtain a reference line.
sma_integrated = ta.sma(integrated_signal, 10)

//────────────────────────────────────────────────────────────────────────────
// 8. Additional Filters to Improve Accuracy and Win Rate
//────────────────────────────────────────────────────────────────────────────
// Trend filter: only trade in the direction of the overall trend, determined by a 200-period SMA.
trendMA = ta.sma(close, trend_length)
// Momentum filter: RSI is used to confirm the strength of the movement (RSI > 50 for long and RSI < 50 for short).
rsi_val = ta.rsi(close, 14)

longFilter  = (close > trendMA) and (rsi_val > rsi_filter_level)
shortFilter = (close < trendMA) and (rsi_val < rsi_filter_level)

// Crossover signals of the integrated signal with its SMA reference.
rawLongSignal  = ta.crossover(integrated_signal, sma_integrated)
rawShortSignal = ta.crossunder(integrated_signal, sma_integrated)
// Incorporate trend and momentum filters to filter false signals.
longSignal  = rawLongSignal and longFilter
shortSignal = rawShortSignal and shortFilter

//────────────────────────────────────────────────────────────────────────────
// 9. Risk Management and Order Generation
//────────────────────────────────────────────────────────────────────────────
// Entries are made based on the filtered integrated signal.
if longSignal
    strategy.entry("Long", strategy.long, comment="Long Entry")
if shortSignal
    strategy.entry("Short", strategy.short, comment="Short Entry")

// Add automatic exits using stop-loss and take-profit to limit losses and secure profits.
// For long positions: stop-loss below entry price and take-profit above.
if strategy.position_size > 0
    strategy.exit("Exit Long", "Long", stop = strategy.position_avg_price * (1 - stopLossPerc), limit = strategy.position_avg_price * (1 + takeProfitPerc))
// For short positions: stop-loss above entry price and take-profit below.
if strategy.position_size < 0
    strategy.exit("Exit Short", "Short", stop = strategy.position_avg_price * (1 + stopLossPerc), limit = strategy.position_avg_price * (1 - takeProfitPerc))

//────────────────────────────────────────────────────────────────────────────
// 10. Visualization on the Chart
//────────────────────────────────────────────────────────────────────────────
plot(integrated_signal, color=color.blue, title="Integrated Signal", linewidth=2)
plot(sma_integrated,      color=color.orange, title="SMA Integrated Signal", linewidth=2)
plot(trendMA,           color=color.purple, title="Trend MA (200)", linewidth=1, style=plot.style_line)
plotshape(longSignal,  title="Long Signal",  location=location.belowbar, color=color.green, style=shape.labelup,   text="LONG")
plotshape(shortSignal, title="Short Signal",  location=location.abovebar, color=color.red,   style=shape.labeldown, text="SHORT")
Published by ianzeng123 on the FMZ strategy square · last modified 2025-02-27. Collected in the Quant Trading Vault. Unvalidated research: re-test with your own data and costs before trusting it.
Build this with AgenKit
A spec is not a trading system. Paste this into your coding agent and AgenKit runs a specialist team — architecture, test-first build, risk gates, review — with paper trading on by default.
/agenkit build a production-grade trading bot with a backtest engine, risk controls and paper trading by default from strategies/Multi-Dimensional-Integration-Trading-Strategy-Based-on-Nadaraya-Watson.md- npx agenkit install engineering-kit in your project
- Paste the command into your agent and approve each phase
- Get tests, backtest, risk controls and a paper-trading switch
Understand it first
Before you run this, read the lesson behind the idea and how to backtest it honestly. Specs like this one are the survivors of an unknown number of trials; deflate their results accordingly.
Related specs
- KST EMA Momentum Trend Following StrategyPine Script · Momentum · 1d
- Multi EMA Trend Momentum Trading Strategy with Risk Management SystemPine Script · Momentum · 1h
- Multi Indicator Trend Momentum Trading Strategy with Dynamic Risk Management SystemPine Script · Momentum · 1h
- Dual SMA Momentum StrategyPine Script · Momentum · 1d
- Multi Indicator Dynamic Momentum Cross StrategyPine Script · Momentum · 1d
- Multi Indicator Trend Momentum Trading Strategy An Optimized Quantitative Trading System Based on Bollinger Bands Fibonacci and ATRPine Script · Momentum · 1h