Strategy vault / Trend following
Multi EMA Crossover Trend Following Strategy
The Multi-EMA Crossover Trend Following Strategy is a quantitative trading approach based on multiple Exponential Moving Average (EMA) crossover signals. This strategy utilizes the crossover relationships between…
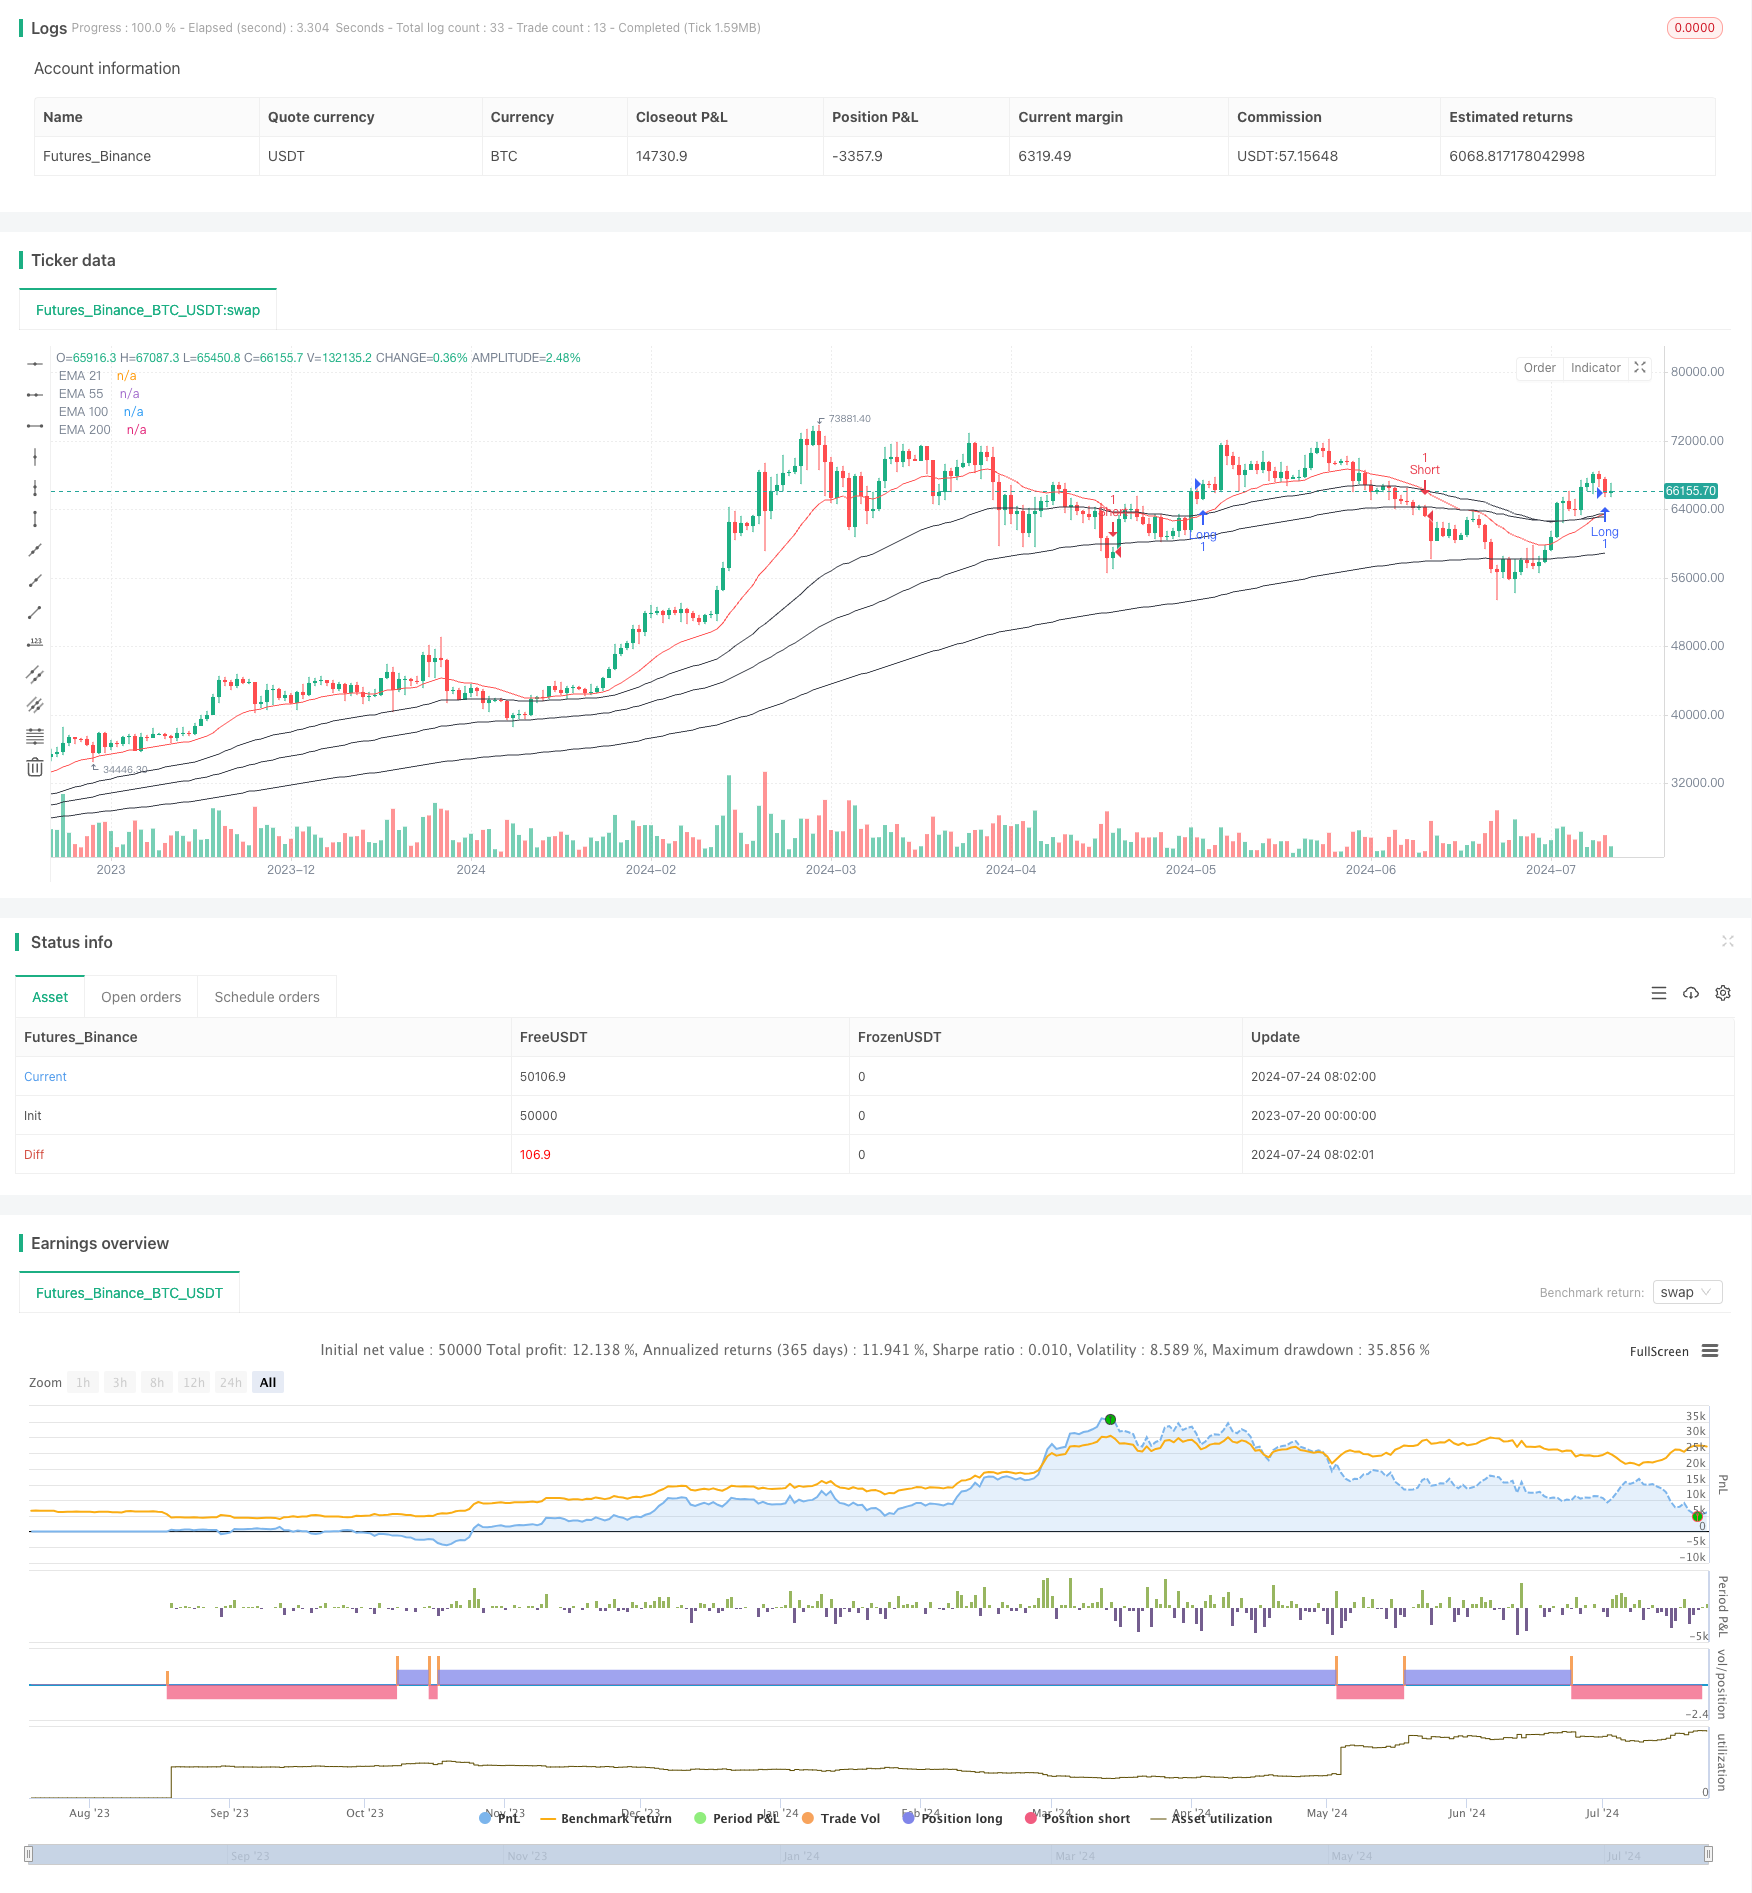
Overview
The Multi-EMA Crossover Trend Following Strategy is a quantitative trading approach based on multiple Exponential Moving Average (EMA) crossover signals. This strategy utilizes the crossover relationships between 21-period, 55-period, 100-period, and 200-period EMAs to identify market trends and execute trades on a 4-hour timeframe. The core idea is to capture trend initiations and reversals by observing crossovers between short-term and long-term EMAs, thereby establishing positions early in trend development to profit from major market moves.
Strategy Principles
The core principles of this strategy include:
Multiple EMA Setup: The strategy employs four EMA lines: 21-period, 55-period, 100-period, and 200-period. This setup comprehensively reflects price movements across different timeframes, facilitating trend identification across multiple time horizons.
Crossover Signals: The strategy primarily relies on two sets of crossover signals to trigger trades:
- EMA21 and EMA55 crossover: Used to capture short-term trend changes
- EMA55 and EMA200 crossover: Used to confirm medium to long-term trend shifts
Entry Logic:
- Long Entry: When EMA21 crosses above EMA55, or EMA55 crosses above EMA200
- Short Entry: When EMA21 crosses below EMA55, or EMA55 crosses below EMA200
Timeframe: The strategy operates on a 4-hour chart, balancing short-term fluctuations with long-term trends, suitable for medium-term trend following.
Visualization: All utilized EMA lines are plotted on the chart, allowing for intuitive observation of price-EMA relationships.
Strategy Advantages
Multi-Timeframe Analysis: By using EMAs of different periods, the strategy can simultaneously capture short, medium, and long-term trends, enhancing adaptability and stability.
Early Trend Entry: The EMA21 and EMA55 crossover can detect trend changes relatively early, helping to establish positions at the beginning of trends, maximizing potential profits.
Trend Confirmation Mechanism: The EMA55 and EMA200 crossover serves as a secondary confirmation, filtering out some false breakouts and improving trade reliability.
Visual Intuitiveness: All EMA lines are visualized on the chart, allowing traders to intuitively understand market structure and trend status.
Wide Applicability: The strategy can be applied to various trading instruments and markets, demonstrating good versatility.
Automation-Friendly: The strategy logic is clear and easy to program, suitable for automated trading implementation.
Strategy Risks
Ineffective in Ranging Markets: In sideways or oscillating markets, frequent EMA crossovers may lead to excessive trading and false signals, increasing transaction costs.
Lag: EMAs are inherently lagging indicators, which may not respond quickly enough in rapidly reversing markets, leading to delayed entries or exits.
False Breakout Risk: Despite using multiple confirmation mechanisms, false breakouts can still occur, especially in highly volatile market conditions.
Lack of Stop-Loss Mechanism: The current strategy lacks a clear stop-loss strategy, potentially facing significant losses during trend reversals.
Over-Reliance on Technical Indicators: The strategy relies entirely on EMA indicators, neglecting other important market factors such as fundamentals and news events.
Strategy Optimization Directions
Introduce Dynamic Stop-Loss: Consider implementing trailing stops or ATR-based dynamic stop-losses for better risk control.
Incorporate Volume Confirmation: Integrating volume indicators can improve trend identification accuracy, especially at key breakout points.
Optimize Entry Timing: Consider waiting for price to retest the EMA after a crossover before entering, to obtain better entry prices.
Add Volatility Filters: Restricting trades in low volatility environments can reduce false signals in ranging markets.
Combine with Other Technical Indicators: Incorporating indicators like RSI or MACD can provide additional trend confirmation and divergence signals.
Implement Adaptive Parameters: Dynamically adjusting EMA periods based on market conditions can enhance strategy adaptability.
Consider Fundamental Factors: Adjusting strategy sensitivity before and after important economic data releases can help avoid false breakouts caused by news events.
Conclusion
The Multi-EMA Crossover Trend Following Strategy is a quantitative trading method that combines short-term and long-term trend analysis. By leveraging the crossover relationships of multiple EMAs, this strategy aims to capture early trend initiations and major reversals in the market. Its strengths lie in comprehensive analysis of trends across multiple timeframes, providing clear entry signals, and offering good visualization effects. However, the strategy also faces risks such as poor performance in ranging markets and signal lag.
To further enhance the strategy's performance, one could consider introducing dynamic stop-loss mechanisms, incorporating volume analysis, optimizing entry timing, and adding volatility filters. Additionally, combining the strategy with other technical indicators or fundamental analysis can build a more comprehensive and robust trading system.
Overall, this strategy provides a solid framework for trend following. Through careful parameter optimization and risk management, it has the potential to become a reliable quantitative trading strategy. However, in practical application, traders should still carefully evaluate market conditions and use this strategy in conjunction with their own risk preferences and capital management principles.
Source Pine Script
/*backtest
start: 2023-07-20 00:00:00
end: 2024-07-25 00:00:00
period: 1d
basePeriod: 1h
exchanges: [{"eid":"Futures_Binance","currency":"BTC_USDT"}]
*/

//@version=5
strategy("EMA Crossover Strategy", overlay=true)

// DefinitionEMA
ema21 = ta.ema(close, 21)
ema55 = ta.ema(close, 55)
ema100 = ta.ema(close, 100)
ema200 = ta.ema(close, 200)

// DrawEMA
plot(ema21, title="EMA 21", color=color.red)
plot(ema55, title="EMA 55", color=color.black)
plot(ema100, title="EMA 100", color=color.black)
plot(ema200, title="EMA 200", color=color.black)

// Entry Conditions
longCondition = ta.crossover(ema21, ema55)
shortCondition = ta.crossunder(ema21, ema55)

// Long Strategy
if (longCondition)
    strategy.entry("Long", strategy.long)

// Short Strategy
if (shortCondition)
    strategy.entry("Short", strategy.short)

// Entry Conditions
longCondition2 = ta.crossover(ema55, ema200)
shortCondition2 = ta.crossunder(ema55, ema200)

// Long Strategy2
if (longCondition2)
    strategy.entry("longCondition2", strategy.long)

// Short Strategy2
if (shortCondition2)
    strategy.entry("shortCondition2", strategy.short)
Published by ChaoZhang on the FMZ strategy square · last modified 2024-07-26. Collected in the Quant Trading Vault. Unvalidated research: re-test with your own data and costs before trusting it.
Build this with AgenKit
A spec is not a trading system. Paste this into your coding agent and AgenKit runs a specialist team — architecture, test-first build, risk gates, review — with paper trading on by default.
/agenkit build a production-grade trading bot with a backtest engine, risk controls and paper trading by default from strategies/Multi-EMA-Crossover-Trend-Following-Strategy.md- npx agenkit install engineering-kit in your project
- Paste the command into your agent and approve each phase
- Get tests, backtest, risk controls and a paper-trading switch
Understand it first
Before you run this, read the lesson behind the idea and how to backtest it honestly. Specs like this one are the survivors of an unknown number of trials; deflate their results accordingly.
Related specs
- 200 EMA VWAP MFI Trend Following StrategyPine Script · Trend following · 1d
- 4 EMA Trend StrategyPine Script · Trend following · 1d
- ADX MA and EMA Long Only Trend Tracking StrategyPine Script · Trend following · 1d
- ATR Dynamic Trend Following and EMA Crossover Trading StrategyPine Script · Trend following · 1d
- ATR and Moving Average Crossover Hybrid StrategyPine Script · Trend following · 1h
- ATR and T3 Moving Average StrategyPine Script · Trend following · 5m