Multi EMA Crossover with Momentum Indicators Trading Strategy
This strategy is a quantitative trading system that combines multiple Exponential Moving Averages (EMA), Relative Strength Index (RSI), and Moving Average Convergence Divergence (MACD). The strategy forms a complete…
Overview
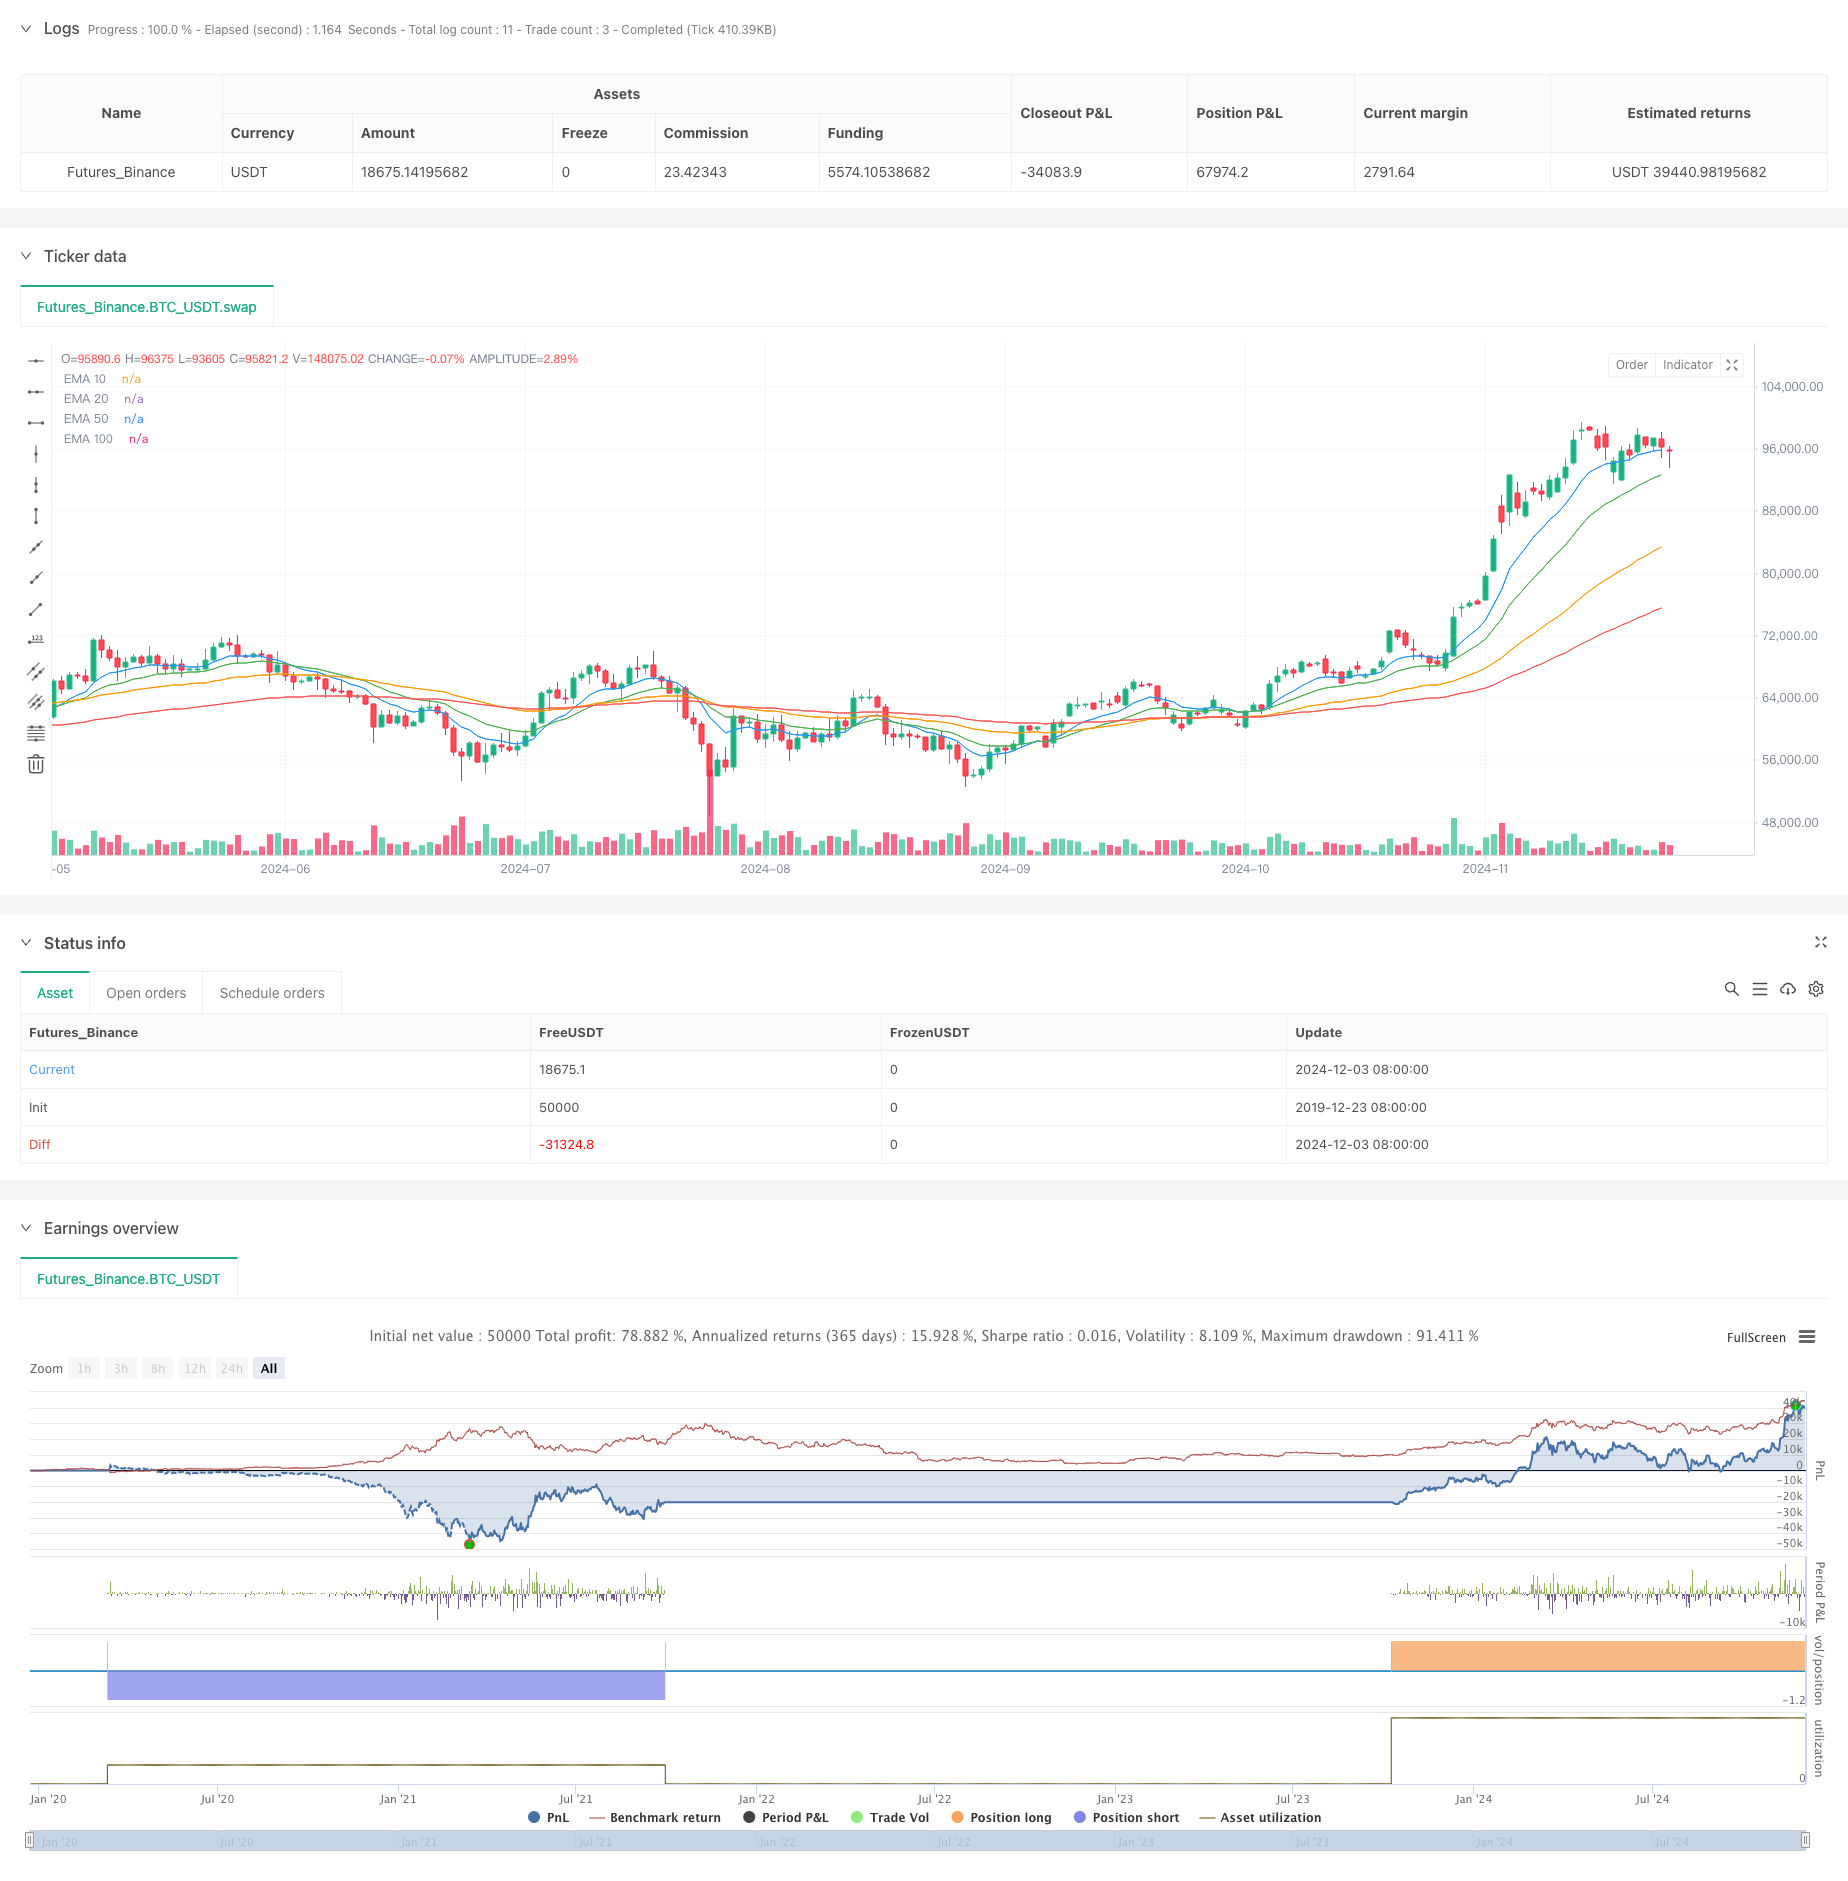
This strategy is a quantitative trading system that combines multiple Exponential Moving Averages (EMA), Relative Strength Index (RSI), and Moving Average Convergence Divergence (MACD). The strategy forms a complete trading decision framework through the coordination of multiple technical indicators. It uses four EMA lines (10, 20, 50, and 100-day) as the main trend judgment tools, combined with RSI and MACD as auxiliary confirmation indicators, while setting stop-loss and take-profit to control risk.
Strategy Principles
The core logic of the strategy is based on the following key elements:
- Moving Average System: Uses 4 EMAs (10/20/50/100) to build a trend judgment system, with short-term EMAs including 10-day and 20-day, and medium-long term EMAs of 50-day and 100-day.
- Entry Signals: Long positions require short-term EMAs crossing above long-term EMAs, RSI above 50, and MACD line crossing above signal line; short positions require opposite conditions.
- Risk Management: Sets 1.5% stop-loss and 3% take-profit ratios, forming a complete money management mechanism.
- Confirmation System: Uses RSI and MACD as trend confirmation tools to improve trading accuracy.
Strategy Advantages
- Multiple Confirmation Mechanism: Significantly reduces false signals through triple verification of EMA crossovers, RSI, and MACD.
- Comprehensive Risk Control: Has clear stop-loss and take-profit settings to effectively control risk for each trade.
- Trend Following Capability: Can effectively capture market trends through multiple moving average systems.
- Flexible Parameter Settings: Parameters for all indicators can be adjusted according to different market conditions.
- Systematic Operation: Clear strategy logic that can achieve fully programmatic trading.
Strategy Risks
- Sideways Market Risk: May generate frequent false signals in range-bound markets.
- Lag Risk: Moving average system has inherent lag, potentially missing optimal entry points.
- Parameter Sensitivity: Different parameter combinations may lead to significant performance variations.
- Market Environment Dependency: Strategy performs better in trending markets but may underperform in other market conditions.
Optimization Directions
- Dynamic Parameter Adjustment: Can dynamically adjust EMA periods and RSI thresholds based on market volatility.
- Market Environment Recognition: Add market condition identification module to adopt different trading strategies under different market conditions.
- Stop-Loss Optimization: Can introduce trailing stop-loss mechanism to better protect profits.
- Position Management: Add dynamic position management module to adjust holding ratios based on market risk levels.
- Signal Filtering: Can add other indicators such as volume as auxiliary filtering conditions.
Summary
This is a well-designed quantitative trading strategy with rigorous logic. Through the combined use of multiple technical indicators, it can effectively capture market trends while maintaining comprehensive risk control mechanisms. The strategy has significant optimization potential, and through continuous improvement and adjustment, better trading results can be expected. It is recommended to conduct thorough backtesting before live trading and adjust parameters according to specific market conditions.
Source Pine Script
/*backtest
start: 2019-12-23 08:00:00
end: 2024-12-04 00:00:00
period: 1d
basePeriod: 1d
exchanges: [{"eid":"Futures_Binance","currency":"BTC_USDT"}]
*/

//@version=5
strategy("4 EMA Strategy with RSI & MACD", shorttitle="4 EMA + RSI + MACD", overlay=true)

// Input EMA periods
ema1 = input(10, title="EMA 1")
ema2 = input(20, title="EMA 2")
ema3 = input(50, title="EMA 3")
ema4 = input(100, title="EMA 4")

// Input RSI & MACD settings
rsiLength = input(14, title="RSI Length")
rsiOverbought = input(70, title="RSI Overbought")
rsiOversold = input(30, title="RSI Oversold")
macdFast = input(12, title="MACD Fast Length")
macdSlow = input(26, title="MACD Slow Length")
macdSignal = input(9, title="MACD Signal Length")

// Stop Loss and Take Profit Inputs
stopLossPct = input.float(1.5, title="Stop Loss %") / 100
takeProfitPct = input.float(3, title="Take Profit %") / 100

// Calculate EMAs
ema_1 = ta.ema(close, ema1)
ema_2 = ta.ema(close, ema2)
ema_3 = ta.ema(close, ema3)
ema_4 = ta.ema(close, ema4)

// Calculate RSI
rsi = ta.rsi(close, rsiLength)

// Calculate MACD
[macdLine, signalLine, _] = ta.macd(close, macdFast, macdSlow, macdSignal)

// Plot EMAs
plot(ema_1, color=color.blue, title="EMA 10")
plot(ema_2, color=color.green, title="EMA 20")
plot(ema_3, color=color.orange, title="EMA 50")
plot(ema_4, color=color.red, title="EMA 100")

// Entry Conditions
longCondition = ta.crossover(ema_1, ema_4) and ta.crossover(ema_2, ema_3) and rsi > 50 and macdLine > signalLine
shortCondition = ta.crossunder(ema_1, ema_4) and ta.crossunder(ema_2, ema_3) and rsi < 50 and macdLine < signalLine

// Declare Stop Loss and Take Profit Variables
var float stopLossPrice = na
var float takeProfitPrice = na
var line stopLossLine = na
var line takeProfitLine = na

// Long Trade
if (longCondition)
    strategy.entry("Buy", strategy.long)
    stopLossPrice := strategy.position_avg_price * (1 - stopLossPct)
    takeProfitPrice := strategy.position_avg_price * (1 + takeProfitPct)
    // stopLossLine := line.new(bar_index, stopLossPrice, bar_index + 1, stopLossPrice, color=color.red, width=2, style=line.style_dotted)
    // takeProfitLine := line.new(bar_index, takeProfitPrice, bar_index + 1, takeProfitPrice, color=color.green, width=2, style=line.style_dotted)

// Short Trade
if (shortCondition)
    strategy.entry("Sell", strategy.short)
    stopLossPrice := strategy.position_avg_price * (1 + stopLossPct)
    takeProfitPrice := strategy.position_avg_price * (1 - takeProfitPct)
    // stopLossLine := line.new(bar_index, stopLossPrice, bar_index + 1, stopLossPrice, color=color.red, width=2, style=line.style_dotted)
    // takeProfitLine := line.new(bar_index, takeProfitPrice, bar_index + 1, takeProfitPrice, color=color.green, width=2, style=line.style_dotted)

// Clear Lines on Trade Exit
// if (strategy.position_size == 0)
//     line.delete(stopLossLine)
//     line.delete(takeProfitLine)

// Exit Trades
if (strategy.position_size > 0)
    strategy.exit("Sell", from_entry="Buy", stop=stopLossPrice, limit=takeProfitPrice)

if (strategy.position_size < 0)
    strategy.exit("Cover", from_entry="Sell", stop=stopLossPrice, limit=takeProfitPrice)
Published by ChaoZhang on the FMZ strategy square · last modified 2024-12-05. Collected in the Quant Trading Vault. Unvalidated research: re-test with your own data and costs before trusting it.
Build this with AgenKit
A spec is not a trading system. Paste this into your coding agent and AgenKit runs a specialist team — architecture, test-first build, risk gates, review — with paper trading on by default.
/agenkit build a production-grade trading bot with a backtest engine, risk controls and paper trading by default from strategies/Multi-EMA-Crossover-with-Momentum-Indicators-Trading-Strategy.md- npx agenkit install engineering-kit in your project
- Paste the command into your agent and approve each phase
- Get tests, backtest, risk controls and a paper-trading switch
Understand it first
Before you run this, read the lesson behind the idea and how to backtest it honestly. Specs like this one are the survivors of an unknown number of trials; deflate their results accordingly.
Related specs
- Advanced Multi Indicator Trend Following and Momentum Quantitative Trading StrategyPine Script · Momentum · 1h
- KST EMA Momentum Trend Following StrategyPine Script · Momentum · 1d
- MACD Momentum Indicator Backtest StrategyPine Script · Momentum · 1h
- Momentum Exponential Moving Average Crossover Trading StrategyPine Script · Momentum · 1d
- MoonFlag MACD Momentum StochRSI Trading StrategyPine Script · Momentum · 1d
- Multi Indicator Comprehensive Momentum Trading StrategyPine Script · Momentum · 1d