Multi factor Momentum Rotation Strategy
This strategy combines RSI, MACD, Bollinger Bands and limit up/down factors to implement multi-factor momentum rotation trading. The strategy first judges if multiple technical indicators give buy or sell signals…
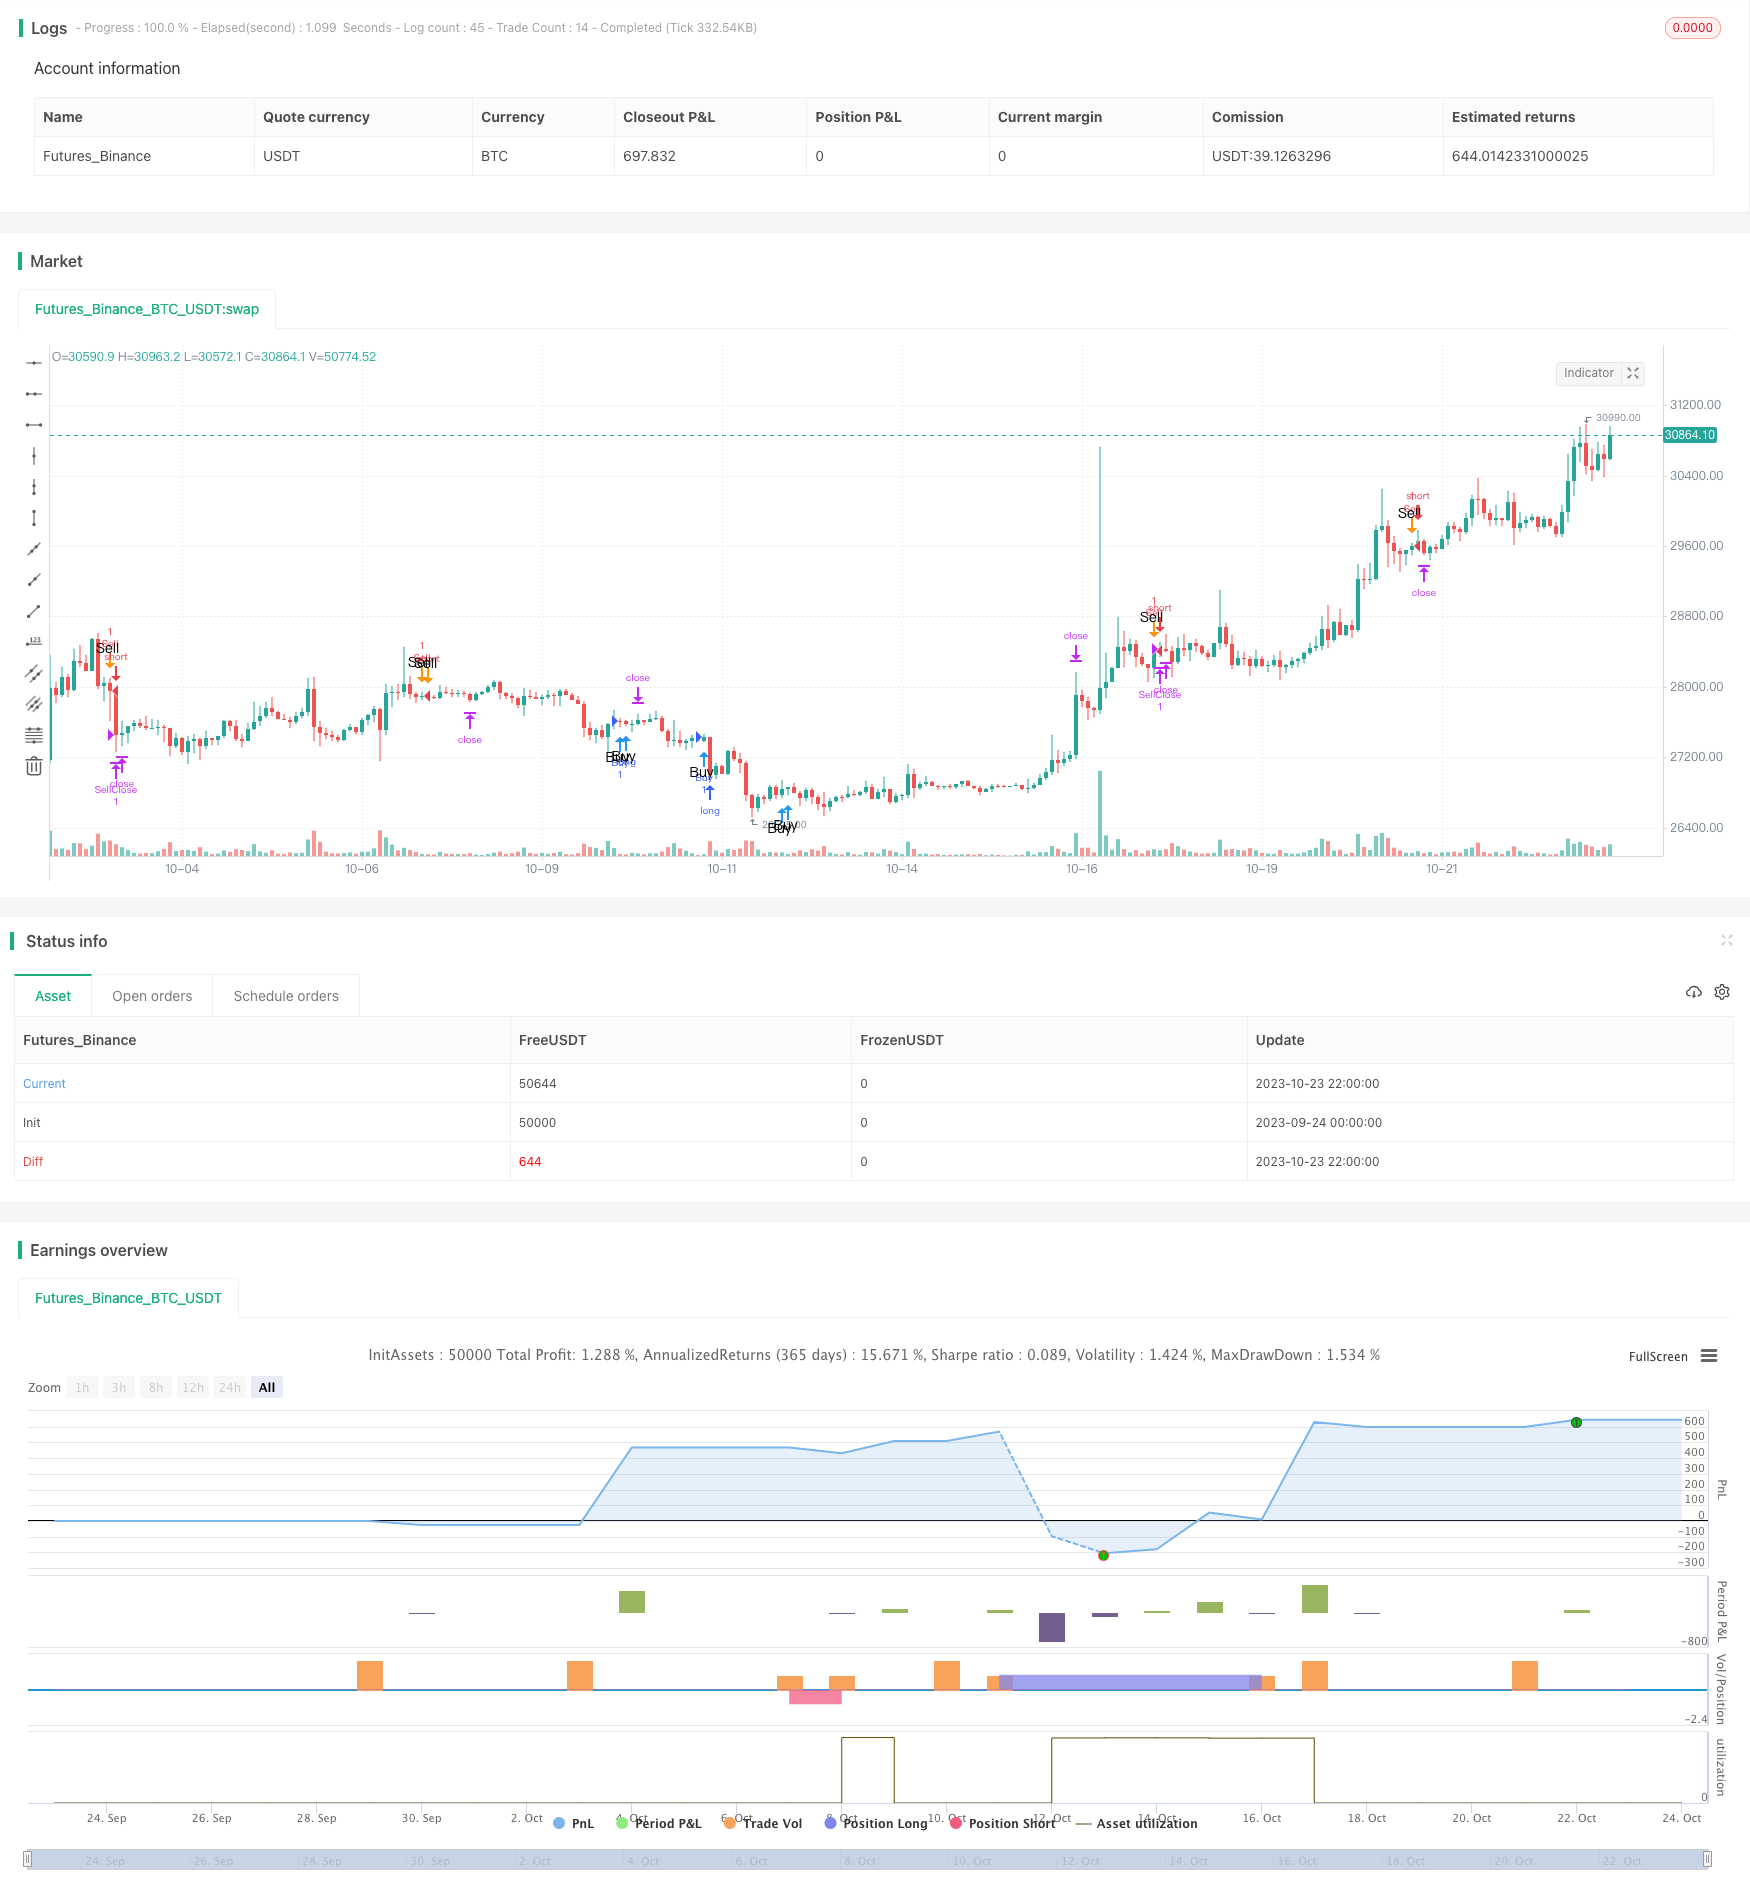
Overview
This strategy combines RSI, MACD, Bollinger Bands and limit up/down factors to implement multi-factor momentum rotation trading. The strategy first judges if multiple technical indicators give buy or sell signals simultaneously. If so, corresponding buy or sell operations will be executed. Meanwhile, the strategy adopts moving stop profit and stop loss to lock in profits and control risks.
Strategy Logic
The main components of this strategy are:
Factor judgement
- RSI: Calculate 14-period RSI and judge if it is lower than the buy line or higher than the sell line
- TD Sequence: Calculate number of limit up/down days and judge if it meets buy/sell conditions
- MACD: Calculate MACD and MACD Histogram to judge buy/sell conditions
- Bollinger Bands: Calculate 20-period BBs and judge if price touches BBs' upper or lower band
Entry and exit
- Buy condition: RSI, MACD, TD Sequence give buy signals together
- Sell condition: RSI, MACD, TD Sequence give sell signals together
- Stop profit: Use fixed points or percentage as trailing stop profit
- Stop loss: Set maximum tolerated loss points for stop loss
Strategy optimization
- Adjust RSI parameters: Optimize RSI period parameter
- Adjust MA period: Optimize period parameter of Moving Averages
- Adjust entry conditions: Add or reduce entry signals
- Add other factors: Incorporate more technical indicators and statistical factors
Advantage Analysis
Multiple factors improve entry accuracy
The strategy considers multiple factors like RSI and MACD rather than just single indicator. This reduces false signals and improves entry accuracy.
Momentum characteristic captures trends
Indicators like RSI and MACD have obvious momentum characteristic, which capture price trend changes. They are more sensitive than trend following indicators like MAs.
Stop profit/loss mechanism controls risks
Moving stop profit can lock in profits dynamically following the market. Stop loss setting controls single trade loss.
Simple and clear logic
The strategy combines common technical indicators and has certain universality. Its rules are relatively simple and clear.
Risk Analysis
Poor performance in bull market
The strategy focuses on mean-reversion trading. It may trigger frequent stop loss in a bull market.
Potentially too high trading frequency
If parameters are set too sensitively, trading frequency may be too high, increasing costs and slippage.
Divergence risk across indicators
The strategy relies on consistent signals across indicators, but sometimes divergences may happen, resulting in wrong signals.
Stop loss being penetrated
Fixed stop loss points may be penetrated. Dynamic stop loss or stock change may help avoid this risk.
Optimization Directions
Optimize parameters to reduce trading frequency
Test RSI parameters and MA periods to find combinations with lower trading frequency.
Add statistical factors to improve efficiency
Incorporate stock-specific stats like volatility and liquidity to set parameters and improve efficiency.
Combine market-level indicators like VIX
Adjust strategy parameters based on market panic indicators like VIX to reduce trading frequency during market-wide crashes.
Test different holding periods
Test long-term holding versus short-term rotation to see their impact on strategy performance.
Optimize and test stop profit/loss
Research more advanced dynamic stop profit/loss techniques and backtest them.
Summary
This strategy combines multiple technical indicators and adopts moving stop profit/loss to lock in profits and control risks while ensuring high entry accuracy. The logic is simple and clear. Performance can be further improved through parameter optimization and indicator selection. But the strategy is more suitable for mean-reversion and range-bound markets. It may underperform in persistent uptrends. In summary, this is a typical multi-factor mean-reversion momentum strategy that provides ideas and reference for stock rotation trading.
Parameters
| Name | Default | What it controls |
|---|---|---|
| v_input_1 | -7 | RSI Difference |
| v_input_2 | 50 | Profit |
| v_input_3 | 10 | Profit |
| v_input_4 | false | Use Stop Loss? |
| v_input_5 | 145 | Stop Loss |
| v_input_6 | 100 | 0-show / 100-hide Strategy |
Source Pine Script
/*backtest
start: 2023-09-24 00:00:00
end: 2023-10-24 00:00:00
period: 2h
basePeriod: 15m
exchanges: [{"eid":"Futures_Binance","currency":"BTC_USDT"}]
*/

//@version=2
strategy("RSI, TD Seq, MACD, BB Strategy - Calculation Trailing Profit",overlay=true)


RSIDifference = input(-7, minval=-50, maxval=50, title="RSI Difference")


TD = close > close[4] ?nz(TD[1])+1:0
TS = close < close[4] ?nz(TS[1])+1:0
TDUp = TD - valuewhen(TD < TD[1], TD , 1 )
TDDn = TS - valuewhen(TS < TS[1], TS , 1 )
TDcheckUP = iff(TD == 2, true, false)
TDCheckDOWN = iff(TS == 2, true, false)

[_, _, histLine] = macd(close, 12, 26, 9)
MACDCheckDown = iff(histLine > 0 and histLine[1] > 0 and histLine[2] > 0 and histLine[3] > 0  and histLine[4] > 0, true, false)
MACDCheckUp = iff(histLine < 0 and histLine[1] < 0 and histLine[2] < 0 and histLine[3] < 0 and histLine[4] < 0, true, false)

RSICal = rsi(close, 14)
RSICalNewUp = 50 + RSIDifference
RSICalNewDown = 50 - RSIDifference
RSICheckUp = iff(RSICal <= RSICalNewUp, true, false)
RSICheckDown = iff(RSICal >= RSICalNewDown, true, false)

basis = sma(close, 20)
dev = 2 * stdev(close, 20)
upperBB = basis + dev
lowerBB = basis - dev
BBCheckUp = iff(close > upperBB, true, false)
BBCheckDown = iff(close < lowerBB, true, false)
//BBCheckUp = false
//BBCheckDown = false


BuyCheck = iff(TDcheckUP == true and MACDCheckUp == true and RSICheckUp == true and BBCheckUp == false, true, false)
SellCheck = iff(TDCheckDOWN == true and MACDCheckDown == true and RSICheckDown == true and BBCheckDown == false, true, false)


ProfitStratA = input(50, minval=0, maxval=10000, title="Profit", step=0.5)
ProfitTrailingA = input(10, minval=0, maxval=10000, title="Profit", step=0.5)
useStopLoss = input(false, title="Use Stop Loss?")
LossstratA = input(145, minval=0, maxval=10000, title="Stop Loss", step=0.5)
colB = input(100, minval=0, maxval=100, title="0-show / 100-hide Strategy", step=100)

ProfitStrat = ProfitStratA * 10
ProfitTrailing = ProfitTrailingA * 10
Lossstrat = useStopLoss ? LossstratA * 10 : 1000000

if (strategy.position_size > 0)
    strategy.exit("BuyClose", "Buy", trail_points=ProfitStrat, trail_offset=ProfitTrailing, loss=Lossstrat)


if (strategy.position_size < 0)
    strategy.exit("SellClose", "Sell", trail_points=ProfitStrat, trail_offset=ProfitTrailing, loss=Lossstrat)


if (BuyCheck == true and strategy.position_size == 0)
    strategy.entry("Buy", strategy.long, comment="Long Entry")


if (SellCheck == true and strategy.position_size == 0)
    strategy.entry("Sell", strategy.short, comment="Short Entry")


plotshape(BuyCheck, color=blue, transp=colB, style=shape.arrowup, text="Buy\n", location=location.belowbar)
plotshape(SellCheck, color=orange, transp=colB, style=shape.arrowdown, text="Sell\n", location=location.abovebar)
Published by ChaoZhang on the FMZ strategy square · last modified 2023-10-25. Collected in the Quant Trading Vault. Unvalidated research: re-test with your own data and costs before trusting it.
Build this with AgenKit
A spec is not a trading system. Paste this into your coding agent and AgenKit runs a specialist team — architecture, test-first build, risk gates, review — with paper trading on by default.
/agenkit build a production-grade trading bot with a backtest engine, risk controls and paper trading by default from strategies/Multi-factor-Momentum-Rotation-Strategy.md- npx agenkit install engineering-kit in your project
- Paste the command into your agent and approve each phase
- Get tests, backtest, risk controls and a paper-trading switch
Understand it first
Before you run this, read the lesson behind the idea and how to backtest it honestly. Specs like this one are the survivors of an unknown number of trials; deflate their results accordingly.
Related specs
- Momentum Indicator Aggregation Trading StrategyPine Script · Momentum · 1h
- Multi Indicator Trend Momentum Trading Strategy An Optimized Quantitative Trading System Based on Bollinger Bands Fibonacci and ATRPine Script · Momentum · 1h
- Multi Trend Momentum Crossover Strategy with Volatility Optimization SystemPine Script · Momentum · 1d
- Swing Trading Strategy Based on MomentumPine Script · Momentum
- Momentum Oscillation Crossing Bollinger Bands with Moving Average StrategyPine Script · Momentum · 1d
- Multi Indicator Comprehensive Analysis Quantitative Trading Strategy Trend Momentum and Volatility Collaborative Prediction ModelPine Script · Momentum · 3m