Strategy vault / Mean reversion
Multi factor Quantitative Trading Strategy 440526
This is a quantitative trading strategy that incorporates multiple technical indicators. It combines moving averages, MACD, Bollinger Bands, RSI and other indicators to implement a multi-factor model driven automated…
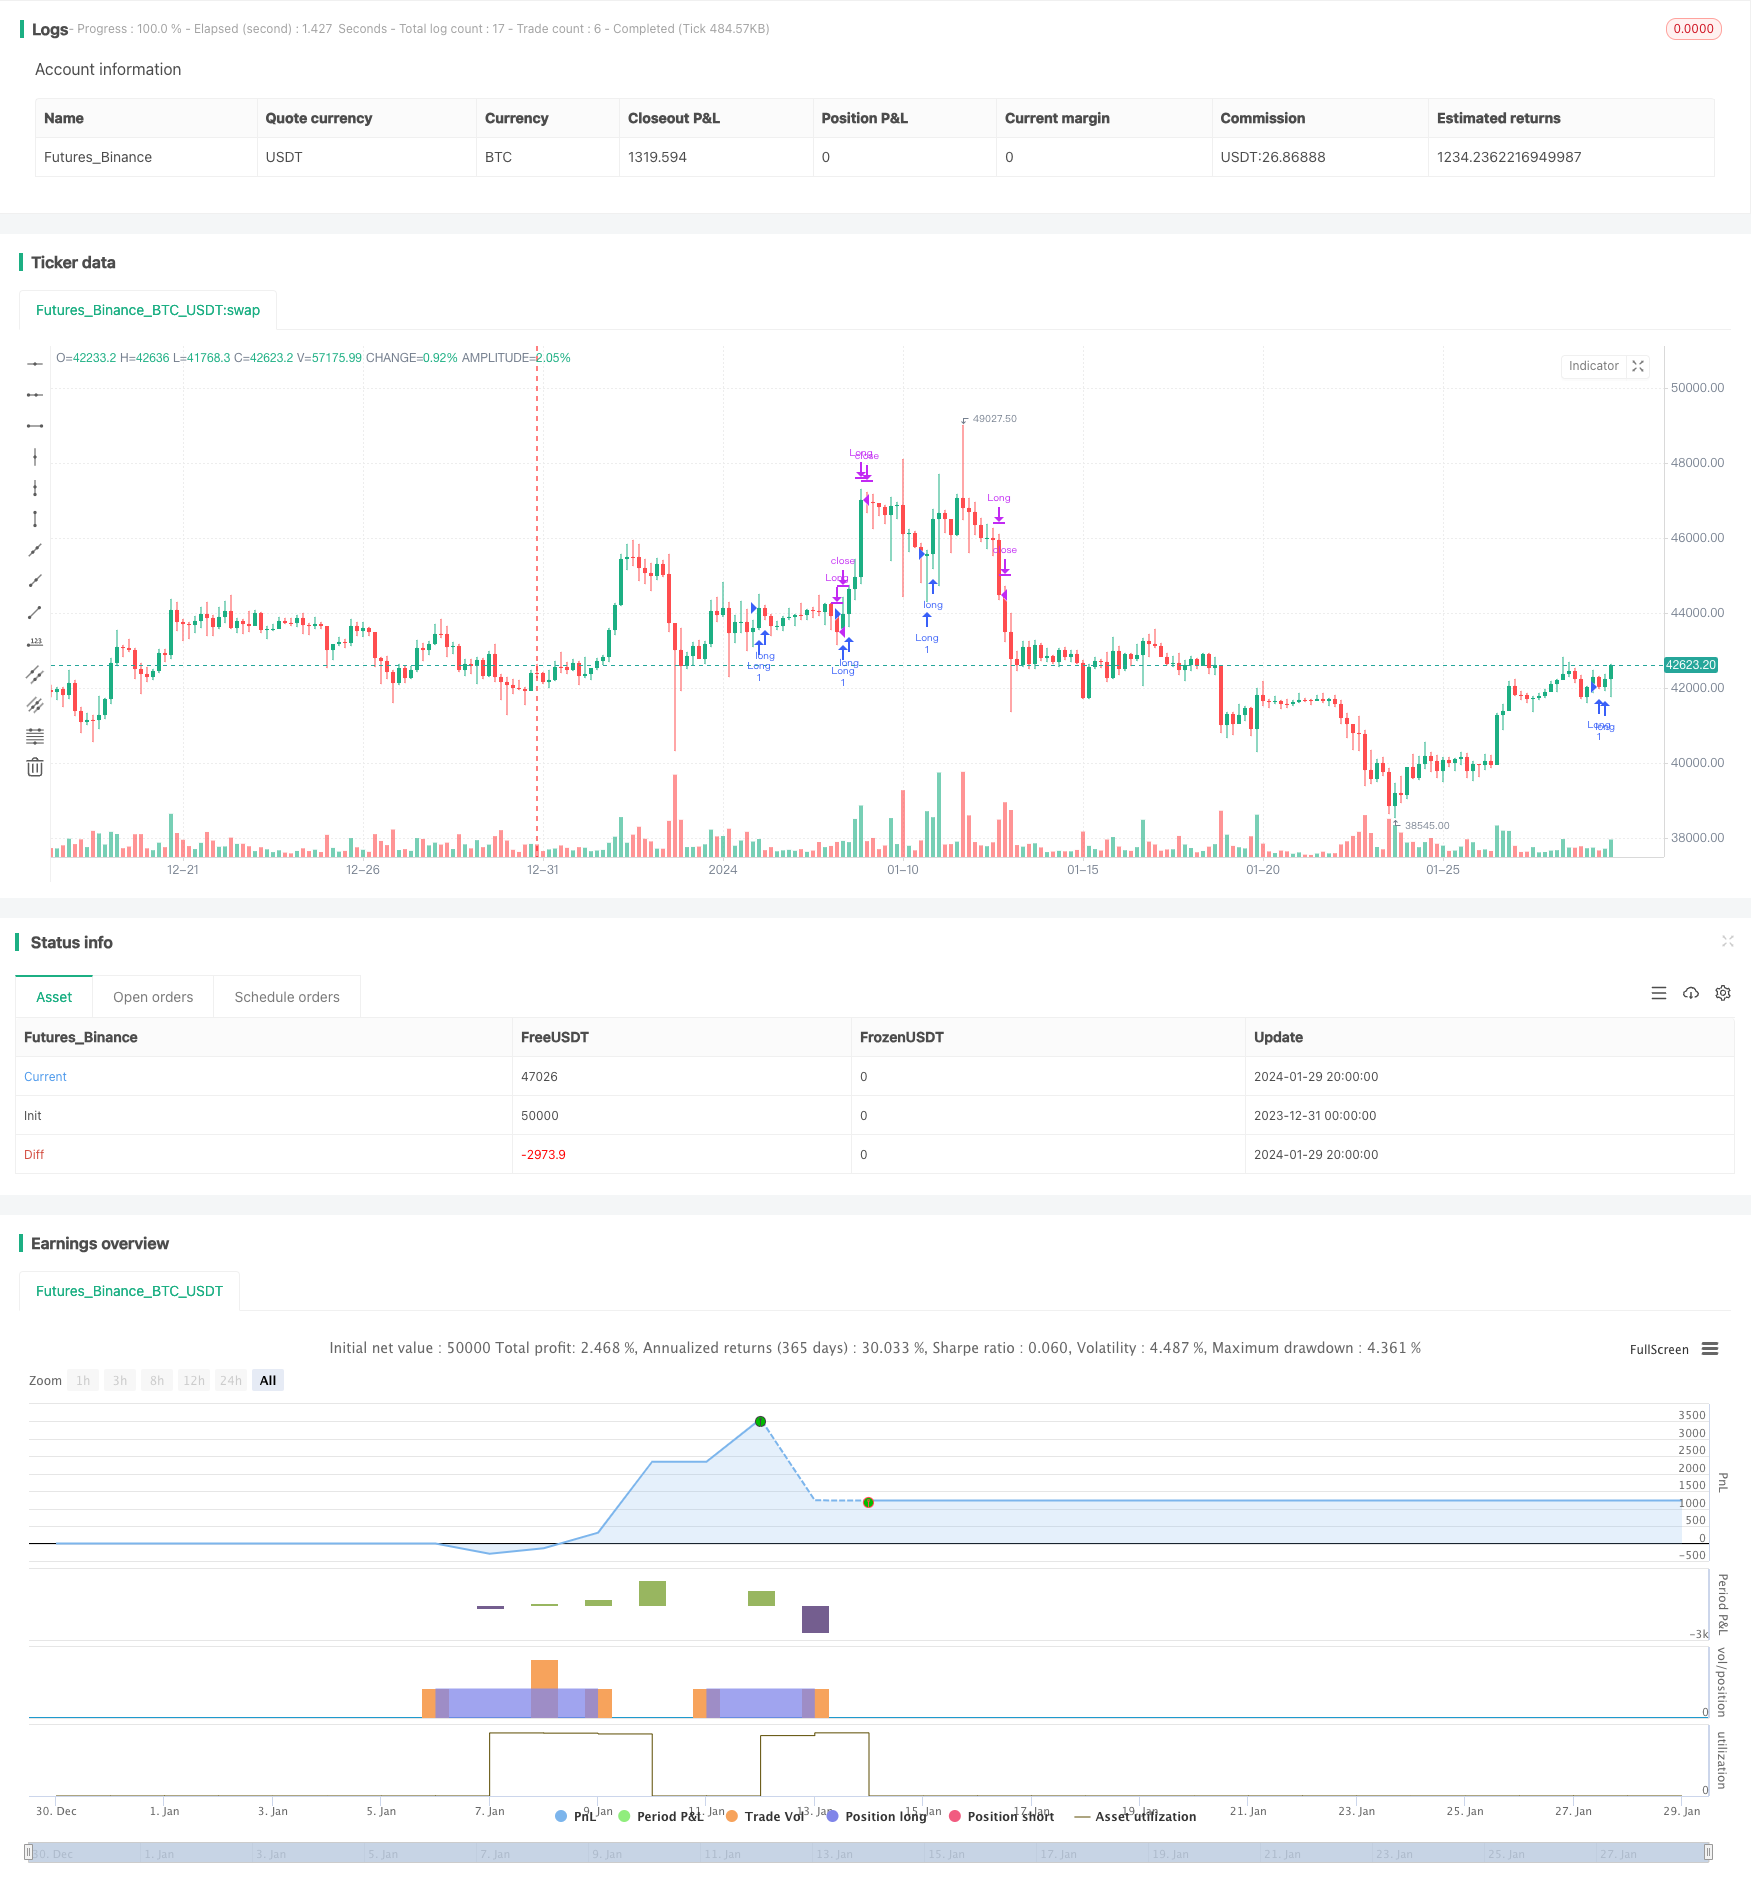
Overview
This is a quantitative trading strategy that incorporates multiple technical indicators. It combines moving averages, MACD, Bollinger Bands, RSI and other indicators to implement a multi-factor model driven automated trading.
Strategy Logic
The trading signals of this strategy come from the following parts:
- Golden cross and death cross of dual moving averages
- MACD zero line crossovers
- Bollinger Bands upper and lower rail reversals
- RSI overbought and oversold reversals
When the above indicators simultaneously issue buy or sell signals, the strategy will make corresponding long or short decisions.
Specifically, when the fast moving average crosses over the slow one, MACD histograms start to increase, RSI bounces up from oversold zone, and price approaches the Bollinger Bands lower rail, it's considered as a trend reversal signal for long entry.
And when the fast MA crosses below the slow MA, MACD histograms begin to decline, RSI drops from overbought area, and price reaches the upper Bollinger Bands, it's regarded as a short-term top reversal for short entry.
By combining signals from multiple indicators, fake signals can be filtered out effectively and the stability of the strategy can be improved.
Advantage Analysis
The biggest advantage of this strategy is that it adopts a multi-factor model for trading, which enhances the reliability of signals, stability and profitability of the strategy.
The multi-factor model can verify trading signals with each other and reduce interference from fake signals effectively.
Indicators from different categories can capture more comprehensive characteristics of market movements and make more accurate judgements.
The combination of multiple indicators can smooth out fluctuations of individual ones and ensure more steady returns.
The indicators and their weights in the combination can be flexibly adjusted to tailor the strategy for different market conditions.
Risk Analysis
Some risks of this strategy should be concerned:
The complex combination of multiple indicators requires precise parameter tuning and testing, otherwise it may produce invalid signals.
The performance on a single product may not be stable enough. A portfolio consisting of suitable products should be constructed to diversify risks.
Position sizing and stop loss mechanisms should be strictly controlled to limit losses under extreme market conditions.
Optimization Directions
Some directions this strategy can be optimized:
Test combinations of more indicators to find out the optimal parameters, such as implied volatility, volume etc.
Utilize machine learning methods to automatically generate optimal combinations of indicators and parameter sets.
Do more backtests and optimization on longer time frames, adjust weights accordingly for different market stages.
Incorporate risk management tools to control losses on single trades and overall positions strictly.
Conclusion
This strategy makes full use of advantages of different technical indicators and forms a multi-factor model, which improves the accuracy of signals effectively. Meanwhile, risk control, parameters tuning and strategy updating are also vital to keep improving the stability and profitability.
Parameters
| Name | Default | What it controls |
|---|---|---|
| v_input_1 | false | Короткие сделки |
| v_input_2 | true | Длинные сделки |
| v_input_3 | 21 | Быстрый период |
| v_input_4 | 26 | Медленный период |
| v_input_5 | 9 | Тенкан-сен |
| v_input_6 | 26 | Киджун-сен |
| v_input_7 | 52 | Сенкоу-спан B |
| v_input_8 | 14 | ADX период |
| v_input_9 | 30 | ADX уровень |
| v_input_10 | 14 | RSI период |
| v_input_11 | 70 | RSI перекупленность |
| v_input_12 | 30 | RSI перепроданность |
| v_input_13 | 14 | OBV период |
Source Pine Script
/*backtest
start: 2023-12-31 00:00:00
end: 2024-01-30 00:00:00
period: 4h
basePeriod: 15m
exchanges: [{"eid":"Futures_Binance","currency":"BTC_USDT"}]
*/

//@version=5
strategy("Математическая Торговая Система с Ишимоку, TP/SL, ADX, RSI, OBV", shorttitle="МТС Ишимоку TP/SL ADX RSI OBV", overlay=true)

is_short_enable = input(0, title="Короткие сделки")
is_long_enable = input(1, title="Длинные сделки")

// Входные параметры для скользящих средних
fast_length = input(21, title="Быстрый период")
slow_length = input(26, title="Медленный период")

// Входные параметры для Ишимоку
tenkan_length = input(9, title="Тенкан-сен")
kijun_length = input(26, title="Киджун-сен")
senkou_length = input(52, title="Сенкоу-спан B")

// Входные параметры для ADX
adx_length = input(14, title="ADX период")
adx_level = input(30, title="ADX уровень")

// Входные параметры для RSI
rsi_length = input(14, title="RSI период")
rsi_overbought = input(70, title="RSI перекупленность")
rsi_oversold = input(30, title="RSI перепроданность")

// Входные параметры для OBV
obv_length = input(14, title="OBV период")

// Вычисление скользящих средних
fast_ma = ta.sma(close, fast_length)
slow_ma = ta.sma(close, slow_length)

// Вычисление Ишимоку
tenkan_sen = ta.sma(high + low, tenkan_length) / 2
kijun_sen = ta.sma(high + low, kijun_length) / 2
senkou_span_a = (tenkan_sen + kijun_sen) / 2
senkou_span_b = ta.sma(close, senkou_length)

// Вычисление ADX
[diplus, diminus, adx_value] = ta.dmi(14, adx_length)

// Вычисление RSI
rsi_value = ta.rsi(close, rsi_length)

// Вычисление OBV
f_obv() => ta.cum(math.sign(ta.change(close)) * volume)
f_obv_1() => ta.cum(math.sign(ta.change(close[1])) * volume[1])
f_obv_2() => ta.cum(math.sign(ta.change(close[2])) * volume[2])
f_obv_3() => ta.cum(math.sign(ta.change(close[3])) * volume[3])
obv_value = f_obv()

price_is_up = close[1] > close[3]
price_crossover_fast_ma = close > fast_ma
fast_ma_is_up = ta.sma(close[1], fast_length) > ta.sma(close[3], fast_length)
rsi_is_trand_up = ta.rsi(close[1], rsi_length) > ta.rsi(close[3], rsi_length)
rsi_is_upper_50 = rsi_value > 50
obv_is_trand_up = f_obv_1() > f_obv_3() and obv_value > ta.sma(obv_value, obv_length)
is_up = price_is_up and price_crossover_fast_ma and fast_ma_is_up and rsi_is_trand_up and rsi_is_upper_50 and obv_is_trand_up

fast_ma_is_down = close < fast_ma
rsi_is_trend_down =  ta.rsi(close[1], rsi_length) < ta.rsi(close[2], rsi_length)
rsi_is_crossover_sma = rsi_value < ta.sma(rsi_value, rsi_length)
obv_is_trend_down =  f_obv_1() < f_obv_2()
obv_is_crossover_sma = obv_value < ta.sma(obv_value, obv_length)
is_down = fast_ma_is_down and rsi_is_trend_down and rsi_is_crossover_sma and obv_is_trend_down and obv_is_crossover_sma

//----------//
// MOMENTUM //
//----------//
ema8 = ta.ema(close, 8)
ema13 = ta.ema(close, 13)
ema21 = ta.ema(close, 21)
ema34 = ta.ema(close, 34)
ema55 = ta.ema(close, 55)

longEmaCondition = ema8 > ema13 and ema13 > ema21 and ema21 > ema34 and ema34 > ema55
exitLongEmaCondition = ema13 < ema55

shortEmaCondition = ema8 < ema13 and ema13 < ema21 and ema21 < ema34 and ema34 < ema55
exitShortEmaCondition = ema13 > ema55

// ----------  //
// OSCILLATORS //
// ----------- //
rsi = ta.rsi(close, 14)
longRsiCondition = rsi < 70 and rsi > 40
exitLongRsiCondition = rsi > 70

shortRsiCondition = rsi > 30 and rsi < 60
exitShortRsiCondition = rsi < 30

// Stochastic
length = 14, smoothK = 3, smoothD = 3
kFast = ta.stoch(close, high, low, 14)
dSlow = ta.sma(kFast, smoothD)

longStochasticCondition = kFast < 80
exitLongStochasticCondition = kFast > 95

shortStochasticCondition = kFast > 20
exitShortStochasticCondition = kFast < 5

// Логика входа и выхода
longCondition = longEmaCondition and longRsiCondition and longStochasticCondition and strategy.position_size == 0
exitLongCondition = (exitLongEmaCondition or exitLongRsiCondition or exitLongStochasticCondition) and strategy.position_size > 0

shortCondition = shortEmaCondition and shortRsiCondition and shortStochasticCondition and strategy.position_size == 0
exitShortCondition = (exitShortEmaCondition or exitShortRsiCondition or exitShortStochasticCondition) and strategy.position_size < 0

enter_long = (ta.crossover(close, senkou_span_a) or is_up) and longCondition
enter_short = (ta.crossunder(close, senkou_span_a) or is_down) and shortCondition

exit_long = ((ta.crossunder(fast_ma, slow_ma) or ta.crossunder(close, senkou_span_b) or enter_short) or exitLongCondition)
exit_short = ((ta.crossover(fast_ma, slow_ma) or ta.crossover(close, senkou_span_b) or enter_long) or exitShortCondition)

// Выполнение сделок
if is_long_enable == 1
    strategy.entry("Long", strategy.long, when=enter_long)
    strategy.close("Long", when=exit_long)

if is_short_enable == 1
    strategy.entry("Short", strategy.short, when=enter_short)
    strategy.close("Short", when=exit_short)
Published by ChaoZhang on the FMZ strategy square · last modified 2024-01-31. Collected in the Quant Trading Vault. Unvalidated research: re-test with your own data and costs before trusting it.
Build this with AgenKit
A spec is not a trading system. Paste this into your coding agent and AgenKit runs a specialist team — architecture, test-first build, risk gates, review — with paper trading on by default.
/agenkit build a production-grade trading bot with a backtest engine, risk controls and paper trading by default from strategies/Multi-factor-Quantitative-Trading-Strategy-440526.md- npx agenkit install engineering-kit in your project
- Paste the command into your agent and approve each phase
- Get tests, backtest, risk controls and a paper-trading switch
Understand it first
Before you run this, read the lesson behind the idea and how to backtest it honestly. Specs like this one are the survivors of an unknown number of trials; deflate their results accordingly.
Related specs
- Intraday Single Candle Indicator Combo Short Term Trading StrategyPine Script · Mean reversion · 1d
- Multi Indicator EMA StrategyPine Script · Mean reversion · 4h
- Advanced 15 Minute Chart Trading Signal StrategyPine Script · Mean reversion · 3h
- Johnys BOTPine Script · Mean reversion · 4h
- Bollinger Bands RSI MACD and Stochastic Multi indicator Fusion Trading StrategyPine Script · Mean reversion · 1d
- A Momentum Tracking Mean Reversion StrategyPine Script · Mean reversion · 1h