Strategy vault / Machine learning
Multi filter Bollinger Band Trading Strategy
The Multi-filter Bollinger Band Trading Strategy is a quantitative trading strategy that combines the Bollinger Band indicator, moving average indicator, RSI indicator and K-line graphical features for…
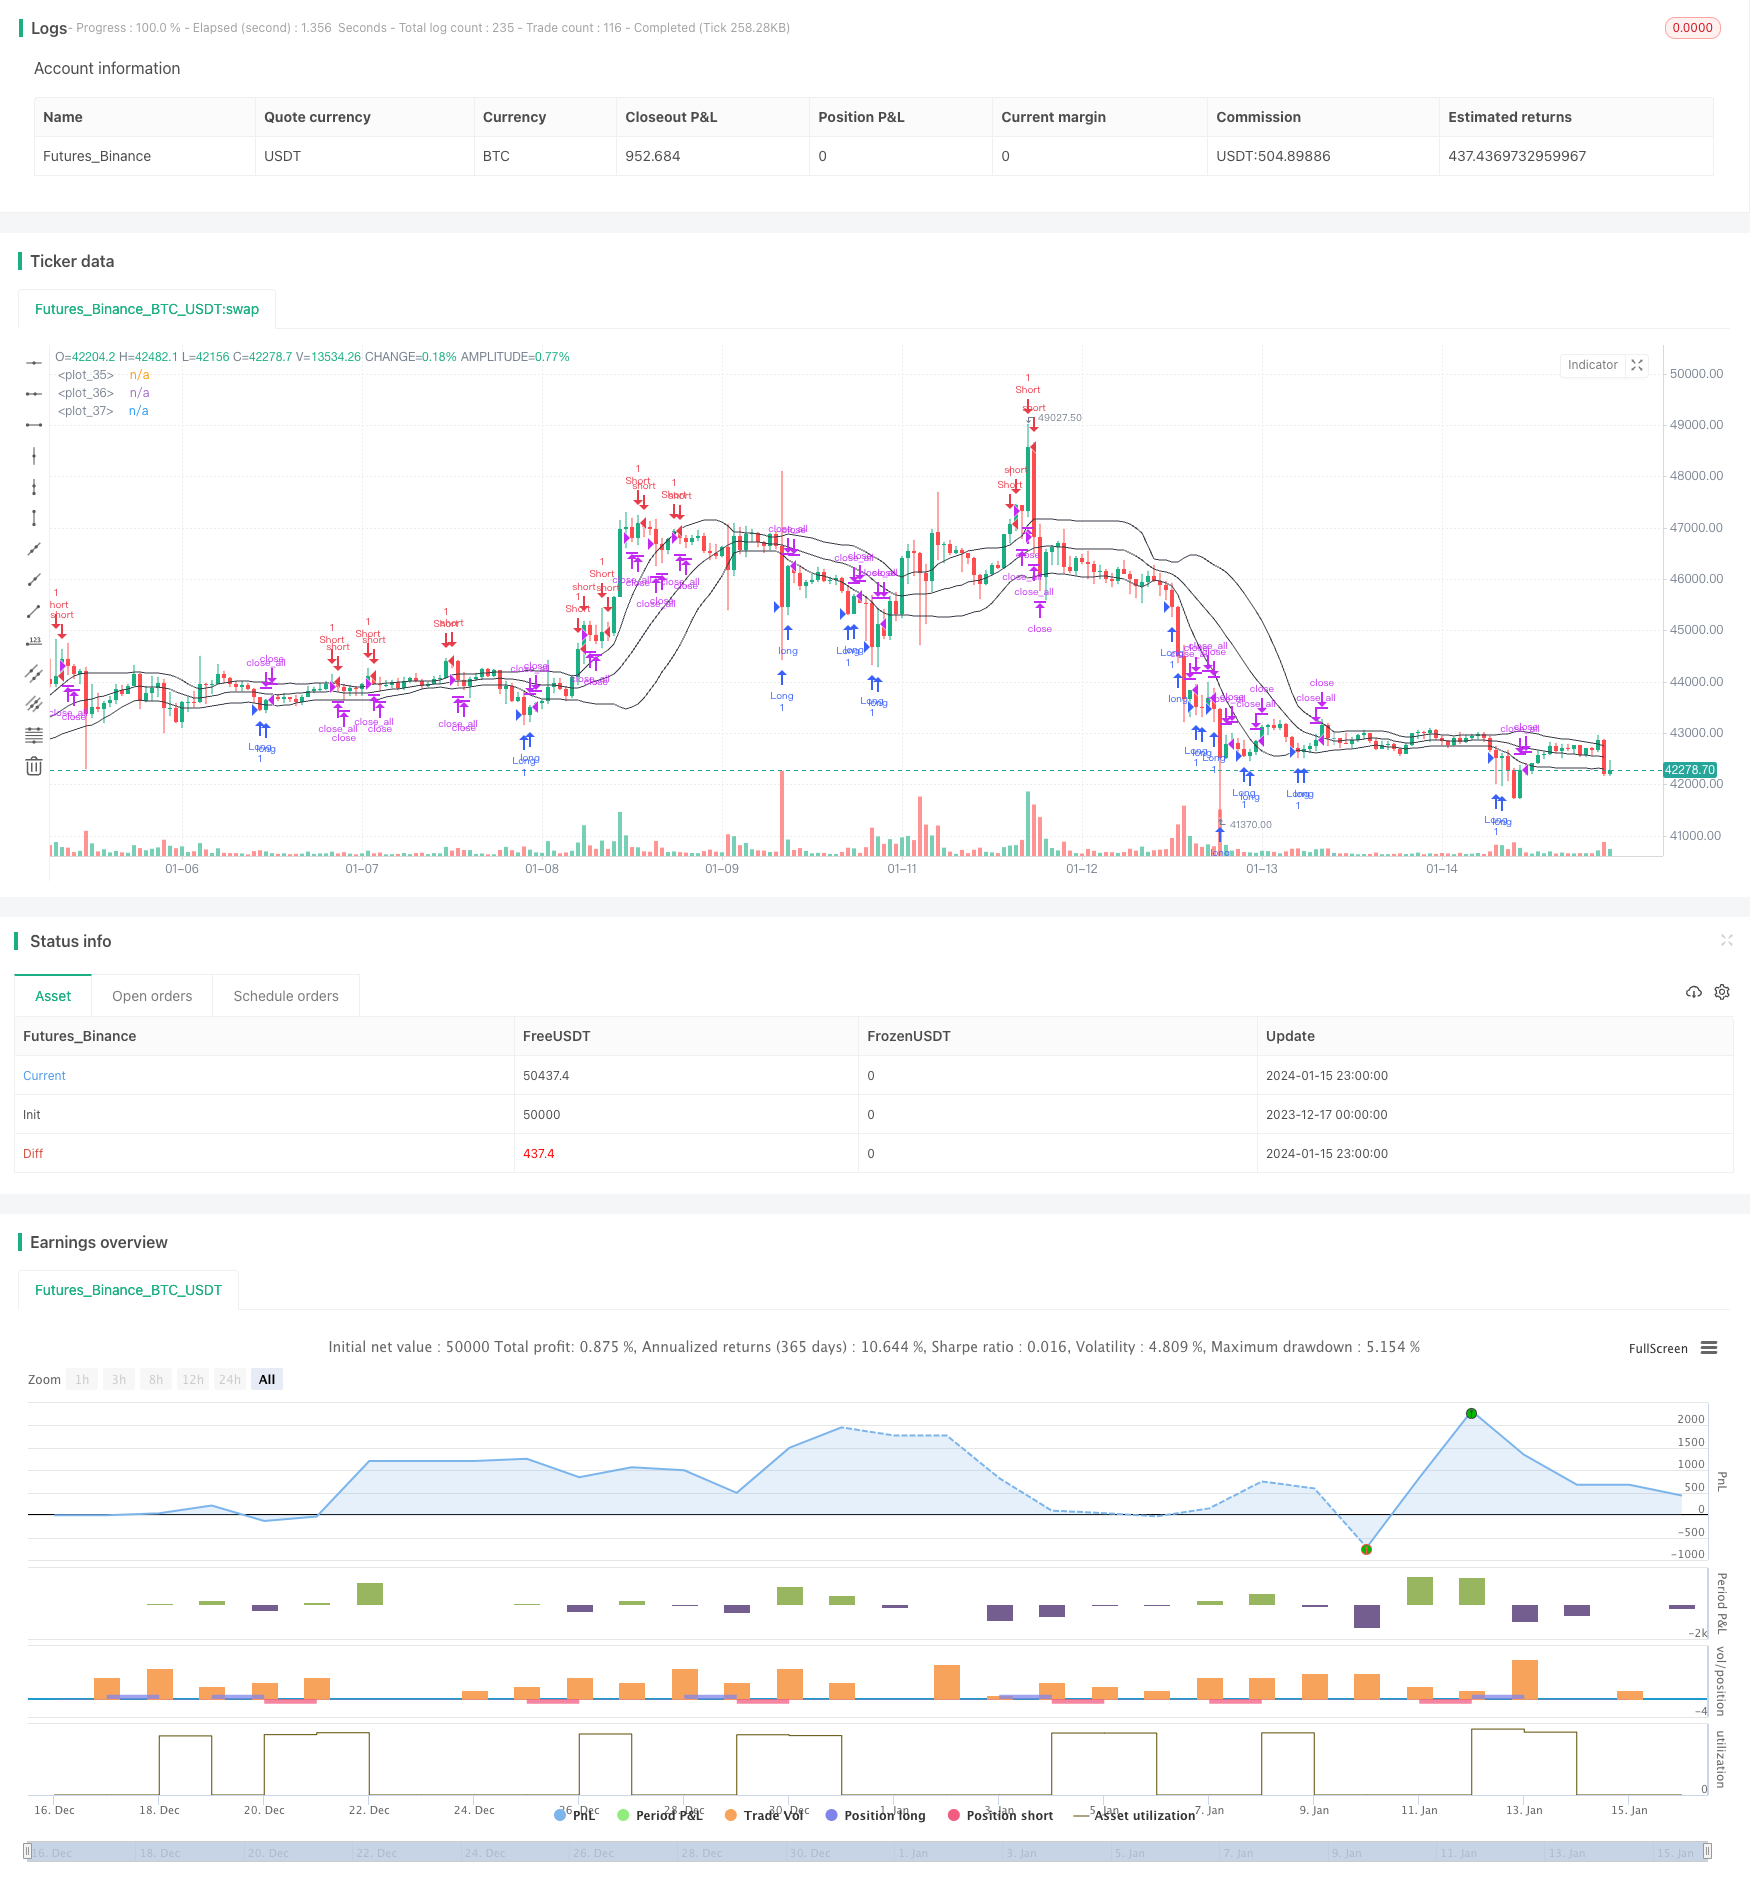
Overview
The Multi-filter Bollinger Band Trading Strategy is a quantitative trading strategy that combines the Bollinger Band indicator, moving average indicator, RSI indicator and K-line graphical features for multi-conditional screening to generate trading signals when conditions are met. It is a typical trend-following strategy that profits by capturing mid-to-long term price trend fluctuations.
Strategy Principle
Indicator Calculation
The strategy mainly uses three indicators: Bollinger Bands, moving average and RSI. Among them, the middle rail of Bollinger Bands is the n-day simple moving average of price, and the upper and lower rails are the middle rails +2 standard deviations and the middle rails -2 standard deviations respectively. The RSI indicator is a value between 0 and 100 calculated based on the rise/fall range over a certain period of time.
Trading Signals
The strategy generates trading signals through the following three main conditions:
(1) Bollinger lower-band breakout & K-line body contradiction. When the closing price breaks through the lower band upwards and the color of the K-line body contradicts the current trend direction, go long.
(2) Bollinger upper-band breakout & K-line body contradiction. When the closing price breaks through the upper band downwards and the color of the K-line body contradicts the current trend direction, go short.
(3) K-line body reversal. If the position direction is consistent with the K-line body color reversal, close the position.
In addition, the strategy also sets moving average filters, K-line body filters, RSI filters and other auxiliary conditions to strictly control entry.
Advantage Analysis
- Multiple strict conditions control can reduce the risk of false breakouts
- Trend tracking method reduces trading frequency
- RSI indicator assists in avoiding reversal traps
Risk Analysis
- Improper Bollinger parameter settings may result in few signals
- Failed breakouts can cause greater losses
- Lower trading frequency may miss some trading opportunities
Risks can be reduced by adjusting Bollinger parameters and strictly controlling stops.
Optimization Directions
- Test strategy performance under different parameters to find optimal parameters
- Add machine learning algorithms to automatically optimize parameters
- Add more factors and filters to improve strategy stability
Summary
Overall, this strategy is a typical mid-to-long term trend following strategy. By multi-conditional screening and strictly controlling entry and exit timing with a trend trading approach, it can reduce unnecessary trading and capture mid-to-long term market trends. There is still great room for optimizing this strategy by adjusting parameters, adding more auxiliary tools and so on, to further enhance the stability and profitability of the strategy.
Parameters
| Name | Default | What it controls |
|---|---|---|
| v_input_1 | true | Long |
| v_input_2 | false | Short |
| v_input_3 | 20 | Bollinger Length |
| v_input_4 | true | Bollinger Mult |
| v_input_5_ohlc4 | 0 | Bollinger Source: ohlc4 | high | low | open | hl2 | hlc3 | hlcc4 | close |
| v_input_6 | true | Use body-filter |
| v_input_7 | true | Use color-filter |
| v_input_8 | true | Use RSI-filter |
| v_input_9 | 1900 | From Year |
| v_input_10 | 2100 | To Year |
| v_input_11 | true | From Month |
| v_input_12 | 12 | To Month |
| v_input_13 | true | From day |
| v_input_14 | 31 | To day |
| v_input_15 | true | Show Bollinger Bands |
Source Pine Script
/*backtest
start: 2023-12-17 00:00:00
end: 2024-01-16 00:00:00
period: 1h
basePeriod: 15m
exchanges: [{"eid":"Futures_Binance","currency":"BTC_USDT"}]
*/

//Noro
//2018

//@version=3
strategy("Noro's Bollinger Strategy v1.4", shorttitle = "Bollinger str 1.4", overlay = true )

//Settings
needlong = input(true, defval = true, title = "Long")
needshort = input(false, defval = false, title = "Short")

length = input(20, defval = 20, minval = 1, maxval = 1000, title = "Bollinger Length")
mult = input(1, defval = 1, minval = 0.001, maxval = 50, title = "Bollinger Mult")
source = input(ohlc4, defval = ohlc4, title = "Bollinger Source")

usebf = input(true, defval = true, title = "Use body-filter")
usecf = input(true, defval = true, title = "Use color-filter")
userf = input(true, defval = true, title = "Use RSI-filter")

fromyear = input(1900, defval = 1900, minval = 1900, maxval = 2100, title = "From Year")
toyear = input(2100, defval = 2100, minval = 1900, maxval = 2100, title = "To Year")
frommonth = input(01, defval = 01, minval = 01, maxval = 12, title = "From Month")
tomonth = input(12, defval = 12, minval = 01, maxval = 12, title = "To Month")
fromday = input(01, defval = 01, minval = 01, maxval = 31, title = "From day")
today = input(31, defval = 31, minval = 01, maxval = 31, title = "To day")
showbands = input(true, defval = true, title = "Show Bollinger Bands")

//Bollinger Bands
basis = sma(source, length)
dev = mult * stdev(source, length)
upper = basis + dev
lower = basis - dev

//Lines
col = showbands ? black : na
plot(upper, linewidth = 1, color = col)
plot(basis, linewidth = 1, color = col)
plot(lower, linewidth = 1, color = col)

//Body filter
nbody = abs(close - open)
abody = sma(nbody, 10)
body = nbody > abody / 2 or usebf == false

//Color filter
bar = close > open ? 1 : close < open ? -1 : 0
gb = bar == 1 or usecf == false
rb = bar == -1 or usecf == false

//RSI Filter
fastup = rma(max(change(close), 0), 7)
fastdown = rma(-min(change(close), 0), 7)
rsi = fastdown == 0 ? 100 : fastup == 0 ? 0 : 100 - (100 / (1 + fastup / fastdown))
ursi = rsi > 70 or userf == false
drsi = rsi < 30 or userf == false

//Signals
up = close <= lower and rb and body and drsi and (close < strategy.position_avg_price or strategy.position_size == 0)
dn = close >= upper and gb and body and ursi and (close > strategy.position_avg_price or strategy.position_size == 0)
exit = ((strategy.position_size > 0 and close > open) or (strategy.position_size < 0 and close < open)) and body

//Trading
if up
    strategy.entry("Long", strategy.long, needlong == false ? 0 : na)

if dn
    strategy.entry("Short", strategy.short, needshort == false ? 0 : na)

if  exit
strategy.close_all()Published by ChaoZhang on the FMZ strategy square · last modified 2024-01-17. Collected in the Quant Trading Vault. Unvalidated research: re-test with your own data and costs before trusting it.
Build this with AgenKit
A spec is not a trading system. Paste this into your coding agent and AgenKit runs a specialist team — architecture, test-first build, risk gates, review — with paper trading on by default.
/agenkit build a production-grade trading bot with a backtest engine, risk controls and paper trading by default from strategies/Multi-filter-Bollinger-Band-Trading-Strategy.md- npx agenkit install engineering-kit in your project
- Paste the command into your agent and approve each phase
- Get tests, backtest, risk controls and a paper-trading switch
Understand it first
Before you run this, read the lesson behind the idea and how to backtest it honestly. Specs like this one are the survivors of an unknown number of trials; deflate their results accordingly.
Related specs
- Configurable BBRSIAroon Strategy BacktestPine Script · Machine learning · 5m
- EMA and RSI Quantitative Trading StrategyPine Script · Machine learning · 1h
- High Frequency Hybrid Technical Analysis Quantitative StrategyPine Script · Machine learning · 15m
- Triple Moving Average Combined with MACD Quantitative StrategyPine Script · Machine learning · 1d
- London MACD RSI Bitcoin Trading StrategyPine Script · Machine learning · 1m
- Multi indicator Assisted StrategyPine Script · Machine learning · 1d