Strategy vault / Trend following
Multi Indicator Adaptive Trend Following Strategy
This is an adaptive trend following strategy that combines multiple technical indicators. The strategy integrates the UT Bot alert system, Relative Strength Index (RSI) filter, non-repainting ATR trailing stop, and…
Overview
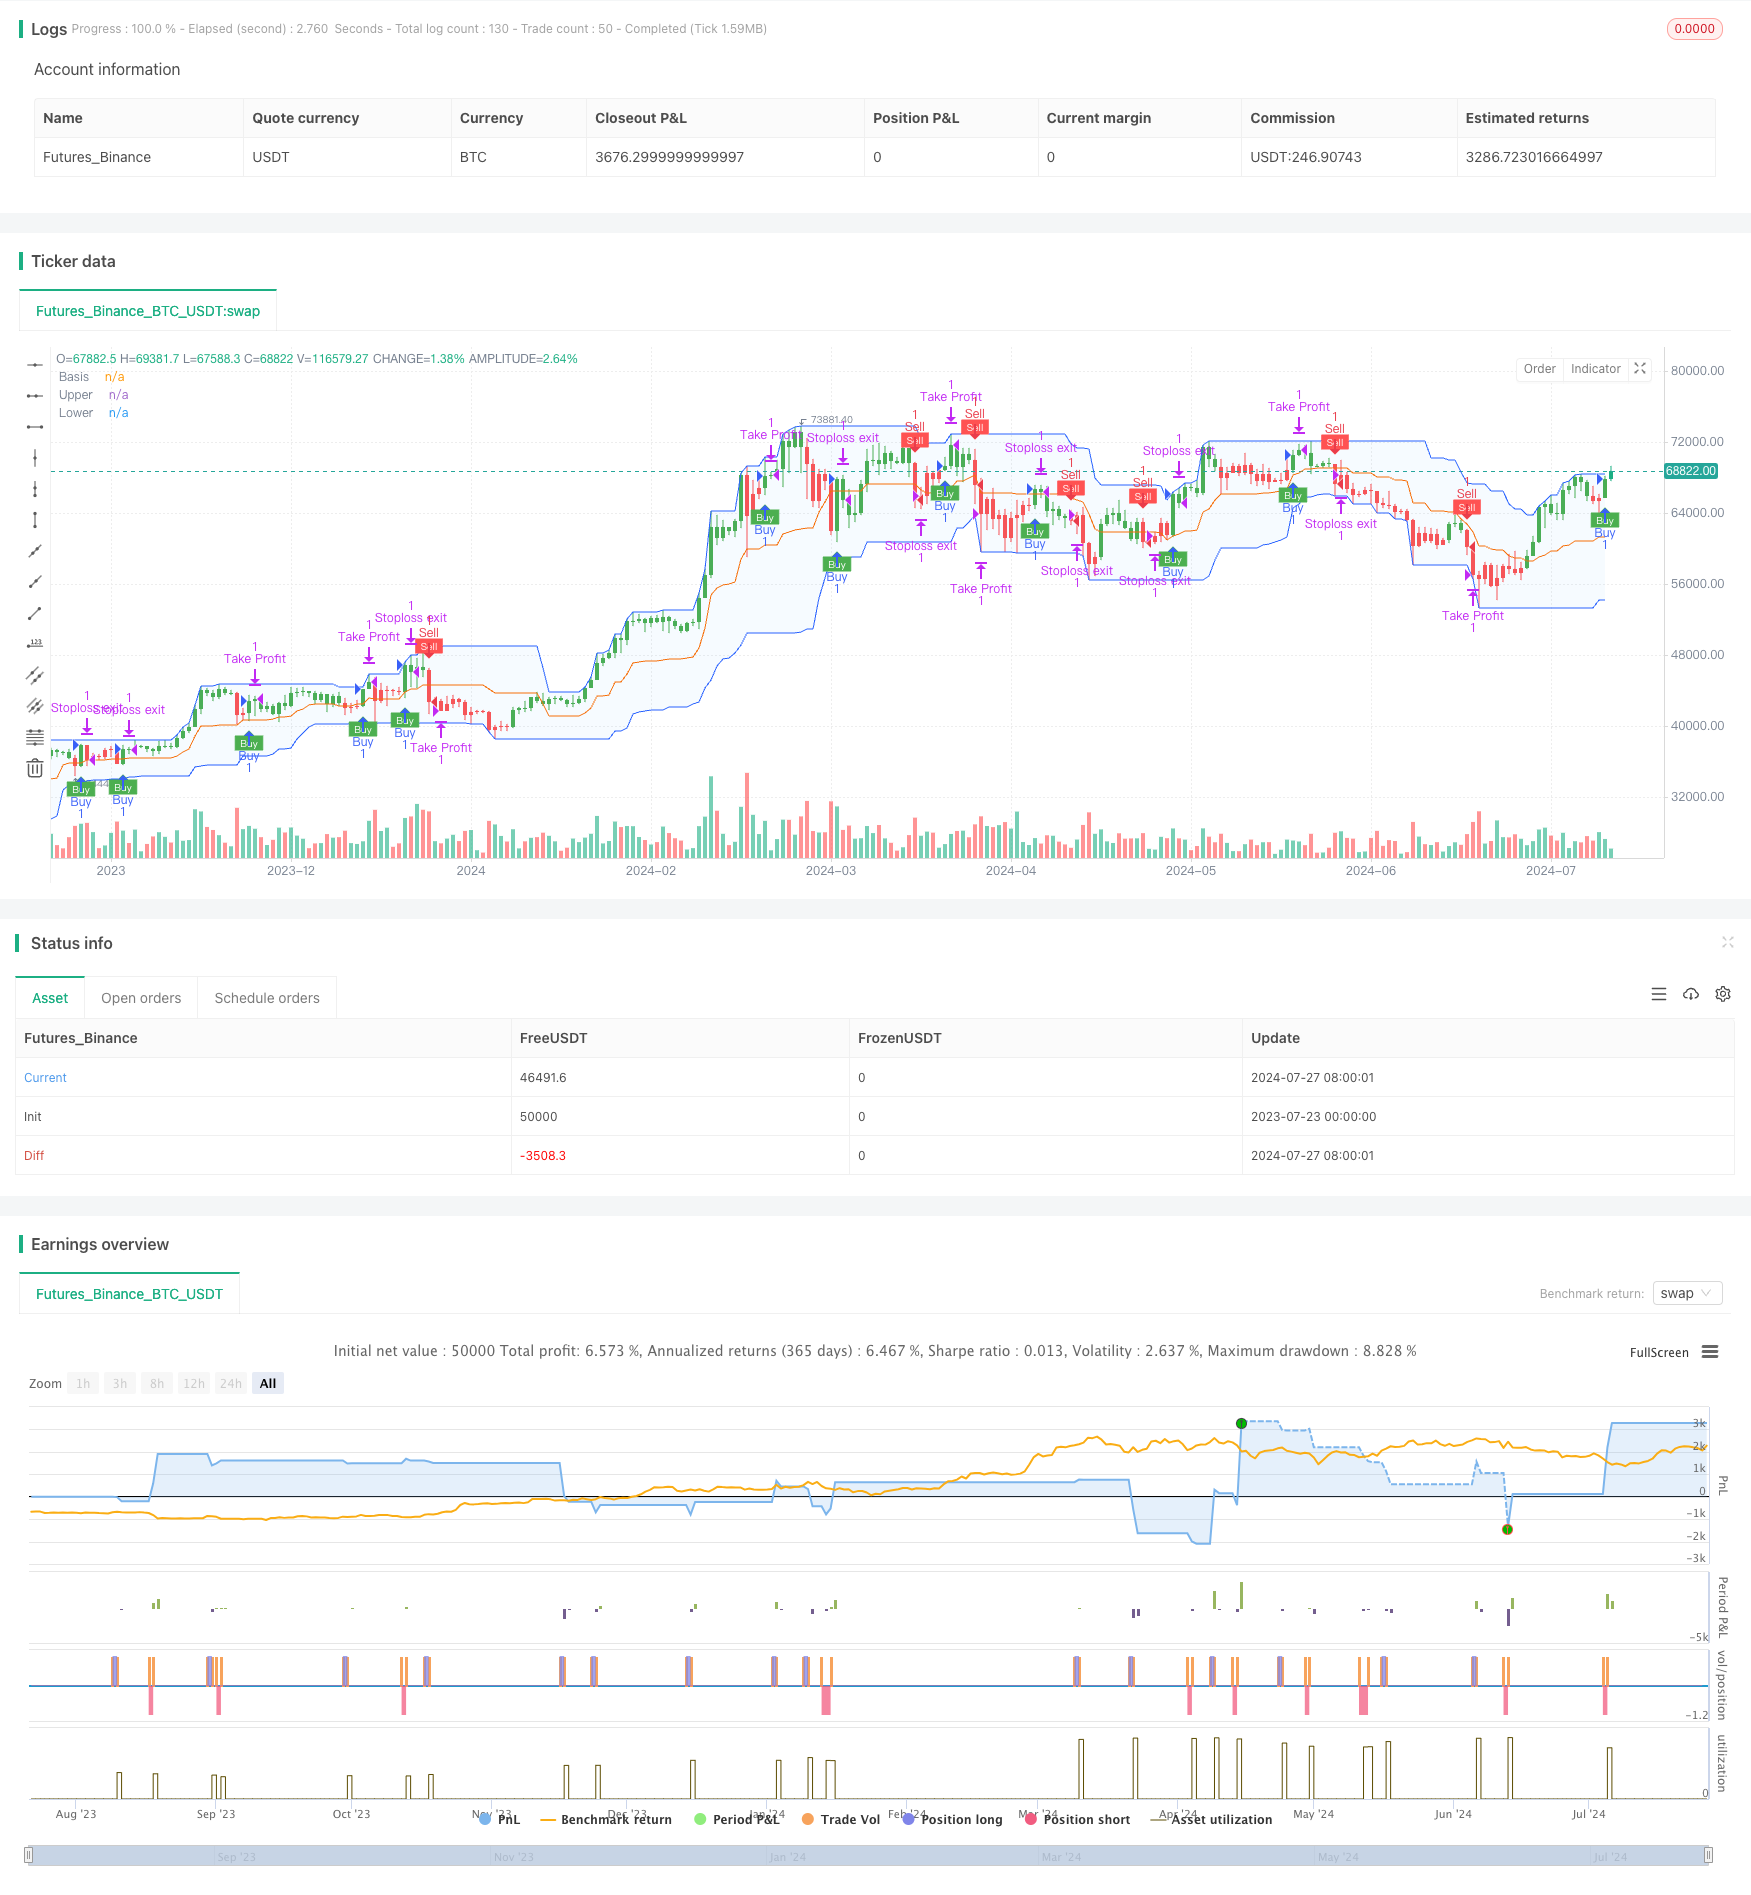
This is an adaptive trend following strategy that combines multiple technical indicators. The strategy integrates the UT Bot alert system, Relative Strength Index (RSI) filter, non-repainting ATR trailing stop, and Donchian Channel. It operates on a 15-minute timeframe, utilizes Heikin Ashi candles for improved signal accuracy, and incorporates percentage-based exit targets.
The core of this strategy lies in its use of multiple indicators to identify and follow market trends while providing flexible risk management mechanisms. It combines market information from multiple dimensions including momentum (RSI), volatility (ATR), and trend (Donchian Channel) to achieve more comprehensive and robust trading decisions.
Strategy Principles
ATR Trailing Stop: Uses Average True Range (ATR) to calculate dynamic stop-loss levels, providing adaptive risk control.
RSI Filter: Employs the Relative Strength Index (RSI) to confirm trend direction, enhancing the reliability of entry signals.
Donchian Channel: Serves as an additional trend confirmation tool, helping to identify overall market direction.
Entry Conditions:
- Long: Price crosses above ATR trailing stop, RSI is above 50, price is above Donchian Channel midline.
- Short: Price crosses below ATR trailing stop, RSI is below 50, price is below Donchian Channel midline.
Exit Mechanism: Sets percentage-based profit targets and stop-loss levels.
Optional Heikin Ashi Candles: Used to smooth price data and reduce false signals.
Strategy Advantages
Multi-dimensional Analysis: Combines trend, momentum, and volatility indicators for comprehensive market insights.
High Adaptability: ATR trailing stop automatically adjusts to market volatility, adapting to different market environments.
Robust Risk Management: Clear stop-loss and profit targets effectively control risk.
Enhanced Signal Quality: Dual confirmation through RSI and Donchian Channel reduces false signals.
Flexibility: Option to use Heikin Ashi candles adapts to different trading styles.
Non-repainting: ATR trailing stop calculation ensures signal reliability and consistency.
Strategy Risks
Sideways Market Performance: May generate frequent false signals in range-bound or choppy markets.
Latency: Multiple confirmation mechanisms may lead to slightly delayed entries.
Over-optimization Risk: Numerous parameters can easily lead to overfitting historical data.
Market Environment Dependency: May underperform in rapidly reversing markets.
Execution Slippage: Percentage-based exits may face execution challenges in highly volatile markets.
Strategy Optimization Directions
Dynamic Parameter Adjustment: Implement automatic optimization of key parameters (e.g., RSI threshold, ATR multiplier).
Market Regime Recognition: Add judgment of different market states (trending, ranging) to dynamically adjust the strategy.
Timeframe Synergy: Combine signals from multiple timeframes to enhance decision robustness.
Volatility Filter: Pause trading in extremely low volatility environments to avoid ineffective signals.
Enhanced Exit Mechanism: Introduce trailing stops or time-based exit rules to optimize profit management.
Incorporate Volume Analysis: Integrate volume indicators to further confirm trend strength.
Machine Learning Integration: Use machine learning algorithms to optimize parameter selection and signal generation.
Summary
This multi-indicator adaptive trend following strategy demonstrates the advantages of systematic and multi-dimensional analysis in quantitative trading. By integrating multiple indicators such as ATR, RSI, UT Bot, and Donchian Channel, the strategy captures market dynamics from different angles, providing relatively comprehensive and robust trading signals. Its adaptive features and well-designed risk management mechanisms offer good adaptability and stability.
However, the complexity of the strategy also brings potential risks such as overfitting and parameter sensitivity. Future optimization should focus on improving the strategy's adaptability and robustness, such as introducing advanced features like dynamic parameter adjustment and market state recognition. Meanwhile, attention should be paid to maintaining the strategy's simplicity and interpretability to avoid decreased stability due to excessive complexity.
Overall, this strategy provides a comprehensive and insightful framework for trend following. Through continuous optimization and prudent application, it has the potential to become an effective trading tool.
Source Pine Script
/*backtest
start: 2023-07-23 00:00:00
end: 2024-07-28 00:00:00
period: 1d
basePeriod: 1h
exchanges: [{"eid":"Futures_Binance","currency":"BTC_USDT"}]
*/

//@version=5
strategy("UT Bot Alerts - Non-Repainting with RSI Filter and Donchian Channels", overlay=true)

// Inputs for UT Bot
a = input.int(1, title="Key Value. 'This changes the sensitivity'")
c = input.int(10, title="ATR Period")
h = input.bool(false, title="Signals from Heikin Ashi Candles")
percentage = input.float(0.002, title="Percentage for Exit (0.2% as decimal)")

// RSI Inputs
rsiPeriod = input.int(14, title="RSI Period")
rsiSource = input.source(close, title="RSI Source")

// ATR Calculation
xATR = ta.atr(c)
nLoss = a * xATR

// Heikin Ashi Calculation
haClose = request.security(syminfo.tickerid, timeframe.period, close, lookahead=barmerge.lookahead_on)
haOpen = request.security(syminfo.tickerid, timeframe.period, open, lookahead=barmerge.lookahead_on)
haHigh = request.security(syminfo.tickerid, timeframe.period, high, lookahead=barmerge.lookahead_on)
haLow = request.security(syminfo.tickerid, timeframe.period, low, lookahead=barmerge.lookahead_on)
haCloseSeries = (haOpen + haHigh + haLow + haClose) / 4

src = h ? haCloseSeries : close

// RSI Calculation
rsiValue = ta.rsi(rsiSource, rsiPeriod)

// Non-repainting ATR Trailing Stop Calculation
var float xATRTrailingStop = na
if (barstate.isconfirmed)
    xATRTrailingStop := src > nz(xATRTrailingStop[1], 0) and src[1] > nz(xATRTrailingStop[1], 0) ? math.max(nz(xATRTrailingStop[1]), src - nLoss) : src < nz(xATRTrailingStop[1], 0) and src[1] < nz(xATRTrailingStop[1], 0) ? math.min(nz(xATRTrailingStop[1]), src + nLoss) : src > nz(xATRTrailingStop[1], 0) ? src - nLoss : src + nLoss

// Position Calculation
var int pos = 0
if (barstate.isconfirmed)
    pos := src[1] < nz(xATRTrailingStop[1], 0) and src > nz(xATRTrailingStop[1], 0) ? 1 : src[1] > nz(xATRTrailingStop[1], 0) and src < nz(xATRTrailingStop[1], 0) ? -1 : nz(pos[1], 0)

xcolor = pos == -1 ? color.red : pos == 1 ? color.green : color.blue

ema = ta.ema(src, 1)
above = ta.crossover(ema, xATRTrailingStop)
below = ta.crossover(xATRTrailingStop, ema)

// Track entry prices
var float entryPrice = na

// Donchian Channels
length = input.int(20, minval = 1, title="Donchian Channels Length")
offset = input.int(0, title="Donchian Channels Offset")
lower = ta.lowest(length)
upper = ta.highest(length)
basis = math.avg(upper, lower)
plot(basis, "Basis", color = #FF6D00, offset = offset)
u = plot(upper, "Upper", color = #2962FF, offset = offset)
l = plot(lower, "Lower", color = #2962FF, offset = offset)
fill(u, l, color = color.rgb(33, 150, 243, 95), title = "Background")

// Buy and sell conditions with RSI filter and basis condition
buy = src > xATRTrailingStop and above and barstate.isconfirmed and rsiValue > 50 and src > basis
sell = src < xATRTrailingStop and below and barstate.isconfirmed and rsiValue < 50 and src < basis

// Calculate target prices for exit
var float buyTarget = na
var float sellTarget = na

if (buy)
    entryPrice := src
    buyTarget := entryPrice * (1 + percentage)
    sellTarget := entryPrice * (1 - percentage)
    strategy.entry("Buy", strategy.long)

if (sell)
    entryPrice := src
    buyTarget := entryPrice * (1 + percentage)
    sellTarget := entryPrice * (1 - percentage)
    strategy.entry("Sell", strategy.short)

// Exit conditions
var bool buyExit = false
var bool sellExit = false
var bool stopLossExit = false

if (strategy.position_size > 0 and barstate.isconfirmed)
    if (src >= buyTarget)
        strategy.exit("Take Profit", "Buy", limit=buyTarget)
        buyExit := true
    if (src <= sellTarget)
        strategy.exit("Stoploss exit", "Buy", stop=src)
        stopLossExit := true

if (strategy.position_size < 0 and barstate.isconfirmed)
    if (src <= sellTarget)
        strategy.exit("Take Profit", "Sell", limit=sellTarget)
        sellExit := true
    if (src >= buyTarget)
        strategy.exit("Stoploss exit", "Sell", stop=src)
        stopLossExit := true

// Plotting
plotshape(buy, title="Buy", text='Buy', style=shape.labelup, location=location.belowbar, color=color.green, textcolor=color.white, size=size.tiny)
plotshape(sell, title="Sell", text='Sell', style=shape.labeldown, location=location.abovebar, color=color.red, textcolor=color.white, size=size.tiny)

barcolor(src > xATRTrailingStop ? color.green : na)
barcolor(src < xATRTrailingStop ? color.red : na)

alertcondition(buy, "UT Long", "UT Long")
alertcondition(sell, "UT Short", "UT Short")
alertcondition(buyExit, "UT Long Exit", "UT Long Exit")
alertcondition(sellExit, "UT Short Exit", "UT Short Exit")
alertcondition(stopLossExit, "Stoploss exit", "Stoploss exit")
Published by ChaoZhang on the FMZ strategy square · last modified 2024-07-29. Collected in the Quant Trading Vault. Unvalidated research: re-test with your own data and costs before trusting it.
Build this with AgenKit
A spec is not a trading system. Paste this into your coding agent and AgenKit runs a specialist team — architecture, test-first build, risk gates, review — with paper trading on by default.
/agenkit build a production-grade trading bot with a backtest engine, risk controls and paper trading by default from strategies/Multi-Indicator-Adaptive-Trend-Following-Strategy.md- npx agenkit install engineering-kit in your project
- Paste the command into your agent and approve each phase
- Get tests, backtest, risk controls and a paper-trading switch
Understand it first
Before you run this, read the lesson behind the idea and how to backtest it honestly. Specs like this one are the survivors of an unknown number of trials; deflate their results accordingly.
Related specs
- ATR RSI Enhanced Trend Following Trading SystemPine Script · Trend following
- Dynamic ATR Trailing Stop with EMA Cross Combination StrategyPine Script · Trend following · 2h
- SuperTrend Trailing Stop Strategy Based on Heikin AshiPine Script · Trend following · 4h
- TrendHunter w MF Multi Timeframe Trend StrategyPine Script · Trend following · 1h
- Five EMA RSI Trend Following Dynamic Channel Trading SystemPine Script · Trend following · 1d
- Multiple Timeframe Filtered Trend Following StrategyPine Script · Trend following · 1h