Multi Indicator ATR Trailing Stop Smart Trading Strategy
This is an intelligent trading strategy that combines multiple technical indicators, primarily based on the ATR indicator for trailing stop loss functionality. The strategy integrates JLines Cloud, volume analysis…
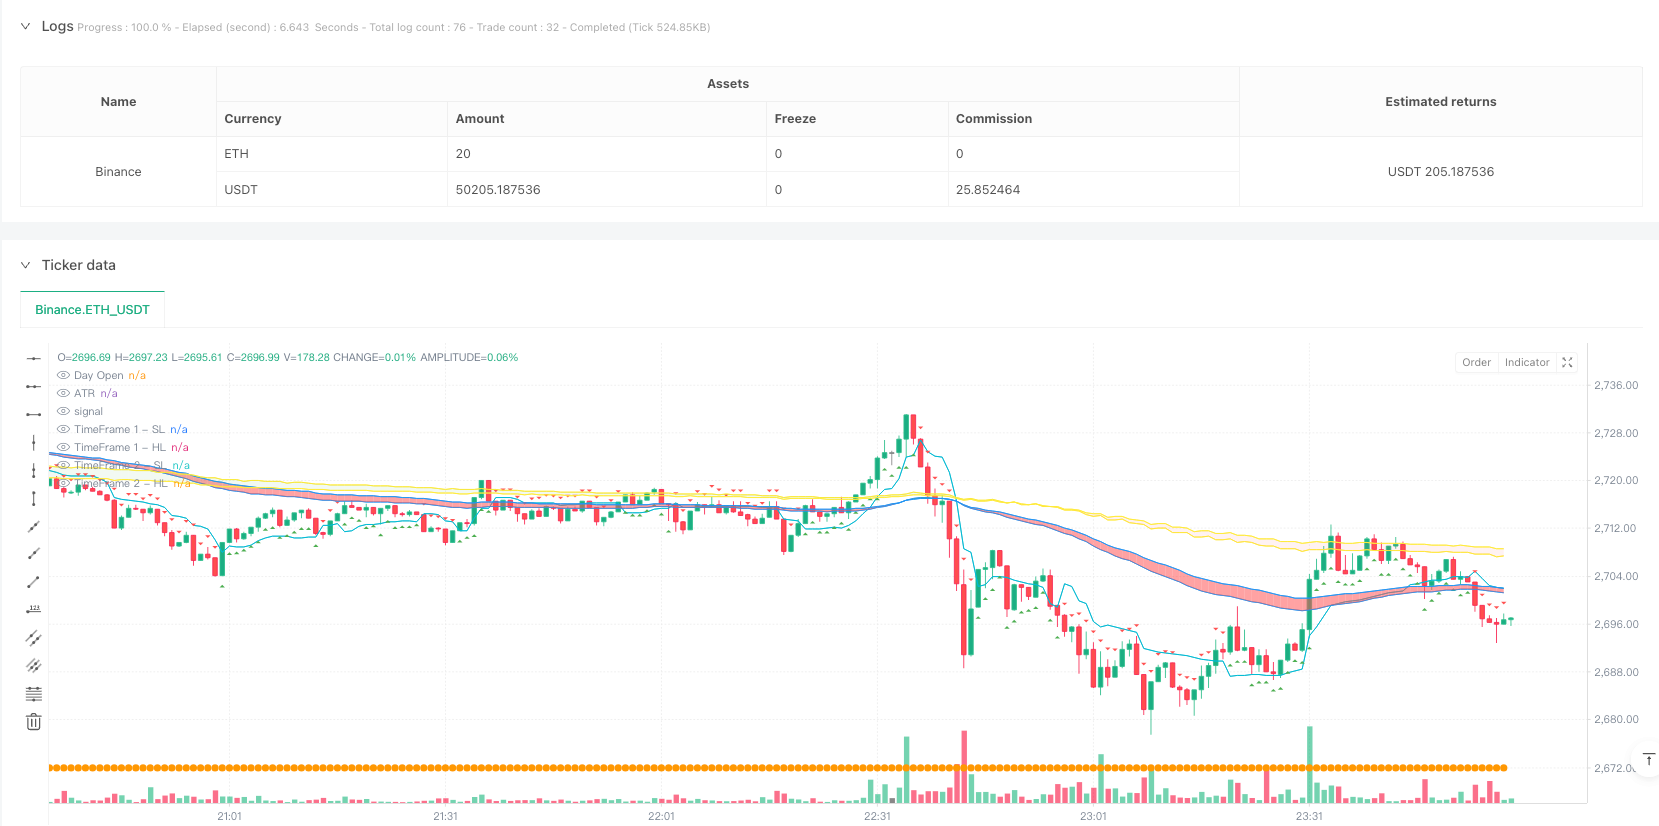
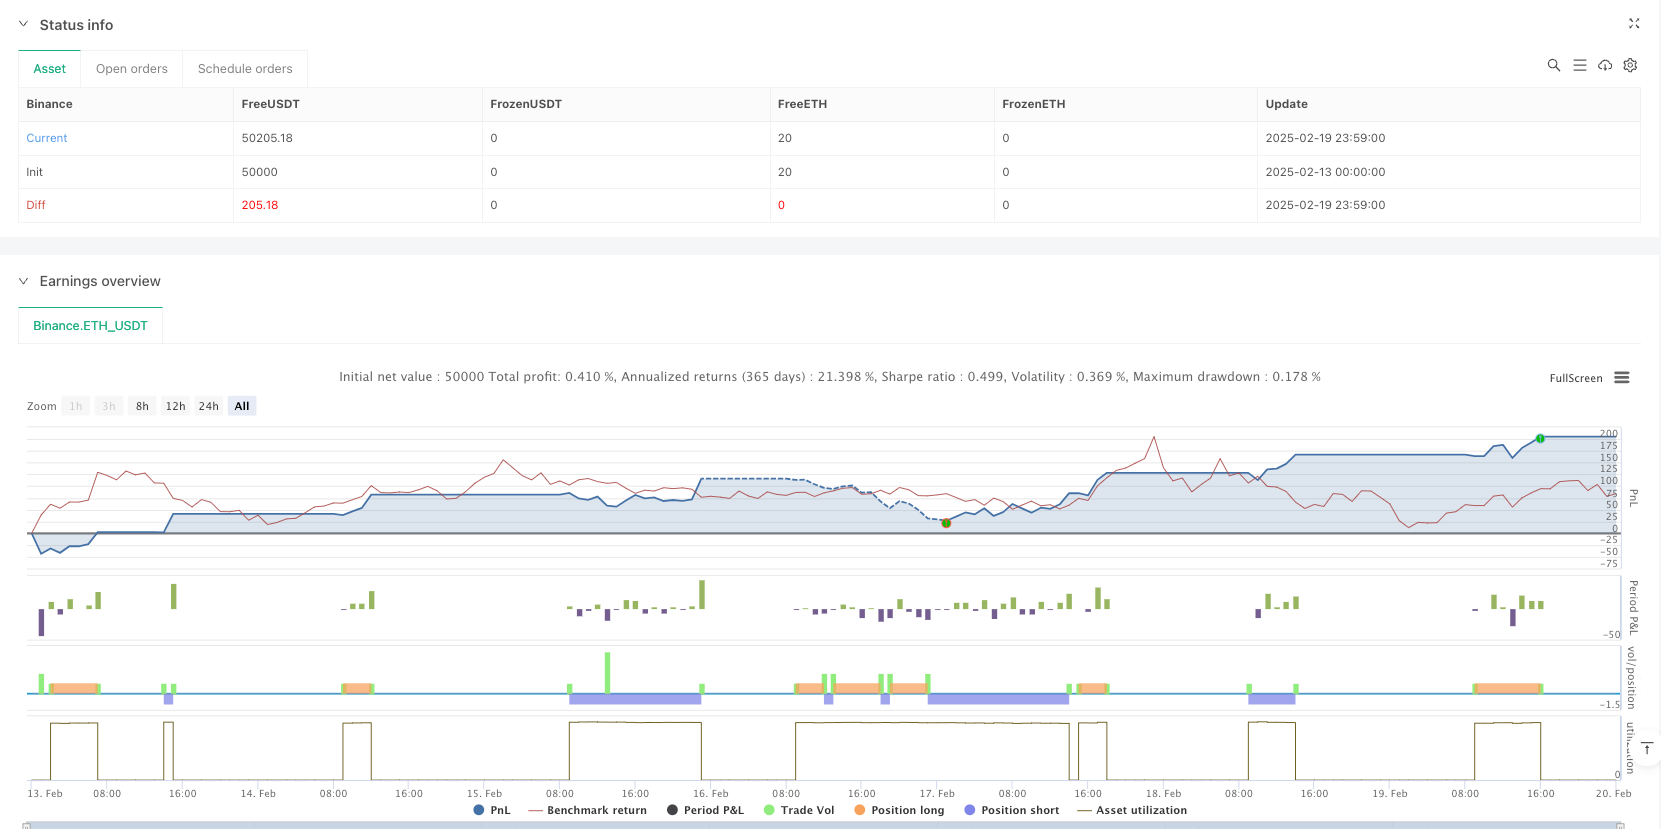
Overview
This is an intelligent trading strategy that combines multiple technical indicators, primarily based on the ATR indicator for trailing stop loss functionality. The strategy integrates JLines Cloud, volume analysis, and daily opening price among other multi-dimensional analytical indicators, particularly suitable for trading on 3-minute and 5-minute timeframes. The strategy dynamically adjusts stop-loss positions through ATR while using moving average systems to determine trend direction, creating a comprehensive trading decision system.
Strategy Principles
The core of the strategy is a trailing stop system built on the ATR (Average True Range) indicator. It uses a 10-period ATR with a 2x ATR multiplier to calculate dynamic stop lines. It also incorporates the JLines Cloud system (72/89 EMA combination) across two timeframes, plus an optional 5/15 EMA system. Trade signals are generated based on:
- ATR trailing stop line breakouts
- Consistent trends across both timeframe JLines Clouds
- Price position relative to daily opening price
- Confirmation from unusual volume activity
Strategy Advantages
- Dynamic Stop Protection - Self-adapts to market volatility through ATR indicator
- Multi-dimensional Trend Confirmation - Improves trend judgment accuracy using different timeframe moving average combinations
- Volume Verification - Enhances trade confirmation through unusual volume analysis
- Comprehensive Risk Management - Includes dual protection mechanism with fixed stops and profit targets
- High Adaptability - Parameters can be adjusted for different market conditions
Strategy Risks
- Parameter Sensitivity - ATR period and multiplier choices significantly impact strategy performance
- Market Condition Dependency - May generate frequent false signals in ranging markets
- Multiple Condition Restrictions - Strict entry conditions might lead to missed trading opportunities
- Slippage Impact - Actual execution prices may significantly deviate from signal prices during high volatility
Strategy Optimization Directions
- Dynamic Parameter Adjustment - Automatically adjust ATR parameters based on market volatility
- Time Filters - Add trading time filters to avoid high volatility periods at market open and close
- Trend Strength Filtering - Introduce trend strength indicators to improve trend judgment accuracy
- Risk Management Optimization - Implement dynamic profit/loss ratios for different market environments
- Enhanced Volume Analysis - Refine volume analysis methods to improve trade confirmation accuracy
Summary
This is a complete trading system that integrates multiple technical indicators, providing core risk management through ATR trailing stops while utilizing moving average clouds and volume analysis for trade confirmation. The strategy's strength lies in its comprehensive market analysis framework and robust risk management system, though parameter optimization is needed for specific market environments. Through the suggested optimization directions, the strategy's stability and profitability can be further enhanced.
Source Pine Script
/*backtest
start: 2025-02-13 00:00:00
end: 2025-02-20 00:00:00
period: 1m
basePeriod: 1m
exchanges: [{"eid":"Binance","currency":"ETH_USDT"}]
*/

//@version=6
strategy("AI trade Roney nifty value", overlay=true)

// User Inputs
atrPeriod = input.int(10, "ATR Period")
atrMultiplier = input.float(2, "ATR Multiplier")
target = input.float(40, "Target")
stopLoss = input.float(40, "Stop Loss")

// Calculate ATR-based trailing stop
atr = ta.atr(atrPeriod)
nLoss = atrMultiplier * atr
var float xATRTrailingStop = na

if na(xATRTrailingStop)
    xATRTrailingStop := close - nLoss
else
    if close > xATRTrailingStop[1] and close[1] > xATRTrailingStop[1]
        xATRTrailingStop := math.max(xATRTrailingStop[1], close - nLoss)
    else if close < xATRTrailingStop[1] and close[1] < xATRTrailingStop[1]
        xATRTrailingStop := math.min(xATRTrailingStop[1], close + nLoss)
    else
        xATRTrailingStop := close > xATRTrailingStop[1] ? close - nLoss : close + nLoss

// Define position and entry/exit prices
var int pos = na
pos := close[1] < xATRTrailingStop[1] and close > xATRTrailingStop[1] ? 1 :
       close[1] > xATRTrailingStop[1] and close < xATRTrailingStop[1] ? -1 : pos[1]

var bool isLong = false
var bool isShort = false

var float entryPrice = na
var float exitPrice = na
var float exitStop = na

// JLines Cloud indicator
sl = input.int(72, "Smaller length")
hl = input.int(89, "Higher length")

res = input.timeframe("1", "JLines - Time Frame 1")
res1 = input.timeframe("3", "JLines - Time Frame 2")
enable515 = input.bool(false, "5/15 EMA")
res2 = input.timeframe("5", "5/15 EMA")

ema1_72 = request.security(syminfo.tickerid, res, ta.ema(close, sl))
ema1_89 = request.security(syminfo.tickerid, res, ta.ema(close, hl))
ema2_72 = request.security(syminfo.tickerid, res1, ta.ema(close, sl))
ema2_89 = request.security(syminfo.tickerid, res1, ta.ema(close, hl))
ema3_5 = request.security(syminfo.tickerid, res2, ta.ema(close, 5))
ema3_15 = request.security(syminfo.tickerid, res2, ta.ema(close, 15))

// Plot JLines Cloud
p1_1 = plot(ema1_72, "TimeFrame 1 - SL", color=color.blue, display=display.none)
p1_2 = plot(ema1_89, "TimeFrame 1 - HL", color=color.blue, display=display.none)
p2_1 = plot(ema2_72, "TimeFrame 2 - SL", color=color.yellow, display=display.none)
p2_2 = plot(ema2_89, "TimeFrame 2 - HL", color=color.yellow, display=display.none)
p3_1 = plot(enable515 ? ema3_5 : na, "Late Day Fade - 5 EMA", color=color.yellow, display=display.none)
p3_2 = plot(enable515 ? ema3_15 : na, "Late Day Fade - 15 EMA", color=color.yellow, display=display.none)

fill(p1_1, p1_2, color=ema1_72 > ema1_89 ? color.new(color.green, 30) : color.new(color.red, 30), title="Background 1")
fill(p2_1, p2_2, color=ema2_72 > ema2_89 ? color.new(color.green, 90) : color.new(color.red, 90), title="Background 2")
fill(p3_1, p3_2, color=enable515 ? (ema3_5 > ema3_15 ? color.new(color.blue, 50) : color.new(color.red, 50)) : na, title="Late Day Fade")

// Plot Buy and Sell signals
plotshape(pos == 1, title="Buy", style=shape.triangleup, location=location.belowbar, color=color.green)
plotshape(pos == -1, title="Sell", style=shape.triangledown, location=location.abovebar, color=color.red)

// Volume Analysis
vol_length = input.int(20, "Volume SMA length", minval=1)
vol_avg = ta.sma(volume, vol_length)

unusual_vol_down = volume > vol_avg * 1.2 and close < open
unusual_vol_up = volume > vol_avg * 1.2 and close > open

barcolor(unusual_vol_down or unusual_vol_up ? color.yellow : na)

// ATR Indicator
len2 = input.int(20, minval=1, title="Smooth")
src = input.source(close, title="Source")
out = ta.vwma(src, len2)
avg1 = math.avg(out, xATRTrailingStop) // FIXED: Replaced `ta.avg()` with `math.avg()`

plot(avg1, color=color.aqua, title="ATR")

// Daily Open Line
dl = input.bool(true, "Show daily Open")
dopen = request.security(syminfo.tickerid, "D", open)
plot(dl ? dopen : na, title="Day Open", color=color.orange, style=plot.style_circles, linewidth=2)

// Strategy Entry Conditions
if pos == 1 and not isLong and ema1_72 > ema1_89 and ema2_72 > ema2_89 and ema1_72 > ema2_72 and close > dopen
    entryPrice := close
    exitPrice := close + target
    exitStop := entryPrice - stopLoss
    strategy.entry("Buy", strategy.long)
    strategy.exit("buy_target", "Buy", limit=exitPrice)
    isLong := true
    isShort := false

if pos == -1 and not isShort and ema1_72 < ema1_89 and ema2_72 < ema2_89 and ema1_72 < ema2_72 and close < dopen
    entryPrice := close
    exitPrice := close - target
    exitStop := entryPrice + stopLoss
    strategy.entry("Sell", strategy.short)
    strategy.exit("Sell_target", "Sell", limit=exitPrice)
    isLong := false
    isShort := true

// Stop Loss Handling
if strategy.position_size > 0 and close < entryPrice - stopLoss
    strategy.close("Buy", comment="Buy_Stop Loss")

if strategy.position_size < 0 and close > entryPrice + stopLoss
strategy.close("Sell", comment="Sell_Stop Loss")Published by ianzeng123 on the FMZ strategy square · last modified 2025-02-21. Collected in the Quant Trading Vault. Unvalidated research: re-test with your own data and costs before trusting it.
Build this with AgenKit
A spec is not a trading system. Paste this into your coding agent and AgenKit runs a specialist team — architecture, test-first build, risk gates, review — with paper trading on by default.
/agenkit build a production-grade trading bot with a backtest engine, risk controls and paper trading by default from strategies/Multi-Indicator-ATR-Trailing-Stop-Smart-Trading-Strategy.md- npx agenkit install engineering-kit in your project
- Paste the command into your agent and approve each phase
- Get tests, backtest, risk controls and a paper-trading switch
Understand it first
Before you run this, read the lesson behind the idea and how to backtest it honestly. Specs like this one are the survivors of an unknown number of trials; deflate their results accordingly.
Related specs
- BB Breakout StrategyPine Script · Breakout · 1d
- Donchian Channel and Larry Williams Large Trade Index StrategyPine Script · Breakout · 1m
- Dual Breakout Volatility Channel StrategyPine Script · Breakout · 1h
- Dual MA Momentum Breakout StrategyPine Script · Breakout · 1h
- EMA and Bollinger Bands Breakout StrategyPine Script · Breakout · 1h
- Flexible Long Short Trading Strategy Based on Keltner ChannelsPine Script · Breakout · 1d