Strategy vault / Machine learning
Multi indicator Composite Trading Strategy
The multi-indicator composite trading strategy integrates four major indicators: moving average convergence divergence (MACD), relative strength index (RSI), commodity channel index (CCI) and stochastic relative…
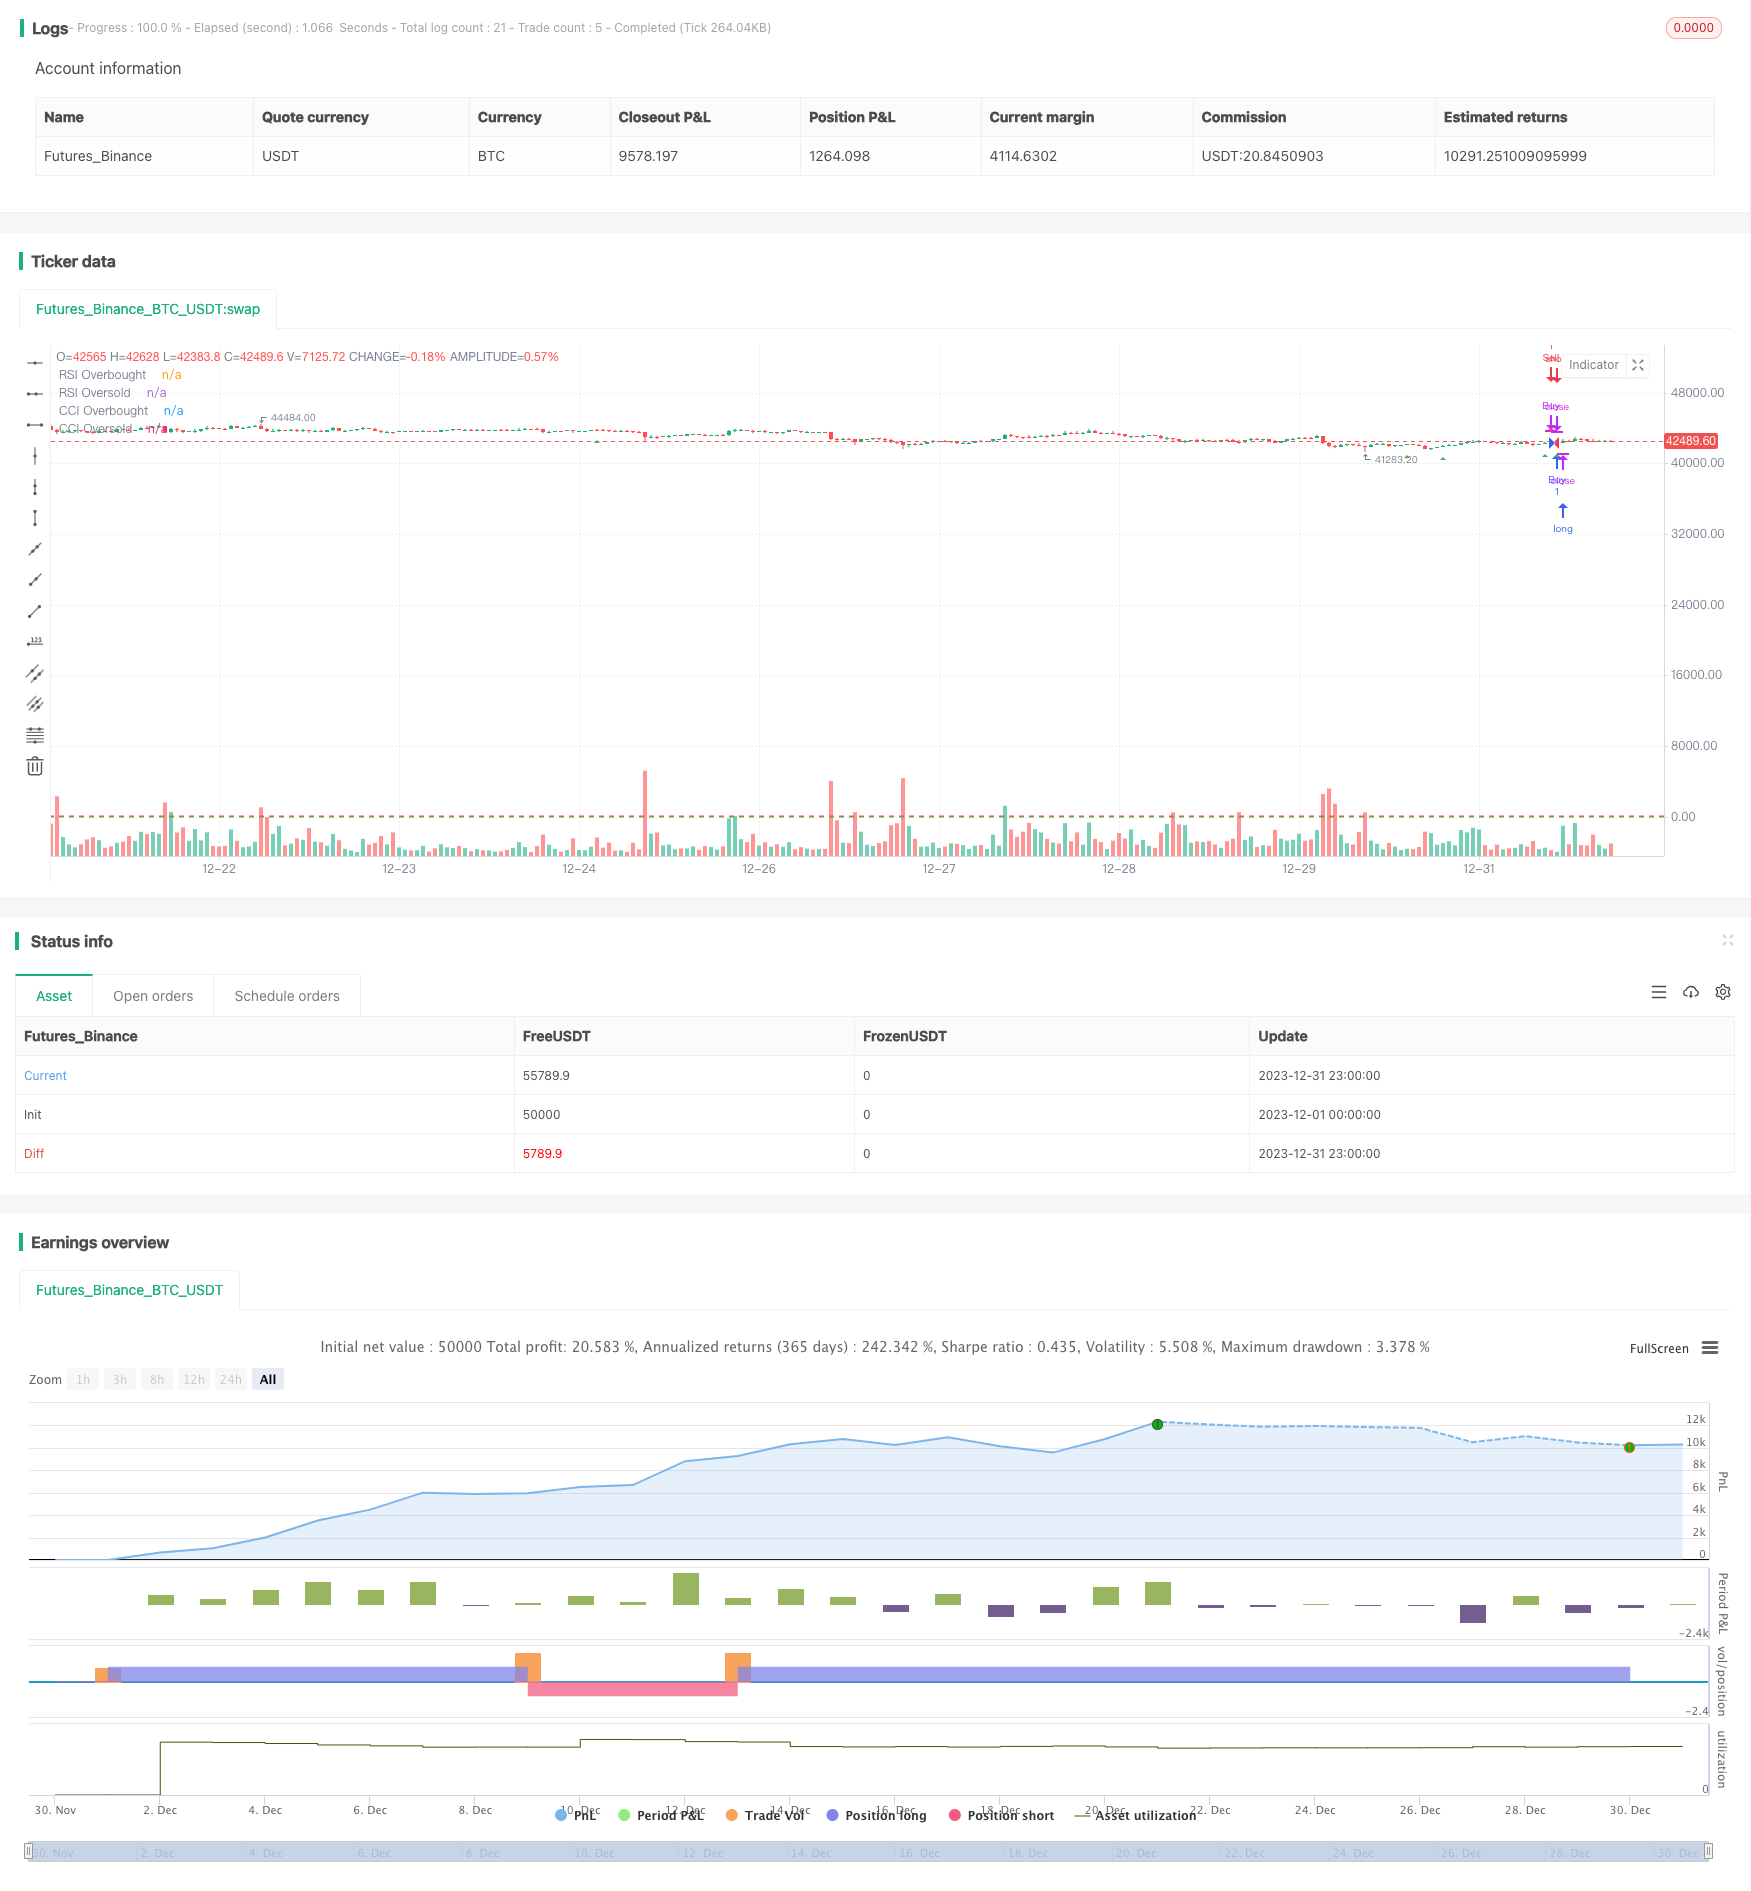
Overview
The multi-indicator composite trading strategy integrates four major indicators: moving average convergence divergence (MACD), relative strength index (RSI), commodity channel index (CCI) and stochastic relative strength index (StochRSI). It is a composite trading strategy that analyzes signals across these four indicators. By judging indicator signals across different timeframes, this strategy can more accurately identify market entry and exit points.
Strategy Logic
This strategy mainly makes judgments based on four indicators:
MACD: Calculates the difference between fast and slow moving averages to judge price momentum and trends. A buy signal is generated when the fast line crosses above the slow line.
RSI: Calculates the magnitude of price changes over a period of time. An RSI above 70 indicates overbought conditions and below 30 oversold. This strategy uses 70 and 30 as thresholds.
CCI: Measures price momentum by calculating the percentage deviation of price from its moving average. This strategy uses 100 and -100 as thresholds.
StochRSI: Combines Stochastics and RSI. A golden cross between the StochRSI %K and %D lines signals a buy, while a death cross signals a sell.
Only when all four indicators meet the criteria simultaneously will an actual buy or sell signal be generated.
Advantages
The key advantages of this multi-indicator strategy are:
Filters false signals by requiring agreement of all indicators, avoiding chasing tops or panic selling bottoms.
Captures primary trends across different dimensions by combining different indicator perspectives.
Large parameter optimization space to tune each indicator for overall optimal performance.
Weights can be adjusted based on bull or bear markets to focus on trend or mean reversion strategies.
Risks
The main risks are:
Indicators may generate concurrent false signals, triggering incorrect trades.
Prices can move violently enough for concurrent false signals across indicators.
Delayed buy signals as indicators align.
Difficult to optimize many parameters, possibly overfit.
Mitigations include parameter tuning, stop losses, and position sizing control.
Enhancement Opportunities
Enhancement opportunities:
Test combinations with more indicators like KD, Bollinger Bands to find optimal portfolio.
Optimize parameters for highest overall performance, maybe via machine learning.
Customize parameters for different stocks and sectors.
Add stop loss mechanisms in strategy code, like selling when price breaches support.
Select stocks with strong performance within sectors to improve portfolio returns.
Conclusion
This strategy integrates signals across four major indicators – MACD, RSI, CCI, and StochRSI. By setting strict entry and exit criteria based on multi-timeframe analysis, it can effectively identify market turning points. Refinements like parameter optimization, updating stock universe, and adding stops can further improve performance. Overall an effective quantitative trading strategy.
Parameters
| Name | Default | What it controls |
|---|---|---|
| v_input_1 | 12 | Fast Length |
| v_input_2 | 26 | Slow Length |
| v_input_3 | 9 | Signal Length |
| v_input_4 | 14 | RSI Length |
| v_input_5 | 70 | RSI Overbought Level |
| v_input_6 | 8 | CCI Length |
| v_input_7 | 100 | CCI Overbought Level |
| v_input_8 | 14 | Stoch Length |
| v_input_9 | 3 | Stoch K |
| v_input_10 | 3 | Stoch D |
Source Pine Script
/*backtest
start: 2023-12-01 00:00:00
end: 2023-12-31 23:59:59
period: 1h
basePeriod: 15m
exchanges: [{"eid":"Futures_Binance","currency":"BTC_USDT"}]
*/

//@version=4
strategy("MACD RSI CCI StochRSI Strategy", shorttitle="MRCSS", overlay=true)

// MACD göstergesi
fastLength = input(12, title="Fast Length")
slowLength = input(26, title="Slow Length")
signalLength = input(9, title="Signal Length")
[macdLine, signalLine, _] = macd(close, fastLength, slowLength, signalLength)

// RSI göstergesi
rsiLength = input(14, title="RSI Length")
rsiLevel = input(70, title="RSI Overbought Level")
rsiValue = rsi(close, rsiLength)

// CCI göstergesi
cciLength = input(8, title="CCI Length")
cciLevel = input(100, title="CCI Overbought Level")
cciValue = cci(close, cciLength)

// Stochastic Oscillator göstergesi
stochLength = input(14, title="Stoch Length")
stochK = input(3, title="Stoch K")
stochD = input(3, title="Stoch D")
stochValue = stoch(close, high, low, stochLength)
stochDValue = sma(stochValue, stochD)

// Alış ve Satış Sinyalleri
buySignal = crossover(macdLine, signalLine) and rsiValue < rsiLevel and cciValue < cciLevel and stochValue > stochDValue
sellSignal = crossunder(macdLine, signalLine) and rsiValue > (100 - rsiLevel) and cciValue > (100 - cciLevel) and stochValue < stochDValue

// Ticaret stratejisi uygula
strategy.entry("Buy", strategy.long, when = buySignal)
strategy.close("Buy", when = sellSignal)
strategy.entry("Sell", strategy.short, when = sellSignal)
strategy.close("Sell", when = buySignal)

// Göstergeleri çiz
hline(rsiLevel, "RSI Overbought", color=color.red)
hline(100 - rsiLevel, "RSI Oversold", color=color.green)
hline(cciLevel, "CCI Overbought", color=color.red)
hline(100 - cciLevel, "CCI Oversold", color=color.green)

// Grafik üzerinde sinyal okları çiz
plotshape(series=buySignal, title="Buy Signal", color=color.green, style=shape.triangleup, location=location.belowbar, size=size.small)
plotshape(series=sellSignal, title="Sell Signal", color=color.red, style=shape.triangledown, location=location.abovebar, size=size.small)
Published by ChaoZhang on the FMZ strategy square · last modified 2024-01-29. Collected in the Quant Trading Vault. Unvalidated research: re-test with your own data and costs before trusting it.
Build this with AgenKit
A spec is not a trading system. Paste this into your coding agent and AgenKit runs a specialist team — architecture, test-first build, risk gates, review — with paper trading on by default.
/agenkit build a production-grade trading bot with a backtest engine, risk controls and paper trading by default from strategies/Multi-indicator-Composite-Trading-Strategy.md- npx agenkit install engineering-kit in your project
- Paste the command into your agent and approve each phase
- Get tests, backtest, risk controls and a paper-trading switch
Understand it first
Before you run this, read the lesson behind the idea and how to backtest it honestly. Specs like this one are the survivors of an unknown number of trials; deflate their results accordingly.
Related specs
- Triple Moving Average Combined with MACD Quantitative StrategyPine Script · Machine learning · 1d
- ADX EFI 50 Moving Average Channel Pullback StrategyPine Script · Machine learning · 1h
- Multi indicator Combination StrategyPine Script · Machine learning · 1d
- EMA and RSI Quantitative Trading StrategyPine Script · Machine learning · 1h
- High Frequency Hybrid Technical Analysis Quantitative StrategyPine Script · Machine learning · 15m
- Johns Bitcoin Intraday Trading Strategy Based on Multiple IndicatorsPine Script · Machine learning · 1m