Strategy vault / Machine learning
Multi Indicator Decision Tree Strategy IMACD EMA and Ichimoku
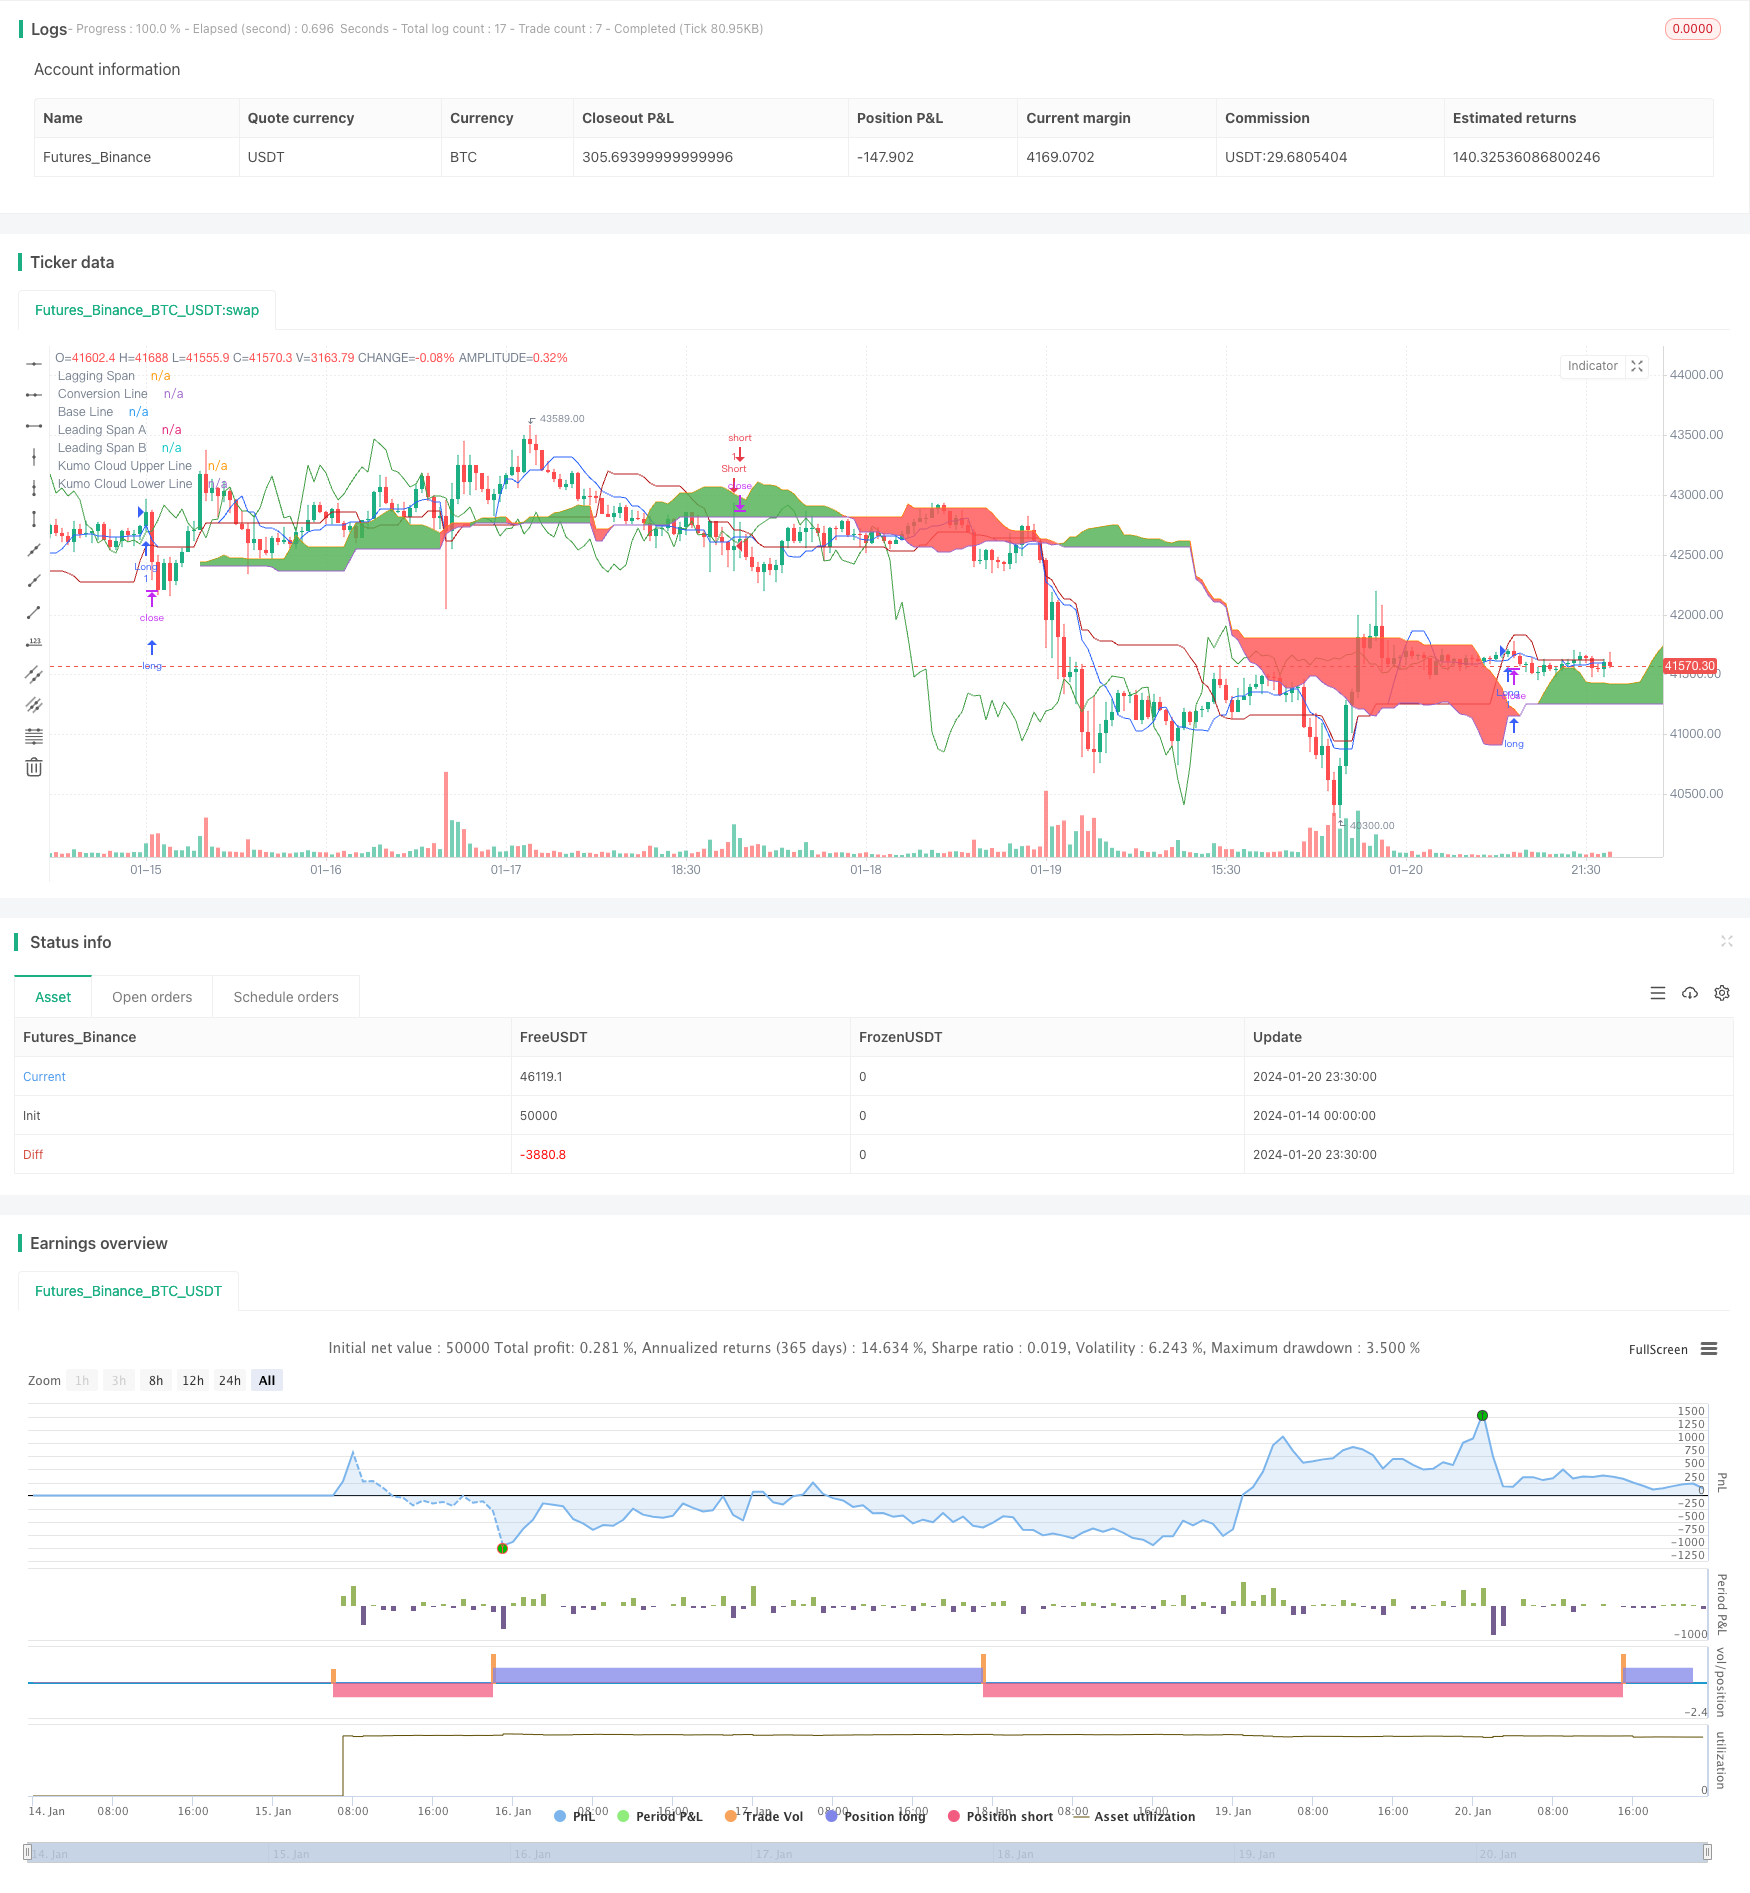
This strategy integrates multiple technical indicators like IMACD, EMA and Ichimoku to build a comprehensive decision tree model for generating trading signals.
Overview
This strategy integrates multiple technical indicators like IMACD, EMA and Ichimoku to build a comprehensive decision tree model for generating trading signals.
Strategy Logic
- IMACD: Enhanced MACD to better capture market trends via ImpulseMACD and ImpulseHisto
- Ichimoku: Plot conversion line, base line, leading span A, leading span B to identify support and resistance levels
- EMA 40: Assist in determining trend direction
- Long/short signals are triggered based on specific conditions between IMACD, cloud components and EMA 40
Long signal: When IMACD is a specific color and EMA 40 is above cloud top, go long
Short signal: When IMACD is red and EMA 40 is below cloud bottom, go short
Advantage Analysis
- Combination of multiple indicators improves accuracy of trend judgment
- Clear classification of decision tree model generates unambiguous trading signals
- Flexible EMA length for better assistance in trend determination
- Identify support and resistance levels better with cloud and trend indicators
Risk Analysis
- Complex parameter tuning with multiple indicators
- False signals may be triggered by improper EMA length
- Difficulty in monitoring many indicators simultaneously
Risk Solutions: Optimize parameter settings, adjust EMA length, simplify workflow.
Optimization Directions
- Enhance stability by optimizing parameters
- Limit losses with stop loss strategies
- Improve signal quality by backtesting with huge data
- Build adaptive decision tree model with machine learning
Summary
This strategy identifies trends using multiple indicators to construct a decision tree model for generating trading signals. Pros are high-quality and accurate signals. Consists room for progressive optimization. Requires focus on parameter tuning and stop loss to control risks for long-term steady returns.
Parameters
| Name | Default | What it controls |
|---|---|---|
| v_input_1 | 34 | Length MA |
| v_input_2 | 9 | Length Signal |
| v_input_int_1 | 9 | Conversion Line Length |
| v_input_int_2 | 26 | Base Line Length |
| v_input_int_3 | 52 | Leading Span B Length |
| v_input_int_4 | 26 | Lagging Span |
| v_input_3 | 40 | EMA Length |
| v_input_4 | false | Enable bar colors |
Source Pine Script
/*backtest
start: 2024-01-14 00:00:00
end: 2024-01-21 00:00:00
period: 30m
basePeriod: 15m
exchanges: [{"eid":"Futures_Binance","currency":"BTC_USDT"}]
*/

//@version=5
strategy("Decision Tree Strategy: IMACD, EMA and Ichimoku [cryptoonchain]", overlay=true)

lengthMA = input(34, title="Length MA")
lengthSignal = input(9, title="Length Signal")
conversionPeriods = input.int(9, minval=1, title="Conversion Line Length")
basePeriods = input.int(26, minval=1, title="Base Line Length")
laggingSpan2Periods = input.int(52, minval=1, title="Leading Span B Length")
displacement = input.int(26, minval=1, title="Lagging Span")
emaLength = input(40, title="EMA Length")  // Added user-configurable EMA length

calc_smma(src, len) =>
    smma = float(na)
    smma := na(smma[1]) ? ta.sma(src, len) : (smma[1] * (len - 1) + src) / len
    smma

calc_zlema(src, length) =>
    ema1 = ta.ema(src, length)
    ema2 = ta.ema(ema1, length)
    d = ema1 - ema2
    ema1 + d

src = ohlc4
hi = calc_smma(high, lengthMA)
lo = calc_smma(low, lengthMA)
mi = calc_zlema(src, lengthMA)

md = (mi > hi) ? (mi - hi) : (mi < lo) ? (mi - lo) : 0
sb = ta.sma(md, lengthSignal)
sh = md - sb
mdc = src > mi ? (src > hi ? color.rgb(128, 255, 0, 26) : color.green) : (src < lo ? color.red : color.orange)

colorCondition = color.rgb(128, 255, 0, 26)

conversionLine = math.avg(ta.lowest(conversionPeriods), ta.highest(conversionPeriods))
baseLine = math.avg(ta.lowest(basePeriods), ta.highest(basePeriods))
leadLine1 = math.avg(conversionLine, baseLine)
leadLine2 = math.avg(ta.lowest(laggingSpan2Periods), ta.highest(laggingSpan2Periods))

// Use user-configurable length for EMA
ema40 = ta.ema(close, emaLength)

ebc = input(false, title="Enable bar colors")
barcolor(ebc ? mdc : na)

conversionLinePlot = plot(conversionLine, color=#2962FF, title="Conversion Line", display=display.none)
baseLinePlot = plot(baseLine, color=#B71C1C, title="Base Line", display=display.none)
laggingSpanPlot = plot(close, offset=-displacement + 1, color=#43A047, title="Lagging Span", display=display.none)
leadLine1Plot = plot(leadLine1, offset=displacement - 1, color=#A5D6A7, title="Leading Span A", display=display.none)
leadLine2Plot = plot(leadLine2, offset=displacement - 1, color=#EF9A9A, title="Leading Span B", display=display.none)
kumoCloudUpperLinePlot = plot(leadLine1 > leadLine2 ? leadLine1 : leadLine2, offset=displacement - 1, title="Kumo Cloud Upper Line", display=display.none)
kumoCloudLowerLinePlot = plot(leadLine1 < leadLine2 ? leadLine1 : leadLine2, offset=displacement - 1, title="Kumo Cloud Lower Line", display=display.none)
fill(kumoCloudUpperLinePlot, kumoCloudLowerLinePlot, color=leadLine1 > leadLine2 ? color.green : color.red)

a = (leadLine1 > leadLine2 ? leadLine1 : leadLine2)
b = (leadLine1 < leadLine2 ? leadLine1 : leadLine2)

if mdc == colorCondition and ema40 > a[displacement - 1]
    strategy.entry("Long", strategy.long)

if mdc == color.red and ema40 < b[displacement - 1]
    strategy.entry("Short", strategy.short)
Published by ChaoZhang on the FMZ strategy square · last modified 2024-01-22. Collected in the Quant Trading Vault. Unvalidated research: re-test with your own data and costs before trusting it.
Build this with AgenKit
A spec is not a trading system. Paste this into your coding agent and AgenKit runs a specialist team — architecture, test-first build, risk gates, review — with paper trading on by default.
/agenkit build a production-grade trading bot with a backtest engine, risk controls and paper trading by default from strategies/Multi-Indicator-Decision-Tree-Strategy-IMACD-EMA-and-Ichimoku.md- npx agenkit install engineering-kit in your project
- Paste the command into your agent and approve each phase
- Get tests, backtest, risk controls and a paper-trading switch
Understand it first
Before you run this, read the lesson behind the idea and how to backtest it honestly. Specs like this one are the survivors of an unknown number of trials; deflate their results accordingly.
Related specs
- Triple Moving Average Combined with MACD Quantitative StrategyPine Script · Machine learning · 1d
- Multi indicator Assisted StrategyPine Script · Machine learning · 1d
- Octa EMA and Ichimoku Cloud Quantitative Trading StrategyPine Script · Machine learning · 1d
- Multi factor Quantitative Trading Strategy 430013Pine Script · Machine learning
- Multi factor Quantitative Trading StrategyPine Script · Machine learning · 1d
- EMA and RSI Quantitative Trading StrategyPine Script · Machine learning · 1h