Multi Indicator Dynamic Stop Loss Momentum Trend Trading Strategy
This strategy is a comprehensive trading system that combines multiple technical indicators to capture trading opportunities by dynamically monitoring market momentum and trend changes. The strategy integrates…
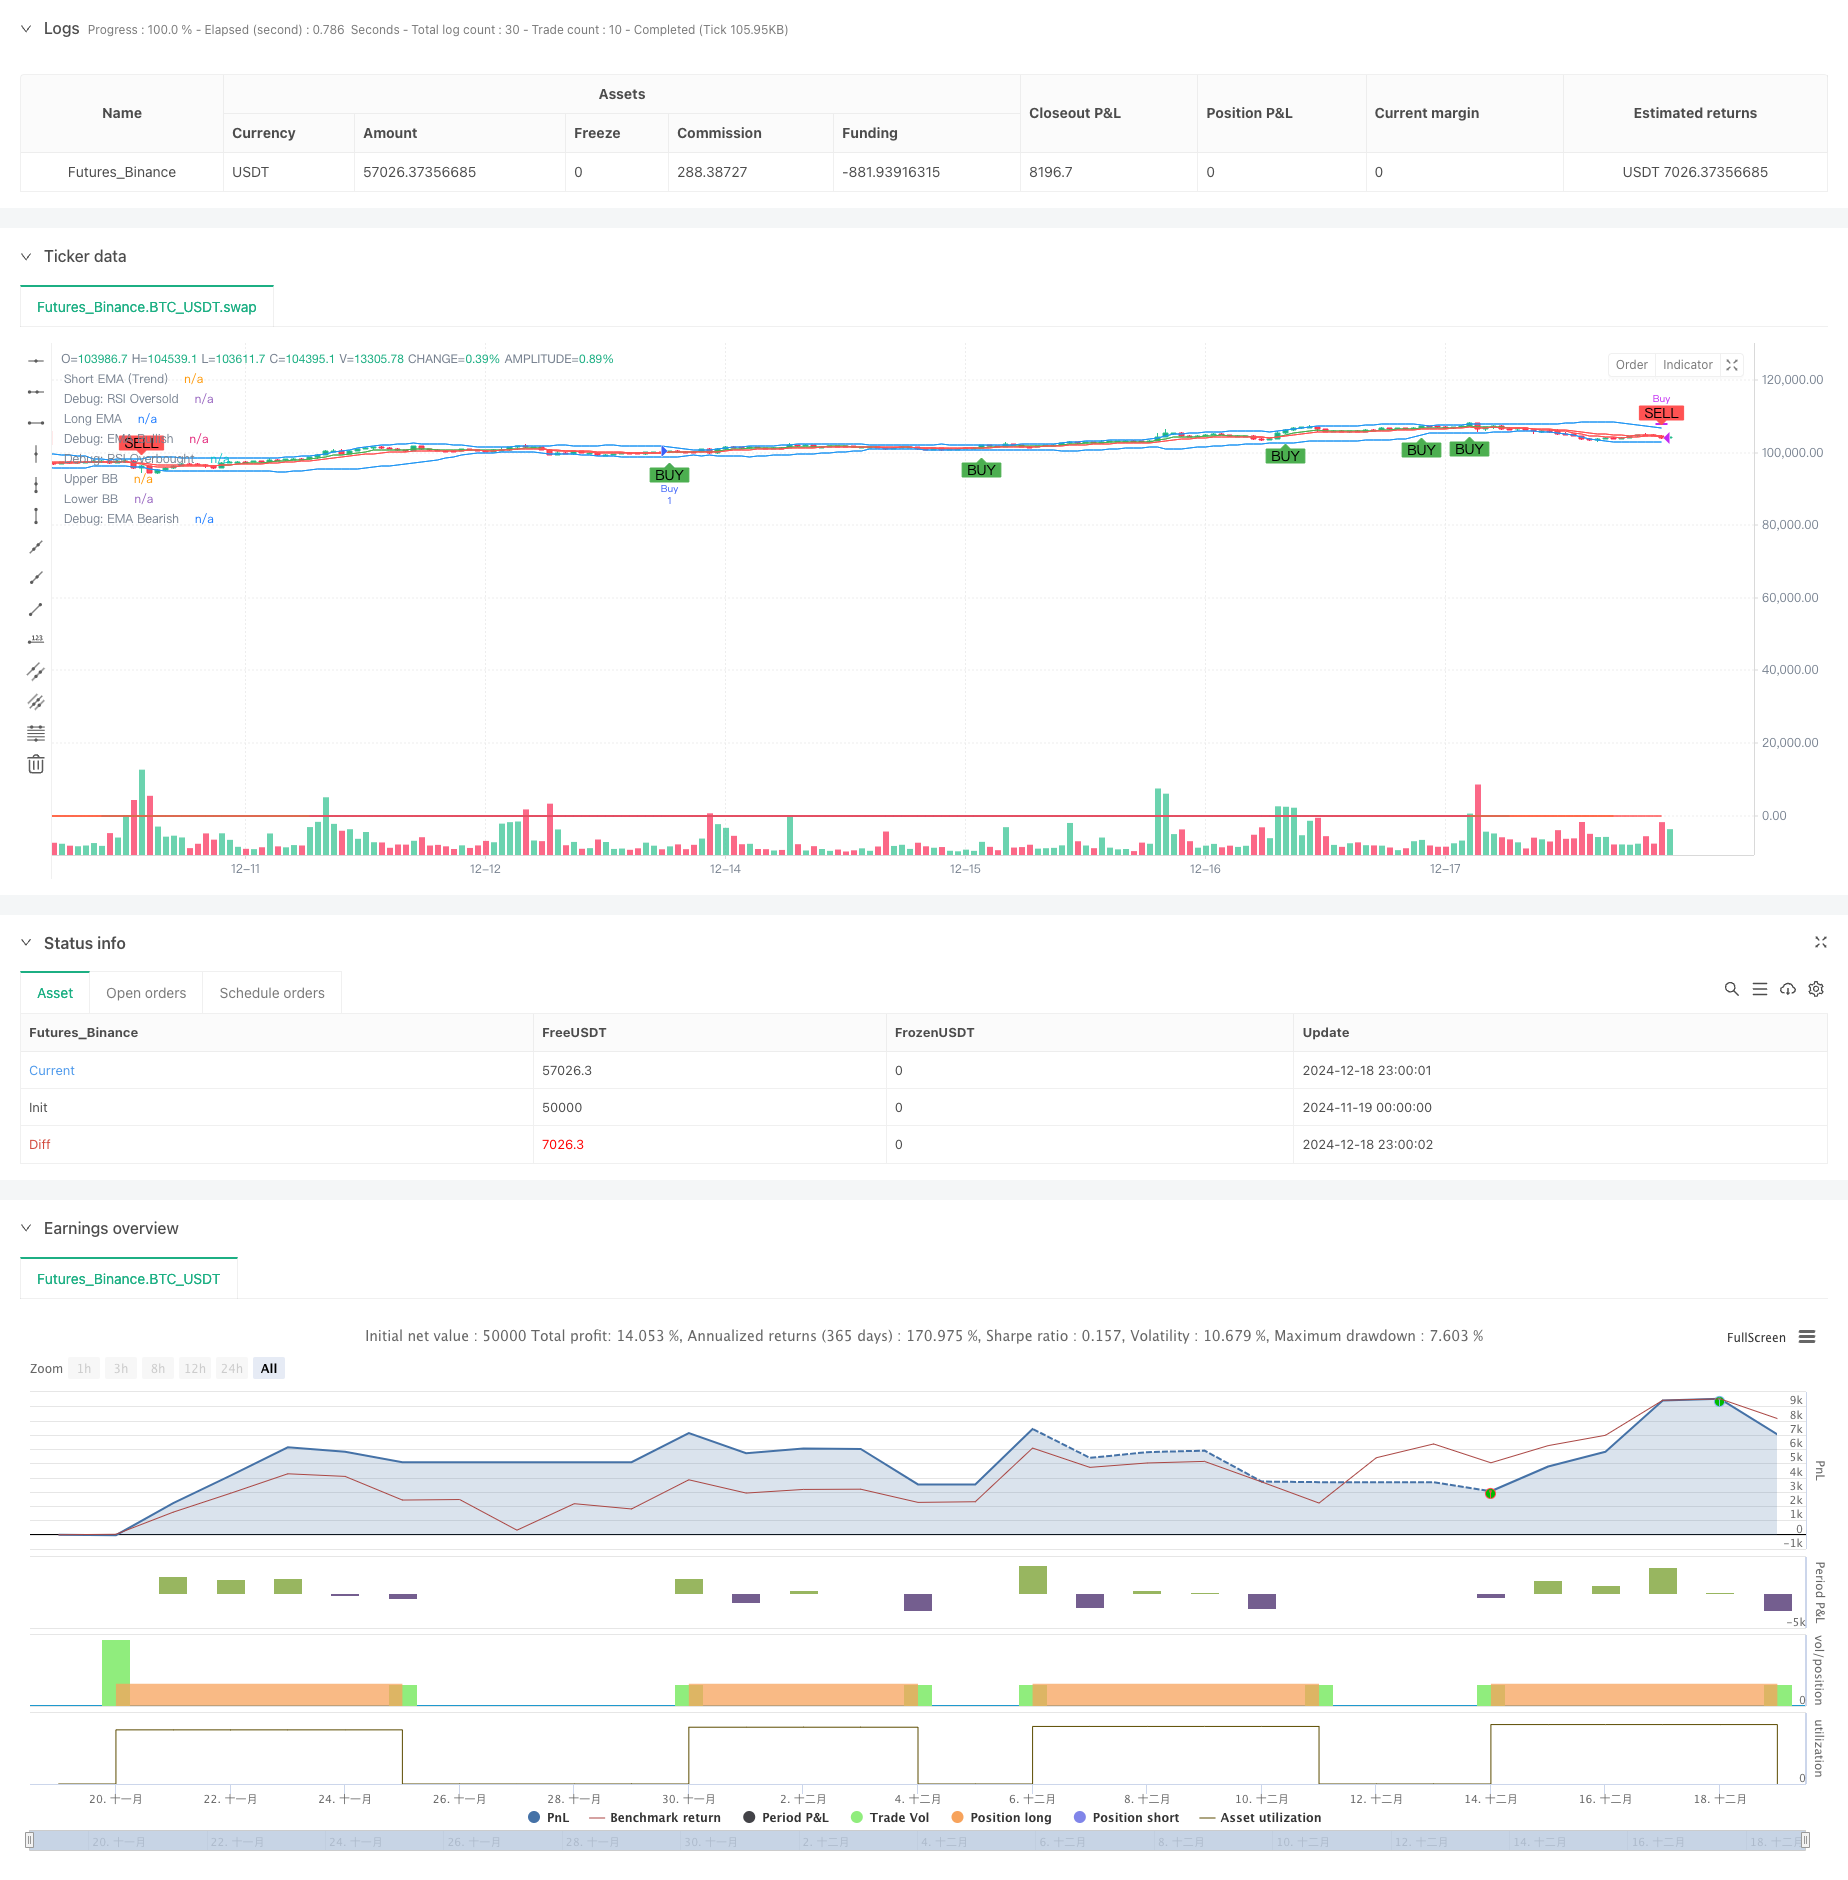
Overview
This strategy is a comprehensive trading system that combines multiple technical indicators to capture trading opportunities by dynamically monitoring market momentum and trend changes. The strategy integrates multiple indicators including Moving Averages (EMA), Relative Strength Index (RSI), Moving Average Convergence Divergence (MACD), Bollinger Bands (BB), and implements a dynamic stop-loss mechanism based on Average True Range (ATR), achieving multi-dimensional market analysis and risk control.
Strategy Principle
The strategy employs a multi-level signal confirmation mechanism, including:
- Trend Determination: Uses 7-period and 14-period EMA crossovers to determine market trend direction
- Momentum Analysis: Monitors market overbought/oversold conditions using RSI with 30/70 dynamic thresholds
- Trend Strength Confirmation: Incorporates ADX indicator to judge trend strength, confirming strong trends when ADX>25
- Volatility Range Assessment: Utilizes Bollinger Bands to define price volatility ranges and generates trading signals
- Volume Verification: Employs dynamic volume moving average filtering to ensure sufficient market activity
- Risk Control: Dynamic stop-loss strategy based on ATR indicator, with stop-loss distance set at 1.5 times ATR
Strategy Advantages
- Multi-dimensional signal verification reduces false signals
- Dynamic stop-loss mechanism enhances risk adaptation capability
- Combination of volume and trend strength analysis improves trading reliability
- Adjustable indicator parameters provide good adaptability
- Complete entry and exit mechanisms with clear trading logic
- Uses standard technical indicators, easy to understand and maintain
Strategy Risks
- Multiple indicators may lead to signal lag
- Parameter optimization may result in overfitting
- May generate frequent trades in ranging markets
- Complex signal system might increase computational load
- Requires large sample size for strategy validation
Strategy Optimization Directions
- Introduce market volatility adaptive mechanism for dynamic parameter adjustment
- Add time filters to avoid trading during unfavorable periods
- Optimize profit-taking strategy, consider implementing trailing stops
- Include transaction cost considerations in entry/exit conditions
- Implement position management mechanism for dynamic position sizing
Summary
The strategy constructs a comprehensive trading system through the coordination of multiple indicators. Its core advantages lie in multi-dimensional signal confirmation and dynamic risk control systems, while attention needs to be paid to parameter optimization and market adaptability. Through continuous optimization and adjustment, the strategy has the potential to maintain stable performance across different market conditions.
Source Pine Script
/*backtest
start: 2024-11-19 00:00:00
end: 2024-12-19 00:00:00
period: 1h
basePeriod: 1h
exchanges: [{"eid":"Futures_Binance","currency":"BTC_USDT"}]
*/

//@version=5
strategy("XRP/USDT Scalping Strategy", overlay=true)

// Input Parameters
emaShortLength = input.int(7, title="Short EMA Length")
emaLongLength = input.int(14, title="Long EMA Length")
rsiLength = input.int(7, title="RSI Length")
rsiOverbought = input.int(70, title="RSI Overbought Level") // Adjusted to 70 for broader range
rsiOversold = input.int(30, title="RSI Oversold Level") // Adjusted to 30 for broader range
macdFastLength = input.int(12, title="MACD Fast Length")
macdSlowLength = input.int(26, title="MACD Slow Length")
macdSignalLength = input.int(9, title="MACD Signal Length")
bbLength = input.int(20, title="Bollinger Bands Length")
bbStdDev = input.float(2.0, title="Bollinger Bands Standard Deviation") // Adjusted to 2.0 for better signal detection

// EMA Calculation
emaShort = ta.ema(close, emaShortLength)
emaLong = ta.ema(close, emaLongLength)

// RSI Calculation
rsi = ta.rsi(close, rsiLength)

// MACD Calculation
[macdLine, signalLine, _] = ta.macd(close, macdFastLength, macdSlowLength, macdSignalLength)
macdHistogram = macdLine - signalLine

// Bollinger Bands Calculation
basis = ta.sma(close, bbLength)
deviation = ta.stdev(close, bbLength)
bbUpper = basis + (bbStdDev * (deviation > 1e-5 ? deviation : 1e-5)) // Ensure robust Bollinger Band calculation
bbLower = basis - bbStdDev * deviation

// Volume Condition
volCondition = volume > ta.sma(volume, input.int(20, title="Volume SMA Period")) // Dynamic volume filter

// Trend Strength (ADX)
// True Range Calculation
tr = math.max(high - low, math.max(math.abs(high - close[1]), math.abs(low - close[1])))
// Directional Movement
plusDM = high - high[1] > low[1] - low ? math.max(high - high[1], 0) : 0
minusDM = low[1] - low > high - high[1] ? math.max(low[1] - low, 0) : 0
// Smooth Moving Averages
atr_custom = ta.rma(tr, 14)
plusDI = 100 * ta.rma(plusDM, 14) / atr_custom // Correct reference to atr_custom
minusDI = 100 * ta.rma(minusDM, 14) / atr_custom // Correct reference to atr_custom
// ADX Calculation
adx = plusDI + minusDI > 0 ? 100 * ta.rma(math.abs(plusDI - minusDI) / (plusDI + minusDI), 14) : na // Simplified ternary logic for ADX calculation // Prevent division by zero // Prevent division by zero // Final ADX
strongTrend = adx > 25

// Conditions for Buy Signal
emaBullish = emaShort > emaLong
rsiOversoldCondition = rsi < rsiOversold
macdBullishCrossover = ta.crossover(macdLine, signalLine)
priceAtLowerBB = close <= bbLower

buySignal = emaBullish and (rsiOversoldCondition or macdBullishCrossover or priceAtLowerBB) // Relaxed conditions by removing volCondition and strongTrend

// Conditions for Sell Signal
emaBearish = emaShort < emaLong
rsiOverboughtCondition = rsi > rsiOverbought
macdBearishCrossover = ta.crossunder(macdLine, signalLine)
priceAtUpperBB = close >= bbUpper

sellSignal = emaBearish and (rsiOverboughtCondition or macdBearishCrossover or priceAtUpperBB) // Relaxed conditions by removing volCondition and strongTrend

// Plot EMA Lines
trendColor = emaShort > emaLong ? color.green : color.red
plot(emaShort, color=trendColor, title="Short EMA (Trend)") // Simplified color logic
plot(emaLong, color=color.red, title="Long EMA")

// Plot Bollinger Bands
plot(bbUpper, color=color.blue, title="Upper BB")
plot(bbLower, color=color.blue, title="Lower BB")

// Plot Buy and Sell Signals
plot(emaBullish ? 1 : na, color=color.green, linewidth=1, title="Debug: EMA Bullish")
plot(emaBearish ? 1 : na, color=color.red, linewidth=1, title="Debug: EMA Bearish")
plot(rsiOversoldCondition ? 1 : na, color=color.orange, linewidth=1, title="Debug: RSI Oversold")
plot(rsiOverboughtCondition ? 1 : na, color=color.purple, linewidth=1, title="Debug: RSI Overbought")
plotshape(series=buySignal, title="Buy Signal", location=location.belowbar, color=color.green, style=shape.labelup, text="BUY")
plotshape(series=sellSignal, title="Sell Signal", location=location.abovebar, color=color.red, style=shape.labeldown, text="SELL", size=size.small) // Dynamic size for signals

// Strategy Execution with ATR-based Stop Loss and Take Profit
// Reuse atr_custom from earlier calculation
stopLoss = low - (input.float(1.5, title="Stop Loss Multiplier") * atr_custom) // Consider dynamic adjustment based on market conditions // Adjustable stop-loss multiplier
takeProfit = close + (2 * atr_custom)

if (buySignal)
    strategy.entry("Buy", strategy.long, stop=stopLoss) // Removed limit to simplify trade execution

if (sellSignal)
    strategy.close("Buy")
Published by ChaoZhang on the FMZ strategy square · last modified 2024-12-20. Collected in the Quant Trading Vault. Unvalidated research: re-test with your own data and costs before trusting it.
Build this with AgenKit
A spec is not a trading system. Paste this into your coding agent and AgenKit runs a specialist team — architecture, test-first build, risk gates, review — with paper trading on by default.
/agenkit build a production-grade trading bot with a backtest engine, risk controls and paper trading by default from strategies/Multi-Indicator-Dynamic-Stop-Loss-Momentum-Trend-Trading-Strategy.md- npx agenkit install engineering-kit in your project
- Paste the command into your agent and approve each phase
- Get tests, backtest, risk controls and a paper-trading switch
Understand it first
Before you run this, read the lesson behind the idea and how to backtest it honestly. Specs like this one are the survivors of an unknown number of trials; deflate their results accordingly.
Related specs
- Multi Trend Momentum Crossover Strategy with Volatility Optimization SystemPine Script · Momentum · 1d
- Multi Indicator Comprehensive Analysis Quantitative Trading Strategy Trend Momentum and Volatility Collaborative Prediction ModelPine Script · Momentum · 3m
- Advanced Multi Indicator Trend Following and Momentum Quantitative Trading StrategyPine Script · Momentum · 1h
- KST EMA Momentum Trend Following StrategyPine Script · Momentum · 1d
- Multi Indicator Trend Momentum Trading Strategy with Dynamic Risk Management SystemPine Script · Momentum · 1h
- Multi Indicator Trend Momentum Trading Strategy An Optimized Quantitative Trading System Based on Bollinger Bands Fibonacci and ATRPine Script · Momentum · 1h