Strategy vault / Mean reversion
Multi Indicator Momentum and Volume Based Trend Reversal Strategy
This strategy is a trend reversal trading system that combines momentum indicators (MACD, RSI) with a volume filter. By introducing a Range Filter to monitor price fluctuations, it achieves precise capture of market…
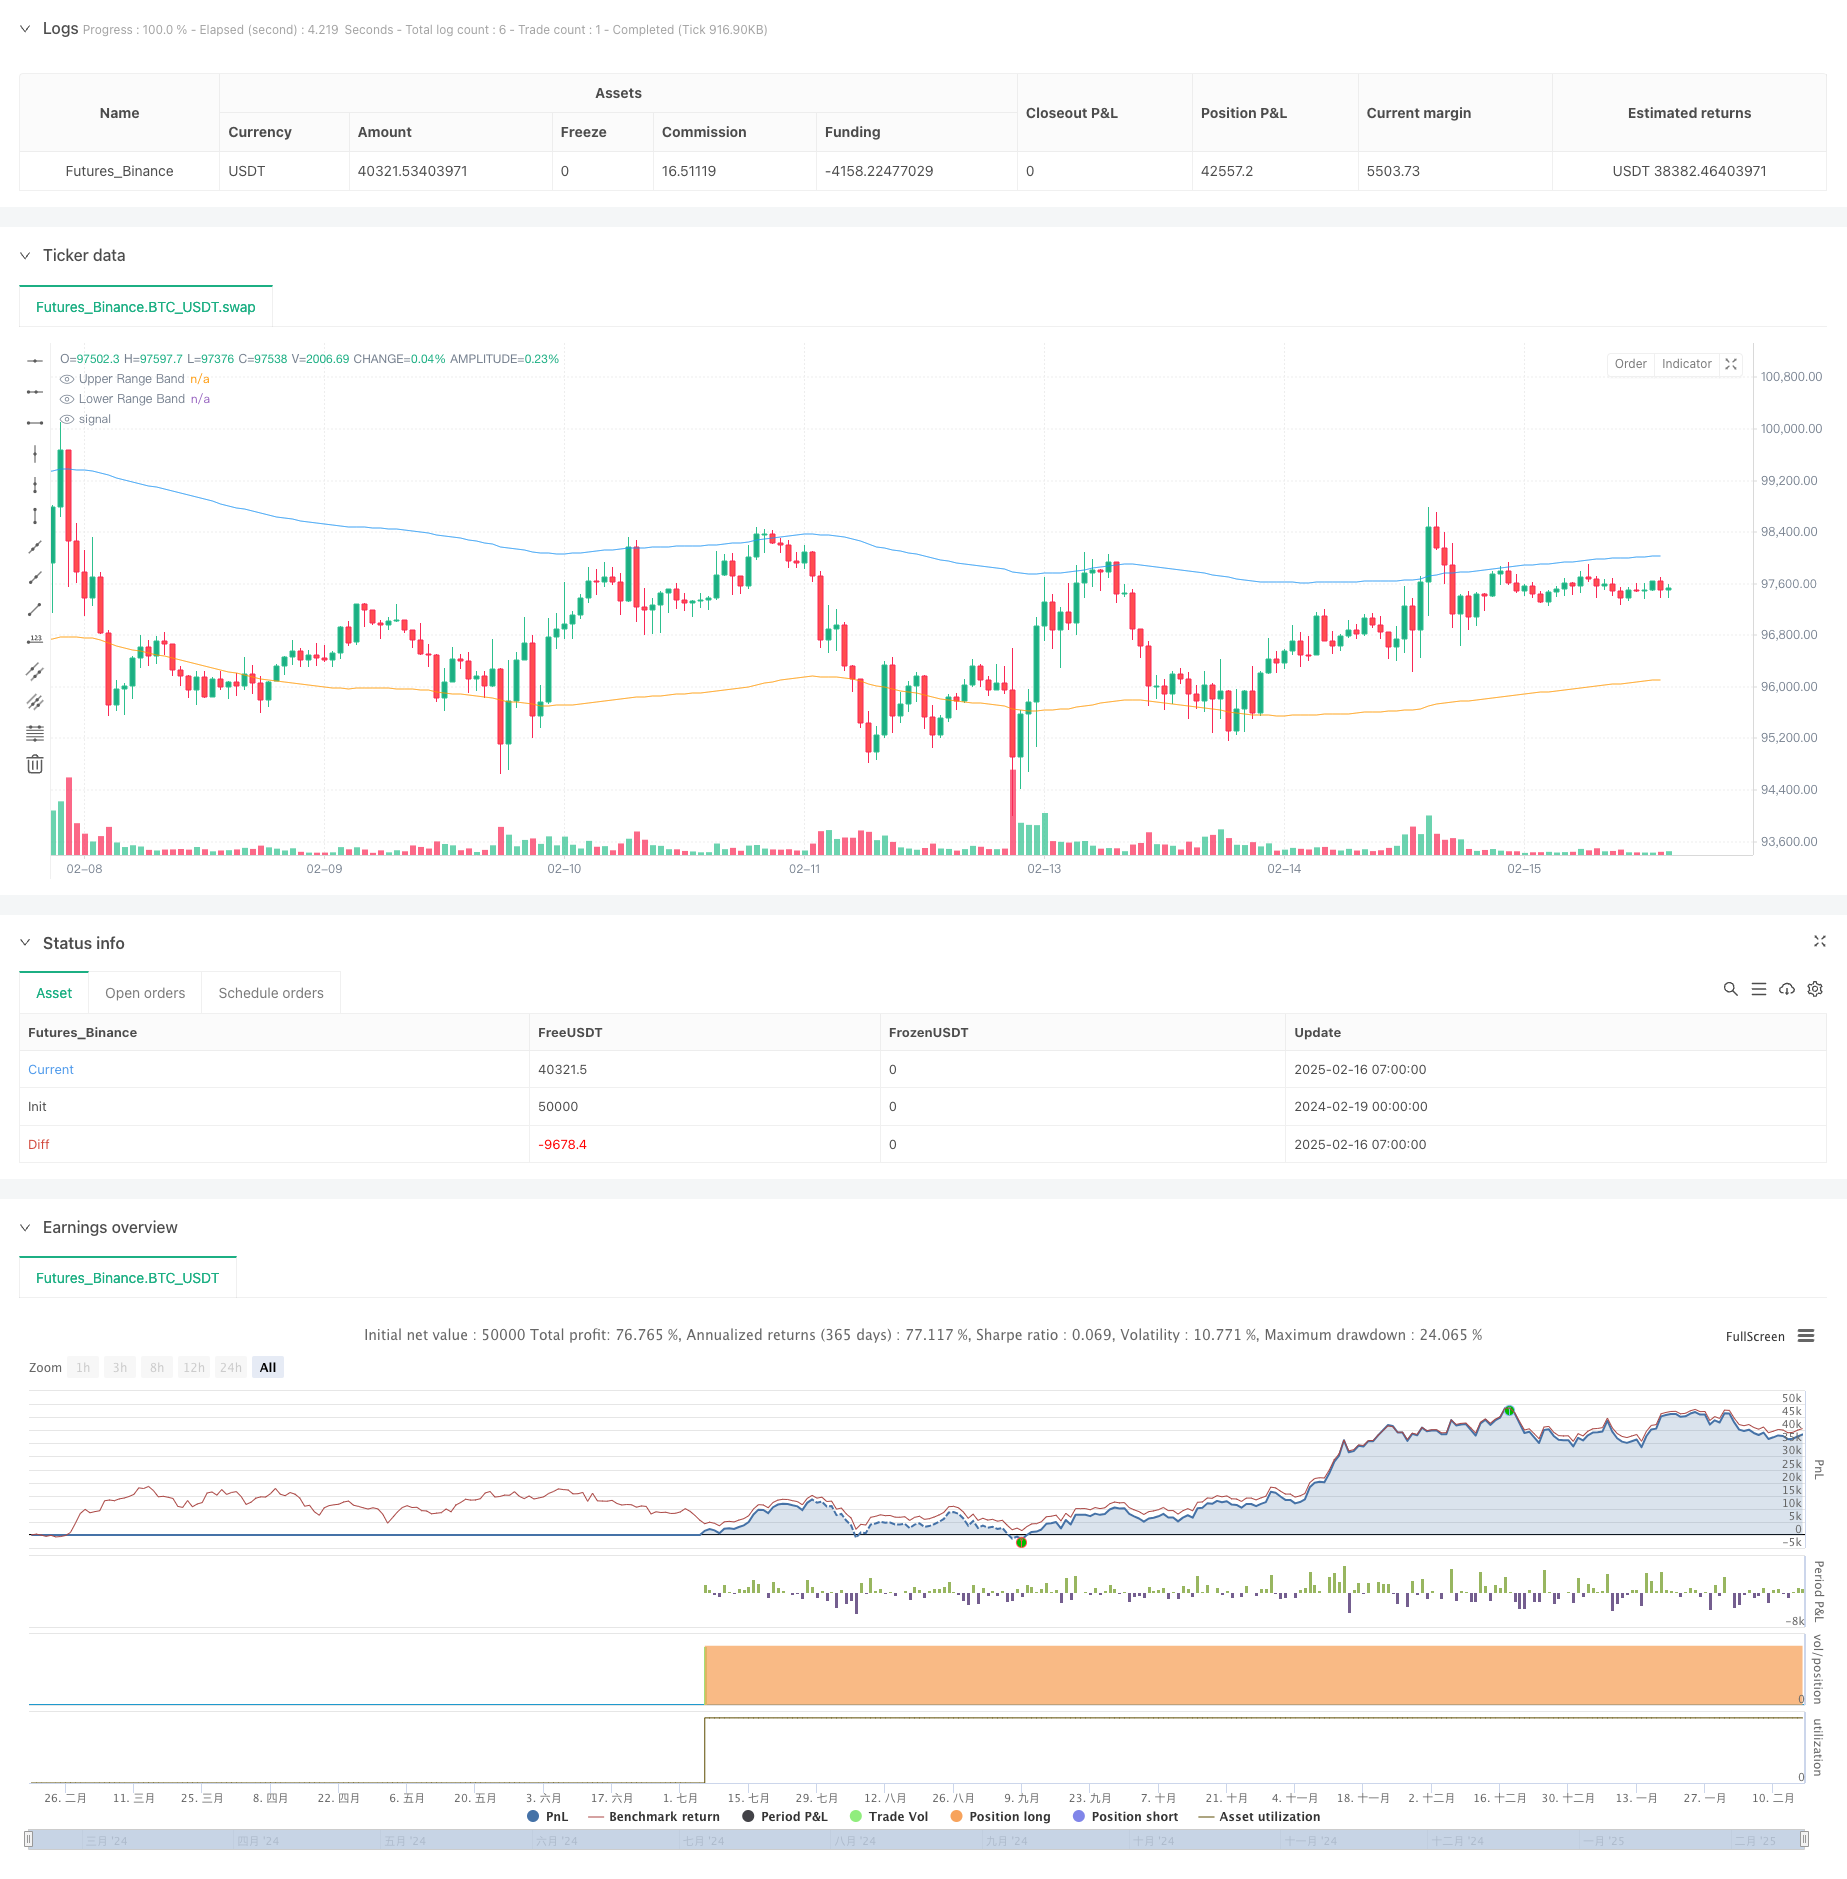
Overview
This strategy is a trend reversal trading system that combines momentum indicators (MACD, RSI) with a volume filter. By introducing a Range Filter to monitor price fluctuations, it achieves precise capture of market tops and bottoms. The strategy incorporates a volume confirmation mechanism on top of traditional technical indicators, effectively improving the reliability of trading signals.
Strategy Principle
The strategy employs multiple indicator verification for trading:
- MACD indicator captures momentum changes in price, confirming trend reversal points through crossovers
- RSI monitors market overbought/oversold conditions, seeking potential reversals at extreme values
- Range Filter calculates smoothed price bands to ensure trades occur at significant trend deviations
- Volume Filter requires trading signals to be confirmed by increased volume, enhancing signal reliability
Multiple condition trigger mechanism works as follows:
- Long conditions: MACD golden cross + RSI in oversold zone + Price below lower band + Volume above average
- Short conditions: MACD death cross + RSI in overbought zone + Price above upper band + Volume above average
Strategy Advantages
- Cross-validation of multiple indicators improves signal accuracy, effectively reducing false signal interference
- Range Filter ensures trades occur at significant price deviations, increasing potential profit margins
- Volume confirmation mechanism prevents misjudgments in low liquidity environments, enhancing trade reliability
- Strategy parameters can be flexibly adjusted to adapt to different market conditions and trading instruments
- Clear signal generation logic facilitates real-time monitoring and backtesting analysis
Strategy Risks
- Strict multiple conditions may cause missed trading opportunities
- May generate frequent trading signals in ranging markets, increasing transaction costs
- Parameter selection requires substantial market experience and historical data support
- Technical indicators' effectiveness may be affected in extreme market conditions
Risk control suggestions:
- Recommend thorough parameter optimization and backtesting verification
- Consider implementing stop-loss and take-profit mechanisms
- Monitor market environment changes and adjust strategy parameters accordingly
Strategy Optimization Directions
- Introduce adaptive parameter mechanisms to dynamically adjust indicator parameters based on market volatility
- Add market environment recognition module to apply different signal filtering rules in different market states
- Optimize volume filter by considering volume pattern analysis
- Add price pattern recognition functionality to provide additional reversal confirmation signals
- Develop intelligent money management module to optimize position sizing and risk control
Summary
The strategy establishes a relatively comprehensive trend reversal trading system through the coordination of multiple technical indicators. Its core advantages lie in its strict signal filtering mechanism and flexible parameter adjustment space. Through continuous optimization and improvement, the strategy shows promise in maintaining stable performance across various market conditions. In practical application, investors are advised to adjust strategy parameters according to their risk preferences and market experience.
Source Pine Script
/*backtest
start: 2024-02-19 00:00:00
end: 2025-02-16 08:00:00
period: 1h
basePeriod: 1h
exchanges: [{"eid":"Futures_Binance","currency":"BTC_USDT"}]
*/

//@version=6
strategy("MACD & RSI with Range and Volume Filter", overlay=true)

// Inputs for MACD
fastLength = input.int(12, title="MACD Fast Length")
slowLength = input.int(26, title="MACD Slow Length")
signalLength = input.int(9, title="MACD Signal Length")

// Inputs for RSI
rsiLength = input.int(14, title="RSI Length")
rsiOverbought = input.int(80, title="RSI Overbought Level")
rsiOversold = input.int(40, title="RSI Oversold Level")

// Inputs for Range Filter
rangePeriod = input.int(100, minval=1, title="Range Filter Period")
rangeMultiplier = input.float(3.0, minval=0.1, title="Range Filter Multiplier")

// Inputs for Volume Filter
volumeMA_Period = input.int(20, minval=1, title="Volume MA Period")

// MACD Calculation
[macdLine, signalLine, _] = ta.macd(close, fastLength, slowLength, signalLength)

// RSI Calculation
rsi = ta.rsi(close, rsiLength)

// Smooth Average Range
smoothRange(src, period, multiplier) =>
    avgRange = ta.ema(math.abs(src - src[1]), period)
    ta.ema(avgRange, period * 2 - 1) * multiplier

smoothedRange = smoothRange(close, rangePeriod, rangeMultiplier)
rangeFilter = ta.ema(close, rangePeriod)
upperBand = rangeFilter + smoothedRange
lowerBand = rangeFilter - smoothedRange

// Range Filter Conditions
priceAboveRange = close > upperBand
priceBelowRange = close < lowerBand

// Volume Filter
volumeMA = ta.sma(volume, volumeMA_Period)
highVolume = volume > volumeMA

// Buy and Sell Conditions with Range and Volume Filter
buyCondition = ta.crossover(macdLine, signalLine) and rsi < rsiOversold and priceBelowRange and highVolume
sellCondition = ta.crossunder(macdLine, signalLine) and rsi > rsiOverbought and priceAboveRange and highVolume

// Strategy Execution
if (buyCondition)
    strategy.entry("Buy", strategy.long)
if (sellCondition)
    strategy.entry("Sell", strategy.short)

// Alerts for Buy and Sell Signals
alertcondition(buyCondition, title="Buy Signal", message="Buy Signal Triggered")
alertcondition(sellCondition, title="Sell Signal", message="Sell Signal Triggered")

// Plot Buy and Sell Signals
plotshape(buyCondition, title="Buy Signal", text="Buy", style=shape.labelup, location=location.belowbar, color=color.new(color.green, 0))
plotshape(sellCondition, title="Sell Signal", text="Sell", style=shape.labeldown, location=location.abovebar, color=color.new(color.red, 0))

// Plot Range Filter Bands
plot(upperBand, color=color.new(color.blue, 50), title="Upper Range Band")
plot(lowerBand, color=color.new(color.orange, 50), title="Lower Range Band")
Published by ChaoZhang on the FMZ strategy square · last modified 2025-02-18. Collected in the Quant Trading Vault. Unvalidated research: re-test with your own data and costs before trusting it.
Build this with AgenKit
A spec is not a trading system. Paste this into your coding agent and AgenKit runs a specialist team — architecture, test-first build, risk gates, review — with paper trading on by default.
/agenkit build a production-grade trading bot with a backtest engine, risk controls and paper trading by default from strategies/Multi-Indicator-Momentum-and-Volume-Based-Trend-Reversal-Strategy.md- npx agenkit install engineering-kit in your project
- Paste the command into your agent and approve each phase
- Get tests, backtest, risk controls and a paper-trading switch
Understand it first
Before you run this, read the lesson behind the idea and how to backtest it honestly. Specs like this one are the survivors of an unknown number of trials; deflate their results accordingly.
Related specs
- Dynamic Adaptive Multi Timeframe Trend Following and Range Reversal Hybrid StrategyPine Script · Mean reversion · 2d
- Multi Signal Adaptive Trading StrategyPine Script · Mean reversion · 1d
- Quantitative Trading Strategy Integrating MACD RSI and RVOLPine Script · Mean reversion · 1d
- Advanced 15 Minute Chart Trading Signal StrategyPine Script · Mean reversion · 3h
- Advanced Momentum EMA Trend Following with RSI Overbought Oversold Trading StrategyPine Script · Mean reversion · 1d
- BONK Multi Factor Trading StrategyPine Script · Mean reversion · 1d