Multi Indicator Momentum Breakout Quantitative Trading Strategy
This strategy is a multi-indicator momentum breakout quantitative trading system designed specifically for high-volatility markets. It cleverly integrates Exponential Moving Averages (EMA), Relative Strength Index…
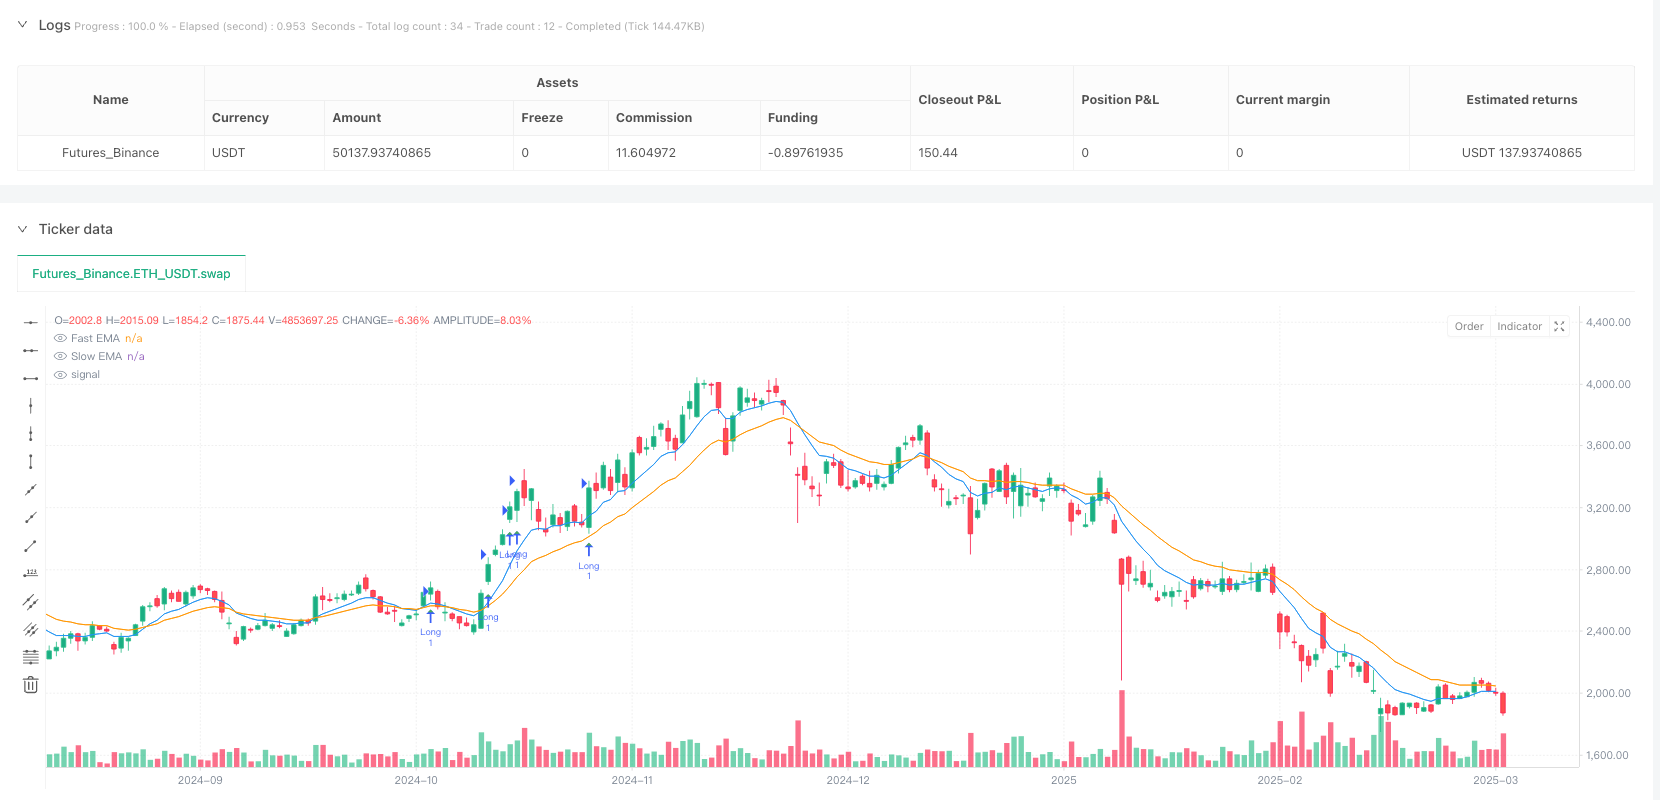
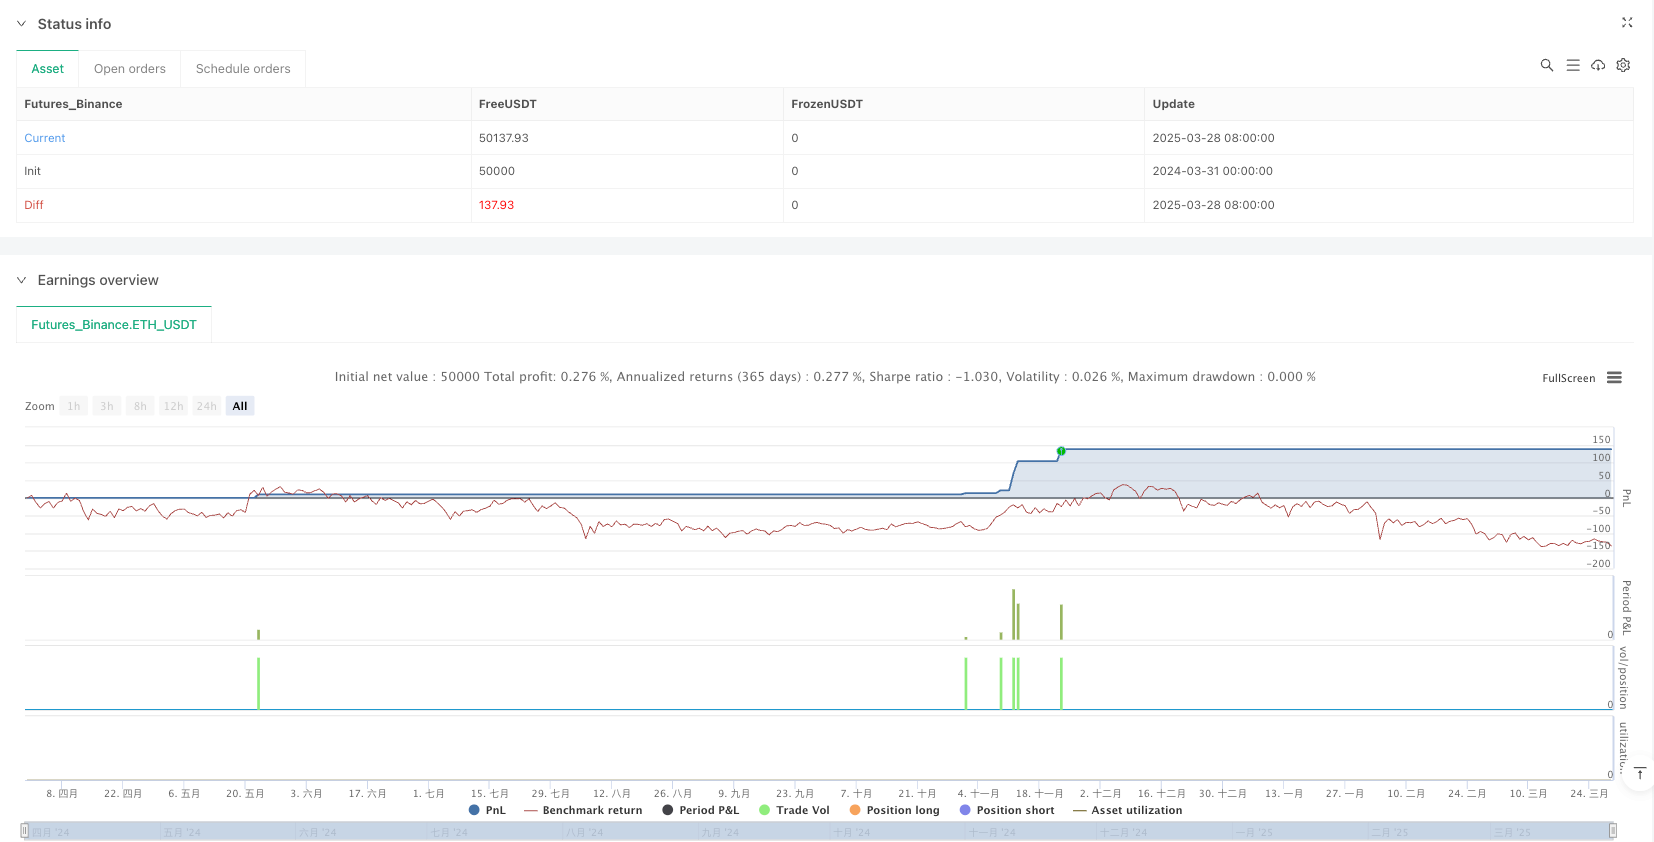
Overview
This strategy is a multi-indicator momentum breakout quantitative trading system designed specifically for high-volatility markets. It cleverly integrates Exponential Moving Averages (EMA), Relative Strength Index (RSI), volume confirmation, and Average True Range (ATR)-based trailing stops to capture strong breakout movements while effectively avoiding false signals. The core concept is to seek opportunities that break above previous highs with significantly increased volume on a confirmed uptrend, while implementing dynamic stop-loss and trailing exit mechanisms to protect capital and lock in profits.
Strategy Principles
The strategy's operational mechanism is built on four key pillars:
EMA Trend Confirmation: Utilizes 9-period and 20-period EMAs to confirm the price is in a strong upward trend. When the fast EMA (9) is positioned above the slow EMA (20) and trending upward, it's considered a valid bullish signal.
Price Breakout Confirmation: The strategy requires the current closing price to break above the previous period's high while maintaining position above the fast EMA, indicating sufficient price momentum.
Volume Confirmation: To avoid low-liquidity false breakouts, the strategy only considers entry when volume exceeds 1.5 times the 20-period average volume, ensuring the breakout is supported by adequate market participation.
RSI Momentum Filtering and Divergence Avoidance: Beyond basic RSI momentum filtering (requiring RSI > 50), the strategy detects potential RSI bearish divergences by comparing current 5-period and previous 5-period RSI lows with corresponding price lows, effectively avoiding entry when the trend might reverse.
ATR-Based Dynamic Stop-Loss and Trailing Exit: The strategy employs a 14-period ATR to set dynamic stop-loss levels (previous period low minus 0.5ATR) and enables trailing stops (2ATR) when price maintains above the fast EMA, optimizing capital management and maximizing profitability.
Entry conditions must simultaneously satisfy: valid breakout, volume confirmation, trend confirmation, and no RSI bearish divergence. This multi-layered filtering mechanism significantly enhances the reliability of trading signals.
Strategy Advantages
High-Precision Capture of Explosive Movements: Through the triple verification of price breakout, trend confirmation, and volume increase, the strategy can precisely capture explosive movements with sustained momentum, rather than temporary price fluctuations.
Effective Filtering of Sideways and Weak Trends: The EMA trend filtering mechanism ensures the strategy only operates in clear uptrends, avoiding excessive trading signals during sideways markets or unclear trends.
Intelligent Risk Management System: ATR-based dynamic stop-losses provide customized protection for each trade based on market volatility, rather than using fixed values, allowing the strategy to maintain adaptability in different volatility environments.
Divergence Detection Avoids False Breakouts: The integrated RSI divergence detection is a key advantage, helping to avoid entry when price makes new highs but momentum has begun to weaken, effectively preventing many potential losing trades.
Trailing Stops Lock in Profits: The strategy not only focuses on entry points but also integrates an ATR-based trailing stop mechanism, which effectively locks in existing gains while remaining sufficiently loose to allow profits to grow.
Strategy Risks
High-Volatility Market Risk: Although the strategy is designed to capture momentum in high-volatility assets, extreme volatility may cause stop-losses to be quickly triggered, especially in cases of market gaps or sudden liquidity droughts. Solution: Consider adjusting ATR multipliers during high volatility expectations, or avoiding trading before major news or events.
Overtrading Risk: Under certain market conditions, the strategy may generate excessive trading signals, increasing trading costs and diluting overall effectiveness. Solution: Consider adding additional trend strength filters or extending holding periods to reduce trading frequency.
Limitations of Divergence Detection: While divergence detection helps avoid some false breakouts, it can itself generate false signals, especially in sideways markets. Solution: Consider combining other confirmation indicators or adding sensitivity adjustment parameters for divergence detection.
Parameter Sensitivity: The strategy uses multiple parameters (such as EMA periods, ATR multipliers, etc.), whose optimal values may vary with changing market conditions. Solution: Regularly backtest and optimize the strategy, or even implement an adaptive parameter system.
Lack of Market Structure Consideration: The strategy is primarily based on technical indicators rather than market structure (such as support/resistance levels), and may perform poorly near important price levels. Solution: Consider integrating key price levels or market structure analysis as additional filters.
Strategy Optimization Directions
Adaptive Parameter System: The current strategy uses fixed EMA, RSI, and ATR parameters; consider implementing an adaptive parameter system that automatically adjusts these parameters based on market volatility or trading sessions. Such optimization would enhance the strategy's adaptability in different market environments and reduce overfitting risk.
Enhanced Volume Analysis: Although the current strategy includes basic volume confirmation, consider adding more sophisticated volume analysis, such as volume trend consistency checks or volume-weighted moving averages. This would improve the accuracy of judging real market participation.
Multi-Timeframe Analysis: The strategy can improve win rates by integrating higher timeframe trend confirmation. For example, only looking for bullish breakout signals on a 5-minute chart when the daily trend is up would effectively filter out weak signals against the larger trend.
Consider Market Volatility Cycles: Markets typically alternate between volatile and consolidation phases. The strategy could add a volatility indicator (such as historical volatility or Bollinger Band width) to determine the current market phase and adjust entry criteria and position size accordingly.
Dynamic Position Management: The current strategy uses a fixed money management approach; consider implementing a dynamic position management system based on market volatility, trend strength, or historical win rates, increasing position size when signals are stronger and vice versa, optimizing the risk-reward ratio.
Integrate Machine Learning Models: By using machine learning models trained on historical data to predict signal success probability, the strategy can further screen for high-probability trading opportunities, improving overall performance.
Summary
The Multi-Indicator Momentum Breakout Quantitative Trading Strategy is a well-designed trading system that effectively captures breakout opportunities in high-momentum markets through multiple layers of technical indicator confirmation (EMA trend, price breakout, volume confirmation, and RSI analysis). The strategy's standout feature is its comprehensive risk management system, including divergence detection to avoid false breakouts and ATR-based dynamic stop-loss and trailing exit mechanisms.
While the strategy excels at capturing strong breakouts, challenges remain in parameter sensitivity and market environment adaptability. By implementing the suggested optimization directions, such as adaptive parameter systems, enhanced volume analysis, multi-timeframe confirmation, and dynamic position management, this strategy has the potential to further enhance its robustness and profitability.
For traders seeking to capture trend breakout opportunities in high-volatility markets, this strategy provides a structured framework that balances aggressive opportunity capture with prudent risk management. However, as with any trading strategy, thorough backtesting and parameter optimization before live trading are essential.
Source Pine Script
/*backtest
start: 2024-03-31 00:00:00
end: 2025-03-29 08:00:00
period: 1d
basePeriod: 1d
exchanges: [{"eid":"Futures_Binance","currency":"ETH_USDT"}]
*/

//@version=6
strategy("Enhanced First High Break Strategy v3", overlay=true, margin_long=100, margin_short=100)

// Input Parameters
emaFastLength = input.int(9, "Fast EMA Length")
emaSlowLength = input.int(20, "Slow EMA Length")
rsiLength = input.int(14, "RSI Length")
volumeAvgLength = input.int(20, "Volume Average Length")
atrLength = input.int(14, "ATR Length")

// Calculate Indicators
emaFast = ta.ema(close, emaFastLength)
emaSlow = ta.ema(close, emaSlowLength)
rsi = ta.rsi(close, rsiLength)
volAvg = ta.sma(volume, volumeAvgLength)
atr = ta.atr(atrLength)

// Pre-calculate lowest values (FIXED)
rsiLowCurrent = ta.lowest(rsi, 5)
rsiLowPrevious = ta.lowest(rsi[5], 5)
lowLowPrevious = ta.lowest(low[5], 5)

// Trend Conditions
bullishTrend = emaFast > emaSlow and emaFast > emaFast[1]
bearishDivergence = rsiLowCurrent > rsiLowPrevious and low < lowLowPrevious

// Entry Conditions
validBreakout = close > high[1] and close > emaFast
volumeConfirmation = volume > volAvg * 1.5
trendConfirmed = close > emaSlow and close[1] > emaSlow
rsiConfirmation = rsi > 50 and not bearishDivergence

// Final Entry Signal
entryCondition = validBreakout and volumeConfirmation and trendConfirmed

// Exit Conditions
stopLossPrice = low[1] - (atr * 0.50)
trailOffset = atr * 2

// Strategy Execution
if (entryCondition)
    strategy.entry("Long", strategy.long)
    strategy.exit("Exit", "Long", stop=stopLossPrice,trail_points=close > emaFast ? trailOffset : na,trail_offset=trailOffset)

// Plotting
plot(emaFast, "Fast EMA", color.new(color.blue, 0))
plot(emaSlow, "Slow EMA", color.new(color.orange, 0))
plotshape(entryCondition, style=shape.triangleup, color=color.green, location=location.belowbar)
Published by ianzeng123 on the FMZ strategy square · last modified 2025-03-31. Collected in the Quant Trading Vault. Unvalidated research: re-test with your own data and costs before trusting it.
Build this with AgenKit
A spec is not a trading system. Paste this into your coding agent and AgenKit runs a specialist team — architecture, test-first build, risk gates, review — with paper trading on by default.
/agenkit build a production-grade trading bot with a backtest engine, risk controls and paper trading by default from strategies/Multi-Indicator-Momentum-Breakout-Quantitative-Trading-Strategy.md- npx agenkit install engineering-kit in your project
- Paste the command into your agent and approve each phase
- Get tests, backtest, risk controls and a paper-trading switch
Understand it first
Before you run this, read the lesson behind the idea and how to backtest it honestly. Specs like this one are the survivors of an unknown number of trials; deflate their results accordingly.
Related specs
- Multi Filter Trend Breakthrough Smart Moving Average Trading StrategyPine Script · Breakout · 1h
- Multi Indicator Trend Breakout Strategy with Dynamic Stop LossPine Script · Breakout · 1d
- Dynamic Trend Momentum Breakout StrategyPine Script · Breakout · 1d
- Enhanced Bollinger Breakout Quantitative Strategy with Momentum Filter Integration SystemPine Script · Breakout · 2d
- Multi Strategy Adaptive Trend Following and Breakout Trading SystemPine Script · Breakout · 1d
- Multi Dimensional Technical Indicator Fusion Trend Breakthrough StrategyPine Script · Breakout · 1h