Strategy vault / Machine learning
Multi indicator Quant Trading Strategy
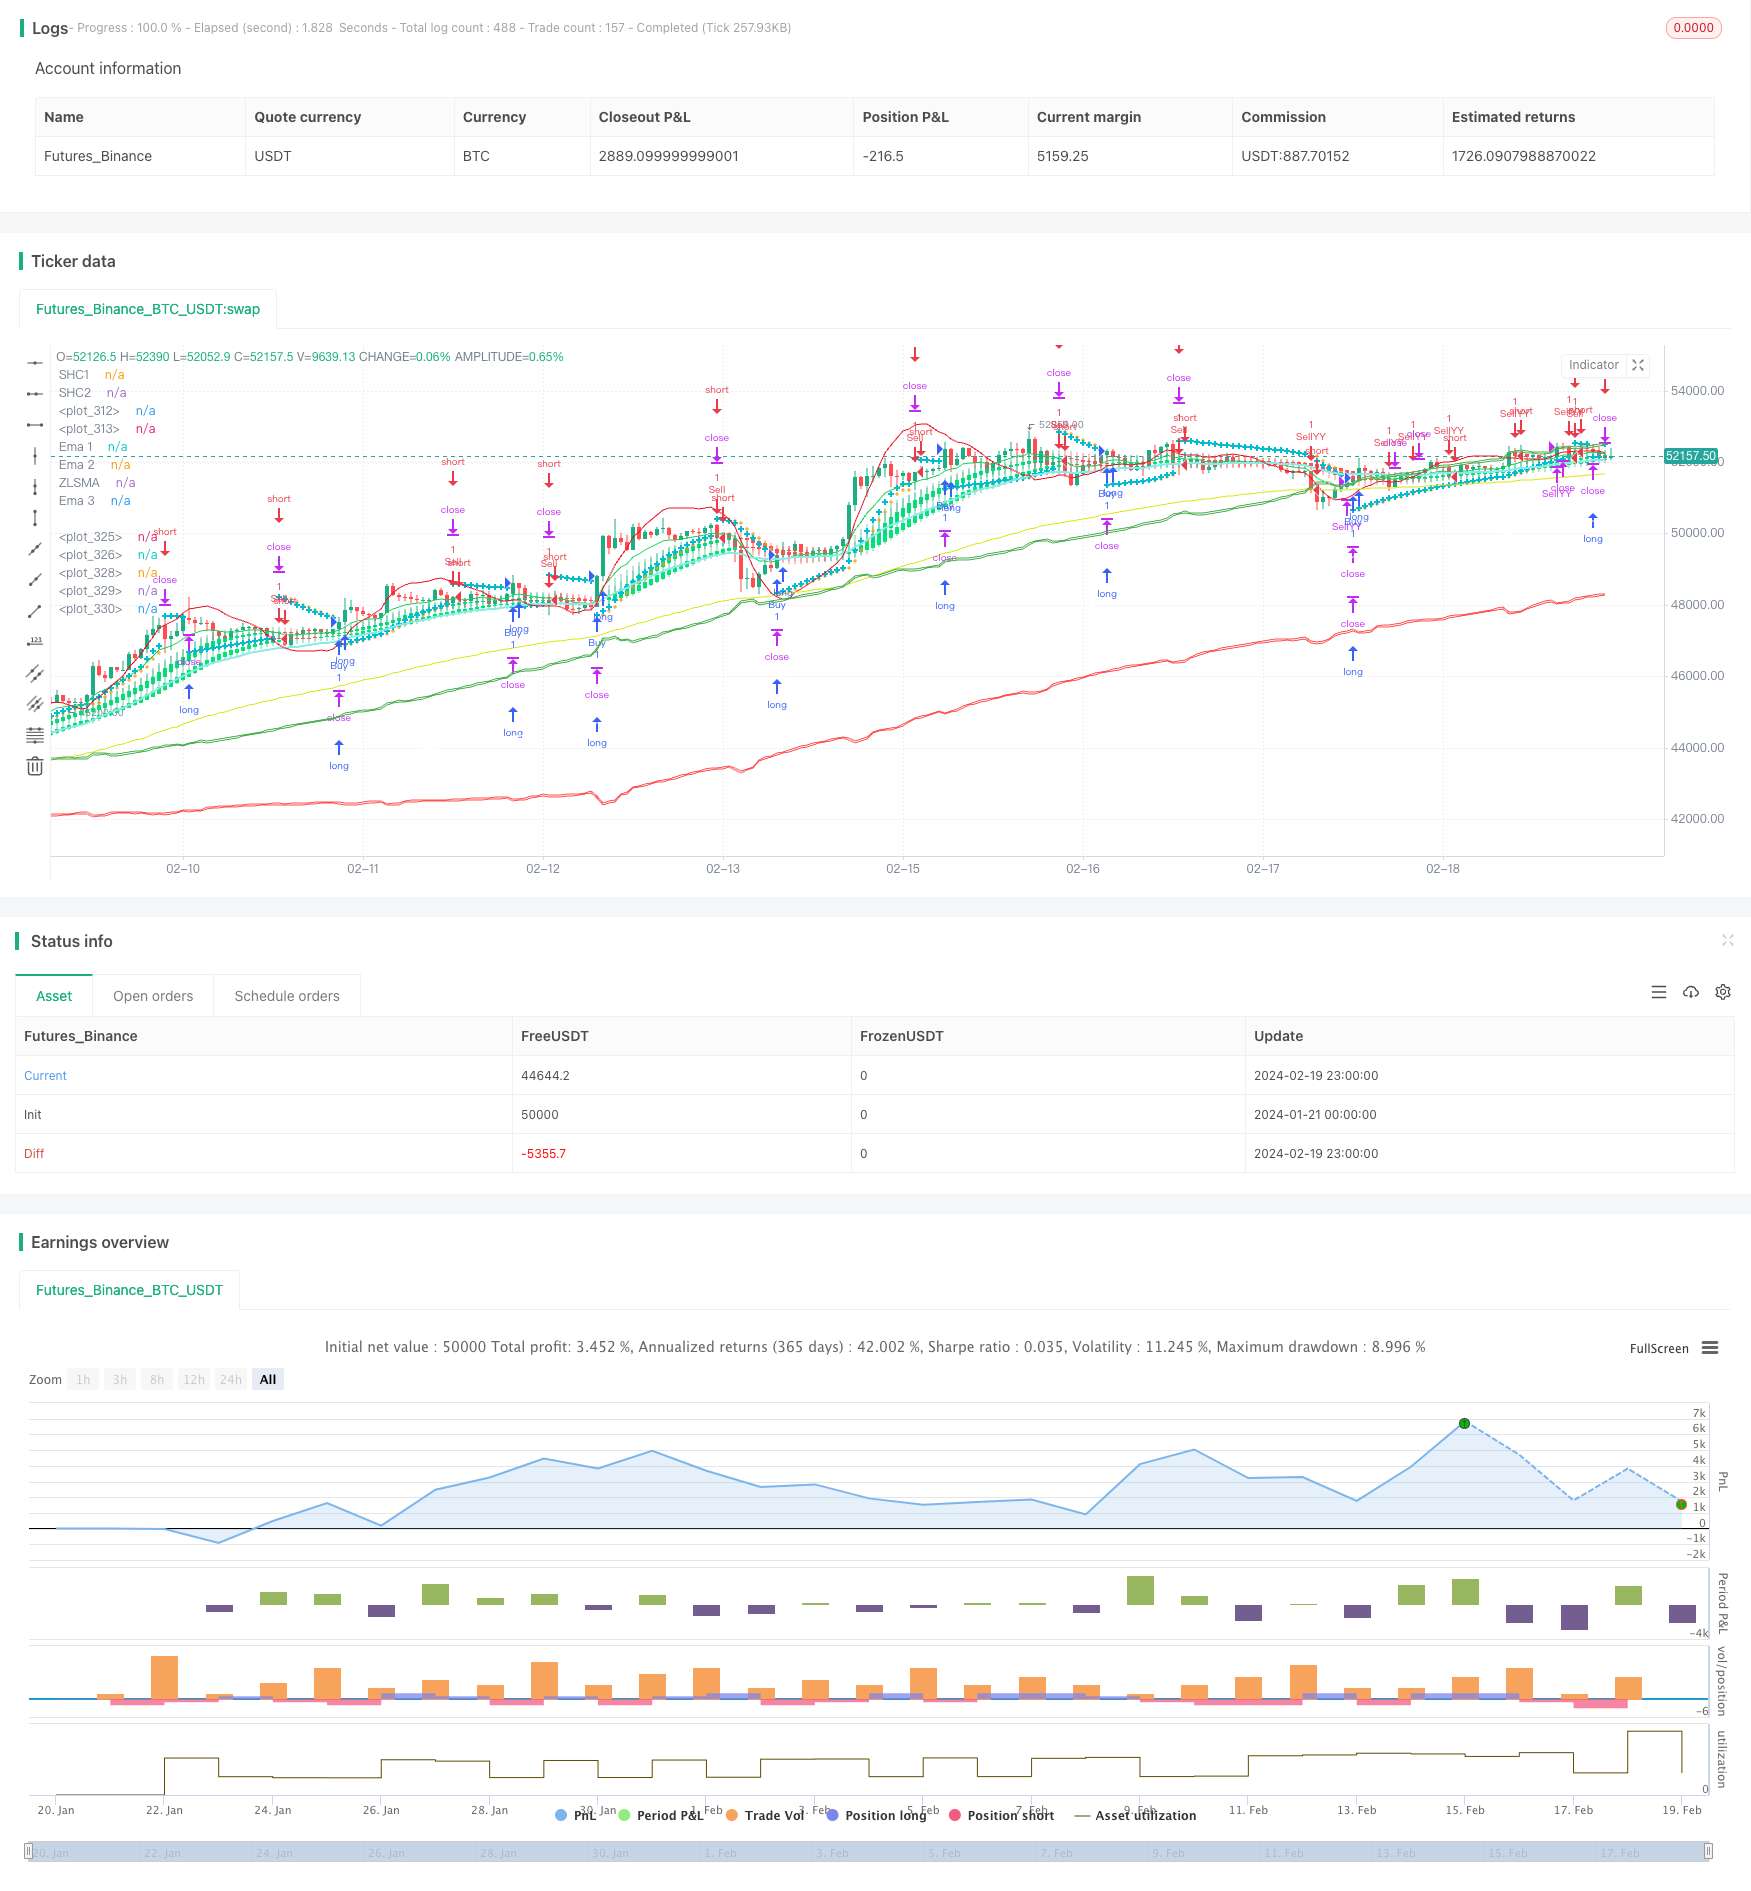
This strategy integrates various technical indicators, including Parabolic SAR, Chandelier Exit, Zero Lag SMA, EMA, and Heikin Ashi, to identify potential buy and sell signals on the chart.
Overview
This strategy integrates various technical indicators, including Parabolic SAR, Chandelier Exit, Zero Lag SMA, EMA, and Heikin Ashi, to identify potential buy and sell signals on the chart.
Strategy Logic
Key Indicators
- Parabolic SAR: Used to determine stop loss points and potential entry points
- Chandelier Exit Strategy: Used to determine trend direction
- Zero Lag SMA: Provides low-lag moving average
- EMA: Tracks trends and price fluctuations
- Smoothed Heikin Ashi: Generates smoothed Heikin Ashi candles
Trading Signals
- Long when Parabolic SAR shows uptrend and price is above 99 EMA; Short when downtrend and price is below 99 EMA
- Combine with Chandelier Exit signals to further confirm trend
- Smoothed Heikin Ashi helps avoid false breaks
Risk Management
- Set stop loss and take profit
- Consider reset conditions to flexibly adjust positions
Strengths Analysis
The biggest strength is the comprehensive combination of indicators for effective trend identification. Parabolic SAR detects potential reversals; Chandelier Exit judges the major trend; Moving averages filter false signals. Cross validation improves accuracy.
In addition, stop loss and take profit controls risks. Smoothed lines avoid short-term noise. The strategy is stable.
Risk Analysis
Conflicting signals can cause difficulties. Improper parameter settings may also negatively impact trading.
There are inherent risks in technical trading that can cause losses. Cautious operation is a must. Blind following should be avoided.
Optimization Directions
- Test and optimize parameters to find the best combination
- Introduce machine learning models for higher accuracy
- Incorporate sentiment indicators and news to assess market conditions and dynamically manage positions
- Improve logics of reset conditions for more flexible signal detection
Conclusion
This strategy integrates indicators for signal identification. Strengths include high accuracy, stability and sound risk control. Overall a worthwhile trading scheme. Further improvements can be made through parameter tuning, model training and sentiment indicator integration.
Parameters
| Name | Default | What it controls |
|---|---|---|
| v_input_1 | 0.02 | start |
| v_input_2 | 0.02 | increment |
| v_input_3 | 0.2 | maximum |
| v_input_int_1 | 10 | Length SHC1 |
| v_input_4 | 10 | len2 |
| v_input_int_2 | 20 | Length SHC2 |
| v_input_5 | 10 | len2Shc2 |
| v_input_int_3 | 32 | Length |
| v_input_int_4 | false | Offset |
| v_input_6_close | 0 | Source: close | high | low | open | hl2 | hlc3 | hlcc4 | ohlc4 |
| v_input_int_5 | 10 | Length |
| v_input_source_1_close | 0 | Source: close | high | low | open | hl2 | hlc3 | hlcc4 | ohlc4 |
| v_input_int_6 | 34 | Length |
| v_input_source_2_close | 0 | Source: close | high | low | open | hl2 | hlc3 | hlcc4 | ohlc4 |
| v_input_int_7 | 99 | Length |
| v_input_source_3_close | 0 | Source: close | high | low | open | hl2 | hlc3 | hlcc4 | ohlc4 |
| v_input_int_8 | true | ATR Period |
| v_input_float_1 | 1.1 | ATR Multiplier |
| v_input_bool_1 | true | Show Buy/Sell Labels ? |
| v_input_bool_2 | true | Use Close Price for Extremums ? |
| v_input_bool_3 | true | Highlight State ? |
| v_input_int_9 | 80 | Trend Length: |
| v_input_source_4_close | 0 | Purchase Source (Long and Short):: close | high | low | open | hl2 | hlc3 | hlcc4 | ohlc4 |
| v_input_source_5_close | 0 | Exit Source (Long and Short):: close | high | low | open | hl2 | hlc3 | hlcc4 | ohlc4 |
| v_input_bool_4 | true | Use Take Profit |
| v_input_bool_5 | true | Use Stop Loss |
| v_input_float_2 | 0.1 | Stoploss Multiplier %: |
| v_input_string_1 | 0 | Reset Purchase Availability After:: Entry | Stop Loss | None |
Source Pine Script
/*backtest
start: 2024-01-21 00:00:00
end: 2024-02-20 00:00:00
period: 1h
basePeriod: 15m
exchanges: [{"eid":"Futures_Binance","currency":"BTC_USDT"}]
*/


//@version=5
strategy("CE-ZLSMA-EMA-SAR-SHC", overlay=true)

// Parabolic SAR Strategy
start = input(0.02)
increment = input(0.02)
maximum = input(0.2)

var bool uptrend = na
var float EP = na
var float SAR = na
var float AF = start
var float nextBarSAR = na
var bool longSar = false
var bool shortSar = false
//input smoothed HAC 1
len=input.int(title="Length SHC1", defval = 10)
o=ta.ema(open,len)
c=ta.ema(close,len)
h=ta.ema(high,len)
l=ta.ema(low,len)

haclose = (o+h+l+c)/4
var haopen = 0.0
if na(haopen[1])
    haopen := (o + c) / 2
else
    haopen := (haopen[1] + haclose[1]) / 2


hahigh = math.max (h, math.max(haopen,haclose))
halow = math.min (l, math.min(haopen,haclose))

len2=input(10)
o2=ta.ema(haopen, len2)
c2=ta.ema(haclose, len2)
h2=ta.ema(hahigh, len2)
l2=ta.ema(halow, len2)

col=o2>c2 ? color.red : color.lime
bool shc1Green = o2 > c2
bool shc1Lime = o2 < c2
//input smoothed HAC 1
lenSHC2=input.int(title="Length SHC2 ", defval = 20)
oShc2=ta.ema(open,lenSHC2)
cShc2=ta.ema(close,lenSHC2)
hShc2=ta.ema(high,lenSHC2)
lShc2=ta.ema(low,lenSHC2)

hacloseShc2 = (oShc2+hShc2+lShc2+cShc2)/4
var haopenShc2 = 0.0
if na(haopenShc2[1])
    haopenShc2 := (oShc2 + cShc2) / 2
else
    haopenShc2 := (haopenShc2[1] + hacloseShc2[1]) / 2


hahighShc2 = math.max (hShc2, math.max(haopenShc2,hacloseShc2))
halowShc2 = math.min (lShc2, math.min(haopenShc2,hacloseShc2))

len2Shc2=input(10)
o2Shc2=ta.ema(haopenShc2, len2Shc2)
c2Shc2=ta.ema(hacloseShc2, len2Shc2)
h2Shc2=ta.ema(hahighShc2, len2Shc2)
l2Shc2=ta.ema(halowShc2, len2Shc2)

colShc2=o2Shc2>c2Shc2 ? color.red : color.lime
bool shc2Green = o2Shc2 > c2Shc2
bool shc2Lime = o2Shc2 < c2Shc2
//end smooth

bool shcGree = shc1Green and shc2Green
bool shcLime = shc1Lime and shc2Lime

//zlsma
lengthZlsma = input.int(title="Length", defval=32)
offset = input.int(title="Offset", defval=0)
src = input(close, title="Source")
lsma = ta.linreg(src, lengthZlsma, offset)
lsma2 = ta.linreg(lsma, lengthZlsma, offset)
eq= lsma-lsma2
zlsma = lsma+eq
// ema 10
len4 = input.int(10, minval=1, title="Length")
src4 = input.source(close, title="Source")
out4 = ta.ema(src4, len4)
//End of format

// ema 34
len5 = input.int(34, minval=1, title="Length")
src5 = input.source(close, title="Source")
out5 = ta.ema(src5, len5)
//end ema 34

// ema 99
len6 = input.int(99, minval=1, title="Length")
src6 = input.source(close, title="Source")
out6 = ta.ema(src6, len6)
// end ema 99

//kiem tra dieu kien gia dong cua lon hon ema99 thi moi me lenh long
bool onEma99 = close > out6
bool downEma99 = open < out6

if bar_index > 0
    firstTrendBar = false
    SAR := nextBarSAR
    if bar_index == 1
        float prevSAR = na
        float prevEP = na
        lowPrev = low[1]
        highPrev = high[1]
        closeCur = close
        closePrev = close[1]
        if closeCur > closePrev
            uptrend := true
            EP := high
            prevSAR := lowPrev
            prevEP := high
        else
            uptrend := false
            EP := low
            prevSAR := highPrev
            prevEP := low
        firstTrendBar := true
        SAR := prevSAR + start * (prevEP - prevSAR)
    if uptrend
		if SAR > low
			firstTrendBar := true
			uptrend := false
			SAR := math.max(EP, high)
			EP := low
			AF := start
	else
		if SAR < high
			firstTrendBar := true
			uptrend := true
			SAR := math.min(EP, low)
			EP := high
			AF := start
	if not firstTrendBar
		if uptrend
			if high > EP
				EP := high
				AF := math.min(AF + increment, maximum)
		else
			if low < EP
				EP := low
				AF := math.min(AF + increment, maximum)
	if uptrend
		SAR := math.min(SAR, low[1])
		if bar_index > 1
			SAR := math.min(SAR, low[2])
	else
		SAR := math.max(SAR, high[1])
		if bar_index > 1
			SAR := math.max(SAR, high[2])
	nextBarSAR := SAR + AF * (EP - SAR)
	if barstate.isconfirmed
		if uptrend
			// log.info("true")
			strategy.entry("ParSE", strategy.short, stop=nextBarSAR, comment="ParSE")
			strategy.cancel("ParLE")
			shortSar := false
			longSar := true
		else
			// log.info("false")
			strategy.entry("ParLE", strategy.long, stop=nextBarSAR, comment="ParLE")
			strategy.cancel("ParSE")
			longSar := false
			shortSar := true

// Chandelier Exit Strategy
length = input.int(title="ATR Period",  defval=1)
mult = input.float(title="ATR Multiplier",  step=0.1, defval=1.1)
showLabels = input.bool(title="Show Buy/Sell Labels ?",  defval=true)
useClose = input.bool(title="Use Close Price for Extremums ?",  defval=true)
highlightState = input.bool(title="Highlight State ?",  defval=true)

atr = mult * ta.atr(length)

longStop = (useClose ? ta.highest(close, length) : ta.highest(length)) - atr
longStopPrev = nz(longStop[1], longStop)
longStop := close[1] > longStopPrev ? math.max(longStop, longStopPrev) : longStop

shortStop = (useClose ? ta.lowest(close, length) : ta.lowest(length)) + atr
shortStopPrev = nz(shortStop[1], shortStop)
shortStop := close[1] < shortStopPrev ? math.min(shortStop, shortStopPrev) : shortStop


var int dir = 1
dir := close > shortStopPrev ? 1 : close < longStopPrev ? -1 : dir

var bool longOpened = false
var bool shortOpended = false
// Entry and exit logic
if (dir == 1)
	if longSar
		if not longOpened
			strategy.close("Sell", disable_alert = true)
    		strategy.order("Buy", strategy.long)
			longOpened := true
			shortOpended := false

if (dir == -1)
	if shortSar
		if not shortOpended
			strategy.close("Buy", disable_alert = true)
			strategy.order("Sell", strategy.short)
			shortOpended := true
			longOpened := false


//strategy YY
// ~~~~~~~~~~~ INPUTS ~~~~~~~~~~~ //
lenYY = input.int(80, "Trend Length:", tooltip="How far back should we span this indicator?\nThis length effects all lengths of the indicator")
purchaseSrc = input.source(close, "Purchase Source (Long and Short):", tooltip="What source needs to exit the purchase zone for a purchase to happen?")
exitSrc = input.source(close, "Exit Source (Long and Short):", tooltip="What source needs to hit a exit condition to stop the trade (Take profit, Stop Loss or hitting the other sides Purchase Zone)?")
useTakeProfit = input.bool(true, "Use Take Profit", tooltip="Should we take profit IF we cross the basis line and then cross it AGAIN?")
useStopLoss = input.bool(true, "Use Stop Loss", tooltip="Stop loss will ensure you don't lose too much if its a bad call")
stopLossMult = input.float(0.1, "Stoploss Multiplier %:", tooltip="How far from the purchase lines should the stop loss be")
resetCondition = input.string("Entry", "Reset Purchase Availability After:", options=["Entry", "Stop Loss", "None"],
 tooltip="If we reset after a condition is hit, this means we can purchase again when the purchase condition is met. \n" +
 "Otherwise, we will only purchase after an opposite signal has appeared.\n" +
 "Entry: means when the close enters the purchase zone (buy or sell).\n" +
 "Stop Loss: means when the close hits the stop loss location (even when were out of a trade)\n" +
 "This allows us to get more trades and also if our stop loss initally was hit but it WAS a good time to purchase, we don't lose that chance.")

// ~~~~~~~~~~~ VARIABLES ~~~~~~~~~~~ //
var bool longStart = na
var bool longAvailable = na
var bool longTakeProfitAvailable = na
var bool longStopLoss = na
var bool shortStart = na
var bool shortAvailable = na
var bool shortTakeProfitAvailable = na
var bool shortStopLoss = na

resetAfterStopLoss = resetCondition == "Stop Loss"
resetAfterEntry = resetCondition == "Entry"

// ~~~~~~~~~~~ CALCULATIONS ~~~~~~~~~~~ //
// Mid Line
midHigh = ta.vwma(ta.highest(high, lenYY), lenYY)
midLow = ta.vwma(ta.lowest(low, lenYY), lenYY)
mid = math.avg(midHigh, midLow)
midSmoothed = ta.ema(mid, lenYY)

//Volume Filtered
avgVol = ta.vwma(volume, lenYY)
volDiff = volume / avgVol
midVolSmoothed = ta.vwma(midSmoothed * volDiff, 3)

//RSI Filtered
midDifference = ta.sma(midHigh - midLow, lenYY)
midRSI = ta.rsi(midVolSmoothed, lenYY) * 0.01
midAdd = midRSI * midDifference

//Calculate Zones
purchaseZoneHigh = midSmoothed + midAdd
purchaseZoneLow = midSmoothed - midAdd
purchaseZoneBasis = math.avg(purchaseZoneHigh, purchaseZoneLow)

//Create Stop Loss Locations
stopLossHigh = purchaseZoneHigh * (1 + (stopLossMult * 0.01))
stopLossLow = purchaseZoneLow * (1 - (stopLossMult * 0.01))

// ~~~~~~~~~~~ PURCHASE CALCULATIONS ~~~~~~~~~~~ //
//Long
longEntry = ta.crossunder(purchaseSrc, purchaseZoneLow)
longStart := ta.crossover(purchaseSrc, purchaseZoneLow) and longAvailable
longAvailable := ta.crossunder(purchaseSrc, purchaseZoneHigh) or (resetAfterStopLoss and longStopLoss) or (resetAfterEntry and longEntry) ? true : longStart ? false : longAvailable[1]
longEnd = ta.crossover(exitSrc, purchaseZoneHigh)
longStopLoss := ta.crossunder(exitSrc, stopLossLow)
longTakeProfitAvailable := ta.crossover(exitSrc, purchaseZoneBasis) ? true : longEnd ? false : longTakeProfitAvailable[1]
longTakeProfit = ta.crossunder(exitSrc, purchaseZoneBasis) and longTakeProfitAvailable

//Short
shortEntry = ta.crossover(purchaseSrc, purchaseZoneHigh)
shortStart := ta.crossunder(purchaseSrc, purchaseZoneHigh) and shortAvailable
shortAvailable := ta.crossover(purchaseSrc, purchaseZoneLow) or (resetAfterStopLoss and shortStopLoss) or (resetAfterEntry and shortEntry)? true : shortStart ? false : shortAvailable[1]
shortEnd = ta.crossunder(exitSrc, purchaseZoneLow)
shortStopLoss := ta.crossover(exitSrc, stopLossHigh)
shortTakeProfitAvailable := ta.crossunder(exitSrc, purchaseZoneBasis) ? true : shortEnd ? false : shortTakeProfitAvailable[1]
shortTakeProfit = ta.crossover(exitSrc, purchaseZoneBasis) and shortTakeProfitAvailable

// ~~~~~~~~~~~ STRATEGY ~~~~~~~~~~~ //
var bool openLongYY = false
var bool openShortYY = false
if (longStart)
    strategy.order("BuyYY", strategy.long)
	strategy.close("SellYY", disable_alert = true)
	openLongYY := true
	openShortYY := false
else if (longEnd or (useStopLoss and longStopLoss) or (useTakeProfit and longTakeProfit))
    strategy.close("BuyYY", disable_alert = true)

if (shortStart)
	strategy.close("BuyYY", disable_alert = true)
    strategy.order("SellYY", strategy.short)
	openShortYY := true
	openLongYY := false
else if (shortEnd or (useStopLoss and shortStopLoss) or (useTakeProfit and shortTakeProfit))
    strategy.close("SellYY", disable_alert = true)

// ~~~~~~~~~~~ ALERTS ~~~~~~~~~~~ //
// if longStart or (longEnd or (useStopLoss and longStopLoss) or (useTakeProfit and longTakeProfit)) or shortStart or (shortEnd or (useStopLoss and shortStopLoss) or (useTakeProfit and shortTakeProfit))
//     alert("{{strategy.order.action}} | {{ticker}} | {{close}}", alert.freq_once_per_bar)

// Plotting
plot(SAR, style=plot.style_cross, linewidth=1, color=color.orange)
plot(nextBarSAR, style=plot.style_cross, linewidth=3, color=color.aqua)
plot(zlsma, color=color.rgb(235, 15, 33), linewidth=1, title = "ZLSMA")

plot(out4, color=color.rgb(24, 209, 85), title="Ema 1")
plot(out5, color=color.rgb(139, 234, 231), linewidth = 2, title="Ema 2")
plot(out6, color=color.rgb(219, 230, 18), title="Ema 3")

plotcandle(o2, h2, l2, c2, title="SHC1", color=col)
plotcandle(o2Shc2, hShc2, l2Shc2, c2Shc2, title="SHC2", color=col)


// ~~~~~~~~~~~ PLOTS YY ~~~~~~~~~~~ //
shortLine = plot(purchaseZoneHigh, color=color.green)
shortStopLossLine = plot(stopLossHigh, color=color.green) //color=color.rgb(0, 97, 3)
fill(shortLine, shortStopLossLine, color = color.new(color.green, 90))
plot(purchaseZoneBasis, color=color.white)
longLine = plot(purchaseZoneLow, color=color.red)
longStopLossLine = plot(stopLossLow, color=color.red) //color=color.rgb(105, 0, 0)
fill(longLine, longStopLossLine, color=color.new(color.red, 90))
Published by ChaoZhang on the FMZ strategy square · last modified 2024-02-21. Collected in the Quant Trading Vault. Unvalidated research: re-test with your own data and costs before trusting it.
Build this with AgenKit
A spec is not a trading system. Paste this into your coding agent and AgenKit runs a specialist team — architecture, test-first build, risk gates, review — with paper trading on by default.
/agenkit build a production-grade trading bot with a backtest engine, risk controls and paper trading by default from strategies/Multi-indicator-Quant-Trading-Strategy.md- npx agenkit install engineering-kit in your project
- Paste the command into your agent and approve each phase
- Get tests, backtest, risk controls and a paper-trading switch
Understand it first
Before you run this, read the lesson behind the idea and how to backtest it honestly. Specs like this one are the survivors of an unknown number of trials; deflate their results accordingly.
Related specs
- Triple Moving Average Combined with MACD Quantitative StrategyPine Script · Machine learning · 1d
- ADX EFI 50 Moving Average Channel Pullback StrategyPine Script · Machine learning · 1h
- Multi indicator Combination StrategyPine Script · Machine learning · 1d
- Liquidity Dynamic Risk Management Multi Factor Trading StrategyPine Script · Machine learning · 1h
- AI Driven Dynamic Volatility Adaptive Trend Breakout Trading StrategyPine Script · Machine learning · 2d
- High Frequency Hybrid Technical Analysis Quantitative StrategyPine Script · Machine learning · 15m