Strategy vault / Mean reversion
Multi Indicator Synergistic Trading Strategy with Bollinger Bands Fibonacci MACD and RSI
This strategy is a comprehensive trading system that combines multiple technical indicators including Bollinger Bands, Fibonacci retracement, MACD, and RSI. The strategy captures trading opportunities under different…
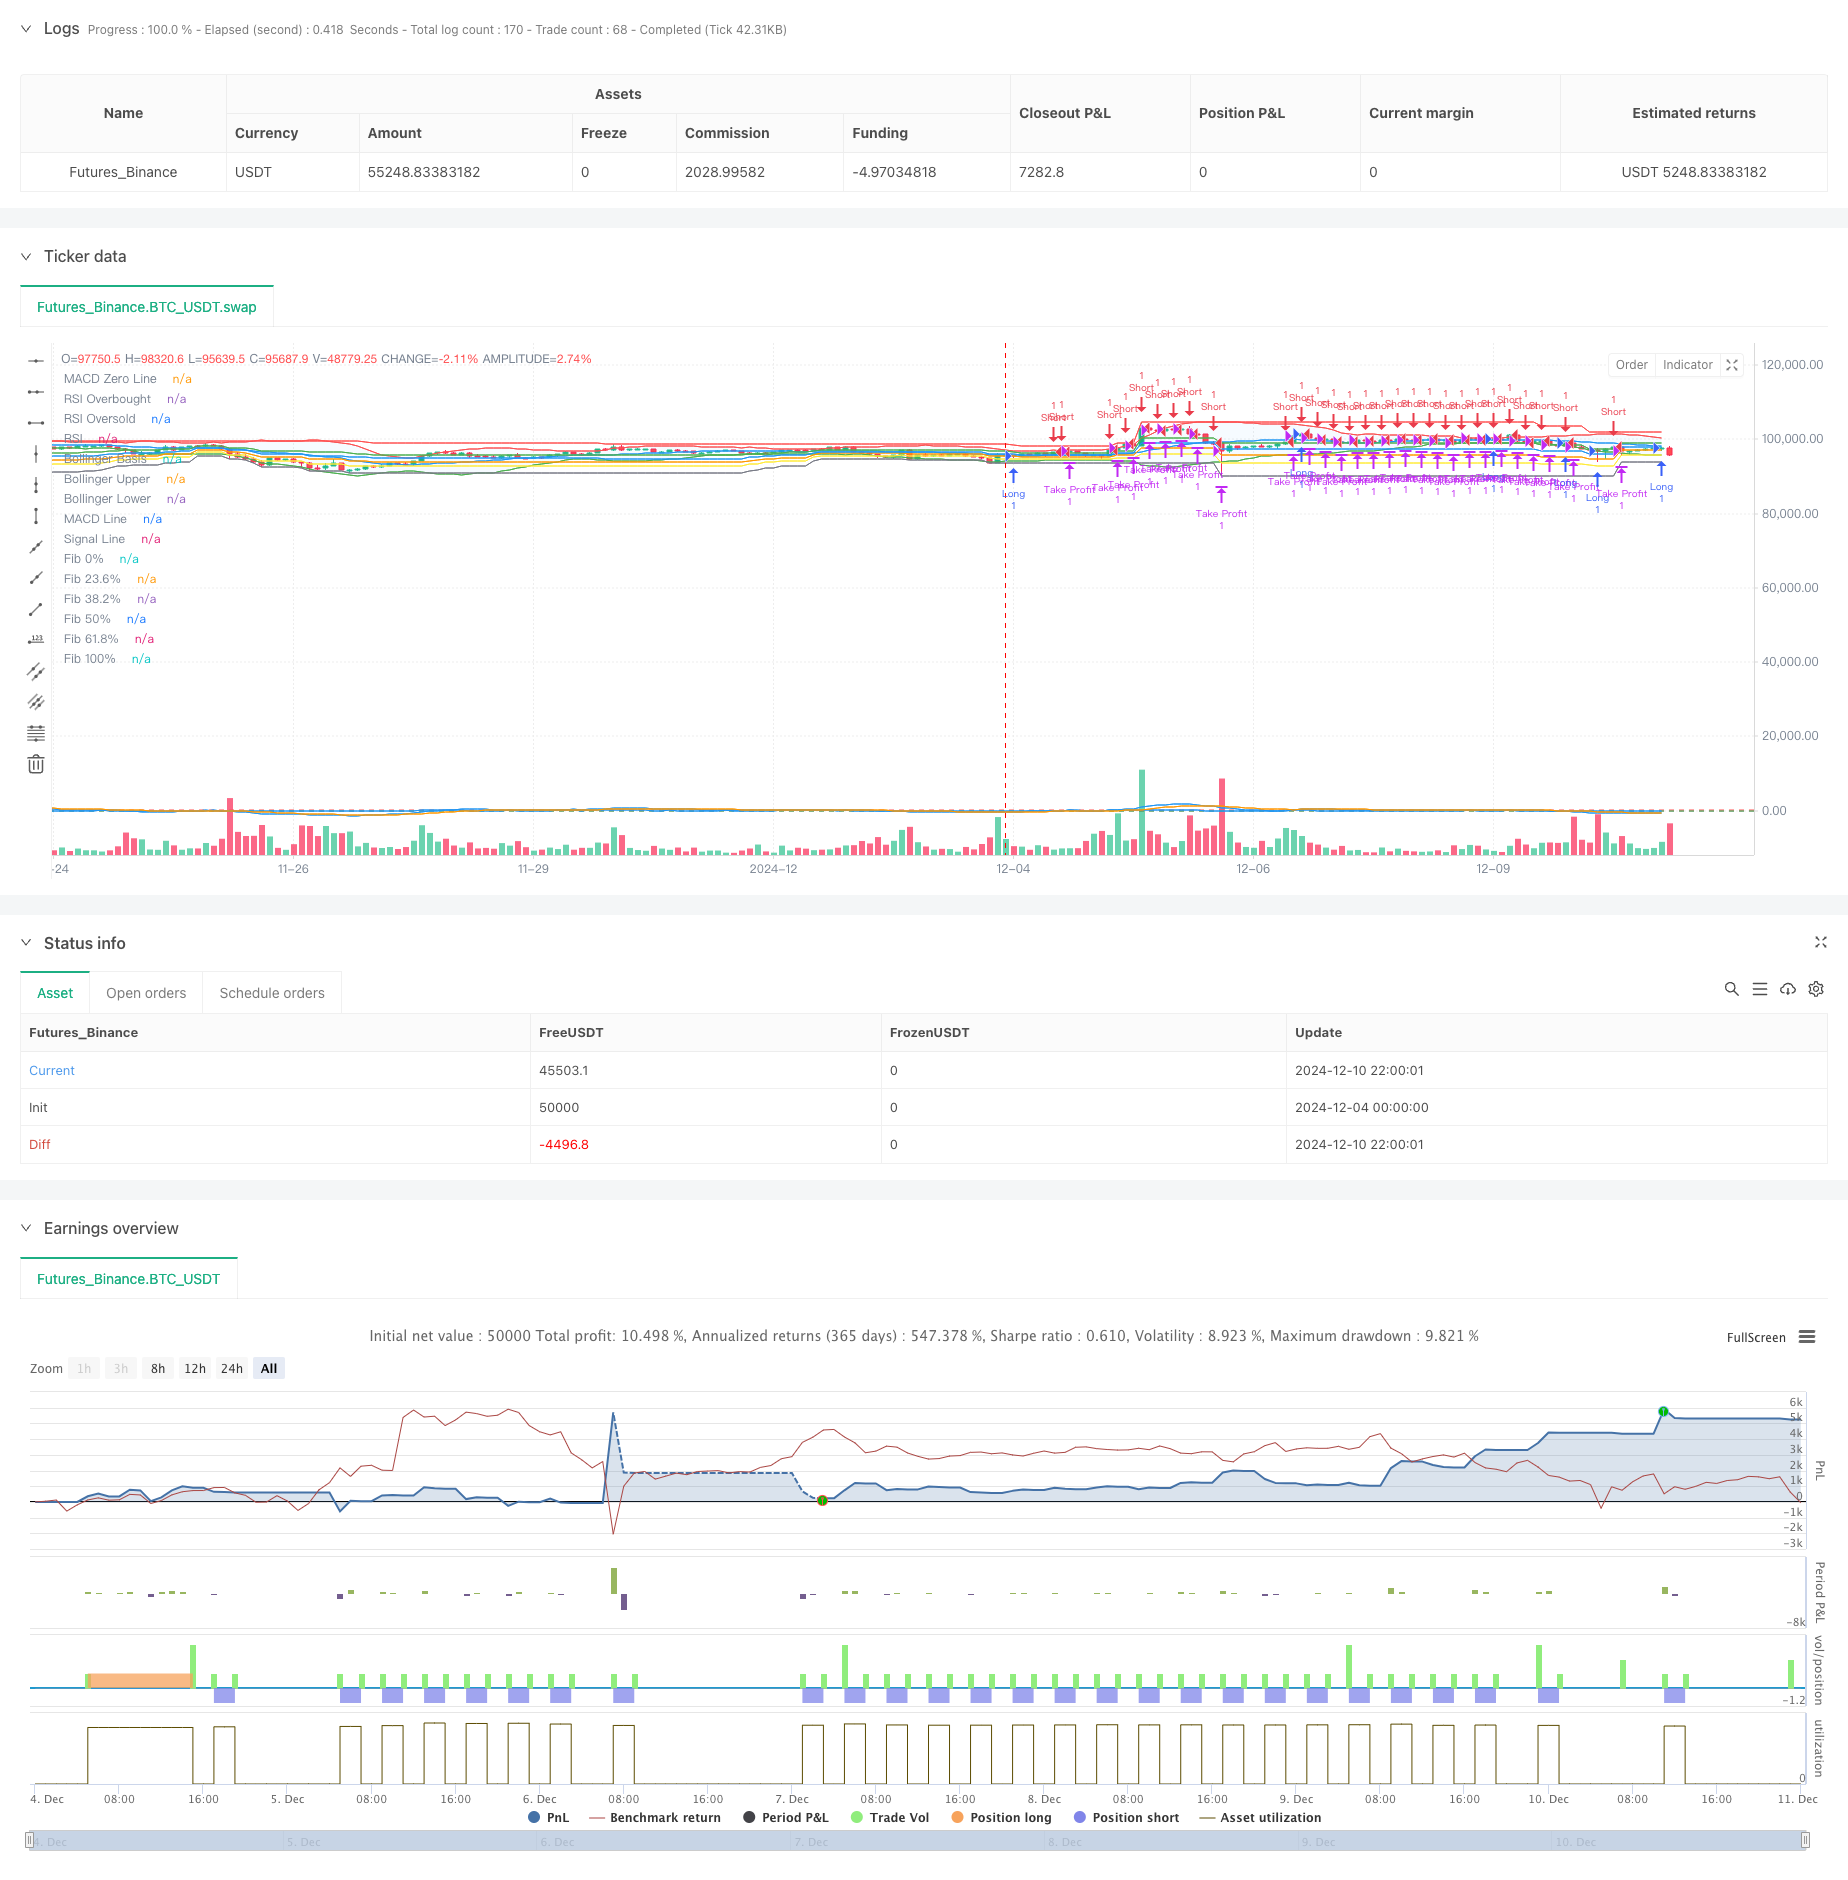
Overview
This strategy is a comprehensive trading system that combines multiple technical indicators including Bollinger Bands, Fibonacci retracement, MACD, and RSI. The strategy captures trading opportunities under different market conditions through multi-indicator coordination and applies maximum profit take-profit method for risk control. The system adopts a modular design with flexible indicator parameters, offering strong adaptability and practicality.
Strategy Principles
The strategy uses four main technical indicators to generate trading signals:
- Bollinger Bands signals: Price breaking below the lower band generates long signals, breaking above the upper band generates short signals
- Fibonacci signals: Price in 0-23.6% range generates long signals, in 61.8-100% range generates short signals
- MACD signals: MACD line crossing above signal line generates long signals, crossing below generates short signals
- RSI signals: RSI below oversold level generates long signals, above overbought level generates short signals Trading begins when any indicator generates a signal. The strategy also applies a maximum profit take-profit method, automatically closing positions when reaching preset profit targets or stop-loss levels.
Strategy Advantages
- Multi-indicator synergy: Improves signal reliability through integration of multiple technical indicators
- High flexibility: Indicator parameters can be adjusted for different market environments
- Comprehensive risk control: Combines maximum profit take-profit with fixed stop-loss
- Good adaptability: Strategy can adapt to different market cycles and volatility conditions
- High execution efficiency: Clear code structure with moderate computational load
Strategy Risks
- Signal overlap: Multiple indicators generating signals simultaneously may lead to overtrading
- Parameter sensitivity: Different parameter combinations may produce significantly different results
- Market adaptability: May underperform in certain market conditions
- Slippage impact: High-frequency trading may be affected by slippage
- Money management: Requires proper position sizing for risk control
Strategy Optimization
- Signal weighting: Add weights to different indicators to improve signal quality
- Market environment recognition: Add market environment recognition module to adjust strategy accordingly
- Dynamic parameters: Introduce adaptive parameter adjustment mechanism
- Trading costs: Optimize trading frequency to reduce costs
- Signal filtering: Add additional filtering conditions to reduce false signals
Summary
This strategy achieves trading efficiency while maintaining stability through multi-indicator coordination. Despite certain risks, it has practical value through proper risk control and continuous optimization. Thorough backtesting and parameter optimization are recommended before live trading.
Source Pine Script
/*backtest
start: 2024-12-04 00:00:00
end: 2024-12-11 00:00:00
period: 2h
basePeriod: 2h
exchanges: [{"eid":"Futures_Binance","currency":"BTC_USDT"}]
*/

//@version=5
strategy("Demo GPT Bollinger, Fibonacci, MACD & RSI with Max Profit Exit", overlay=true)

// === User Inputs for Bollinger Bands ===
length_bb = input.int(20, minval=1, title="Bollinger Bands Length")
maType_bb = input.string("SMA", title="Bollinger Bands MA Type", options=["SMA", "EMA", "SMMA (RMA)", "WMA", "VWMA"])
src_bb = input(close, title="Bollinger Bands Source")
mult_bb = input.float(2.0, minval=0.001, maxval=50, title="Bollinger Bands StdDev")
offset_bb = input.int(0, title="Bollinger Bands Offset", minval=-500, maxval=500)

// === User Inputs for Fibonacci Levels ===
lookback_fib = input.int(50, minval=1, title="Fibonacci Lookback Period")

// === User Inputs for MACD ===
macd_fast = input.int(12, minval=1, title="MACD Fast Length")
macd_slow = input.int(26, minval=1, title="MACD Slow Length")
macd_signal = input.int(9, minval=1, title="MACD Signal Length")

// === User Inputs for RSI ===
rsi_length = input.int(14, title="RSI Length")
rsi_overbought = input.int(70, title="RSI Overbought Level")
rsi_oversold = input.int(30, title="RSI Oversold Level")

// === Start and End Date Inputs ===
start_date = input(timestamp("2023-01-01 00:00:00"), title="Start Date")
end_date = input(timestamp("2069-12-31 23:59:59"), title="End Date")

// === Moving Average Function ===
ma(source, length, _type) =>
    switch _type
        "SMA" => ta.sma(source, length)
        "EMA" => ta.ema(source, length)
        "SMMA (RMA)" => ta.rma(source, length)
        "WMA" => ta.wma(source, length)
        "VWMA" => ta.vwma(source, length)

// === Bollinger Bands Calculation ===
basis_bb = ma(src_bb, length_bb, maType_bb)
dev_bb = mult_bb * ta.stdev(src_bb, length_bb)
upper_bb = basis_bb + dev_bb
lower_bb = basis_bb - dev_bb

// === Fibonacci Levels Calculation ===
highest_price = ta.highest(high, lookback_fib)
lowest_price = ta.lowest(low, lookback_fib)

fib_0 = lowest_price
fib_23 = lowest_price + 0.236 * (highest_price - lowest_price)
fib_38 = lowest_price + 0.382 * (highest_price - lowest_price)
fib_50 = lowest_price + 0.5 * (highest_price - lowest_price)
fib_61 = lowest_price + 0.618 * (highest_price - lowest_price)
fib_100 = highest_price

// === MACD Calculation ===
[macd_line, signal_line, _] = ta.macd(close, macd_fast, macd_slow, macd_signal)

// === RSI Calculation ===
rsi = ta.rsi(close, rsi_length)

// === Plotting for Reference ===
plot(basis_bb, "Bollinger Basis", color=color.blue, offset=offset_bb)
p1_bb = plot(upper_bb, "Bollinger Upper", color=color.red, offset=offset_bb)
p2_bb = plot(lower_bb, "Bollinger Lower", color=color.green, offset=offset_bb)
fill(p1_bb, p2_bb, title="Bollinger Bands Background", color=color.rgb(33, 150, 243, 95))

plot(fib_0, "Fib 0%", color=color.gray)
plot(fib_23, "Fib 23.6%", color=color.yellow)
plot(fib_38, "Fib 38.2%", color=color.orange)
plot(fib_50, "Fib 50%", color=color.blue)
plot(fib_61, "Fib 61.8%", color=color.green)
plot(fib_100, "Fib 100%", color=color.red)

hline(0, "MACD Zero Line", color=color.gray)
plot(macd_line, "MACD Line", color=color.blue)
plot(signal_line, "Signal Line", color=color.orange)

hline(rsi_overbought, "RSI Overbought", color=color.red)
hline(rsi_oversold, "RSI Oversold", color=color.green)
plot(rsi, "RSI", color=color.blue)

// === Combined Trading Logic ===
// Bollinger Bands Signals
long_bb = ta.crossover(close, lower_bb)
short_bb = ta.crossunder(close, upper_bb)

// Fibonacci Signals
long_fib = close <= fib_23 and close >= fib_0
short_fib = close >= fib_61 and close <= fib_100

// MACD Signals
long_macd = ta.crossover(macd_line, signal_line)
short_macd = ta.crossunder(macd_line, signal_line)

// RSI Signals
long_rsi = rsi < rsi_oversold
short_rsi = rsi > rsi_overbought

// Combined Long and Short Conditions
long_condition = (long_bb or long_fib or long_macd or long_rsi)
short_condition = (short_bb or short_fib or short_macd or short_rsi)
// === Max Profit Exit Logic ===
// Define the maximum profit exit percentage
take_profit_percentage = input.float(5.0, title="Take Profit (%)", minval=0.1, maxval=100) / 100
stop_loss_percentage = input.float(2.0, title="Stop Loss (%)", minval=0.1, maxval=100) / 100

// Track the highest price during the trade
var float max_profit_price = na
if (strategy.opentrades > 0)
    max_profit_price := na(max_profit_price) ? strategy.opentrades.entry_price(0) : math.max(max_profit_price, high)

// Calculate the take profit and stop loss levels based on the max profit price
take_profit_level = max_profit_price * (1 + take_profit_percentage)
stop_loss_level = max_profit_price * (1 - stop_loss_percentage)

// Exit the trade if the take profit or stop loss level is hit
if (strategy.opentrades > 0)
    if (close >= take_profit_level)
        strategy.exit("Take Profit", from_entry="Long", limit=take_profit_level)
    if (close <= stop_loss_level)
        strategy.exit("Stop Loss", from_entry="Long", stop=stop_loss_level)

if (strategy.opentrades > 0)
    if (close <= take_profit_level)
        strategy.exit("Take Profit", from_entry="Short", limit=take_profit_level)
    if (close >= stop_loss_level)
        strategy.exit("Stop Loss", from_entry="Short", stop=stop_loss_level)

// === Execute Trades ===
if (long_condition)
    strategy.entry("Long", strategy.long, when=not na(long_condition))

if (short_condition)
    strategy.entry("Short", strategy.short, when=not na(short_condition))
Published by ChaoZhang on the FMZ strategy square · last modified 2024-12-12. Collected in the Quant Trading Vault. Unvalidated research: re-test with your own data and costs before trusting it.
Build this with AgenKit
A spec is not a trading system. Paste this into your coding agent and AgenKit runs a specialist team — architecture, test-first build, risk gates, review — with paper trading on by default.
/agenkit build a production-grade trading bot with a backtest engine, risk controls and paper trading by default from strategies/Multi-Indicator-Synergistic-Trading-Strategy-with-Bollinger-Bands-Fibonacci-MACD-and-RSI.md- npx agenkit install engineering-kit in your project
- Paste the command into your agent and approve each phase
- Get tests, backtest, risk controls and a paper-trading switch
Understand it first
Before you run this, read the lesson behind the idea and how to backtest it honestly. Specs like this one are the survivors of an unknown number of trials; deflate their results accordingly.
Related specs
- Advanced 15 Minute Chart Trading Signal StrategyPine Script · Mean reversion · 3h
- CCTBBO Reversal Tracking StrategyPine Script · Mean reversion · 45m
- Multi Timeframe Gold Reversal Tracking StrategyPine Script · Mean reversion · 2h
- Bollinger Bands and VWAP based Quantitative Trading StrategyPine Script · Mean reversion · 1h
- MACD RSI and EMA StrategyPine Script · Mean reversion · 1d
- Reversal Catcher StrategyPine Script · Mean reversion · 1h