Strategy vault / Trend following
Multi Indicator Trend Following Strategy with ATR Dynamic Stop Loss Take Profit
This strategy is a trend-following trading system based on multiple technical indicators. It combines Exponential Moving Averages (EMA), Relative Strength Index (RSI), Volume, and Average True Range (ATR) to…
Overview
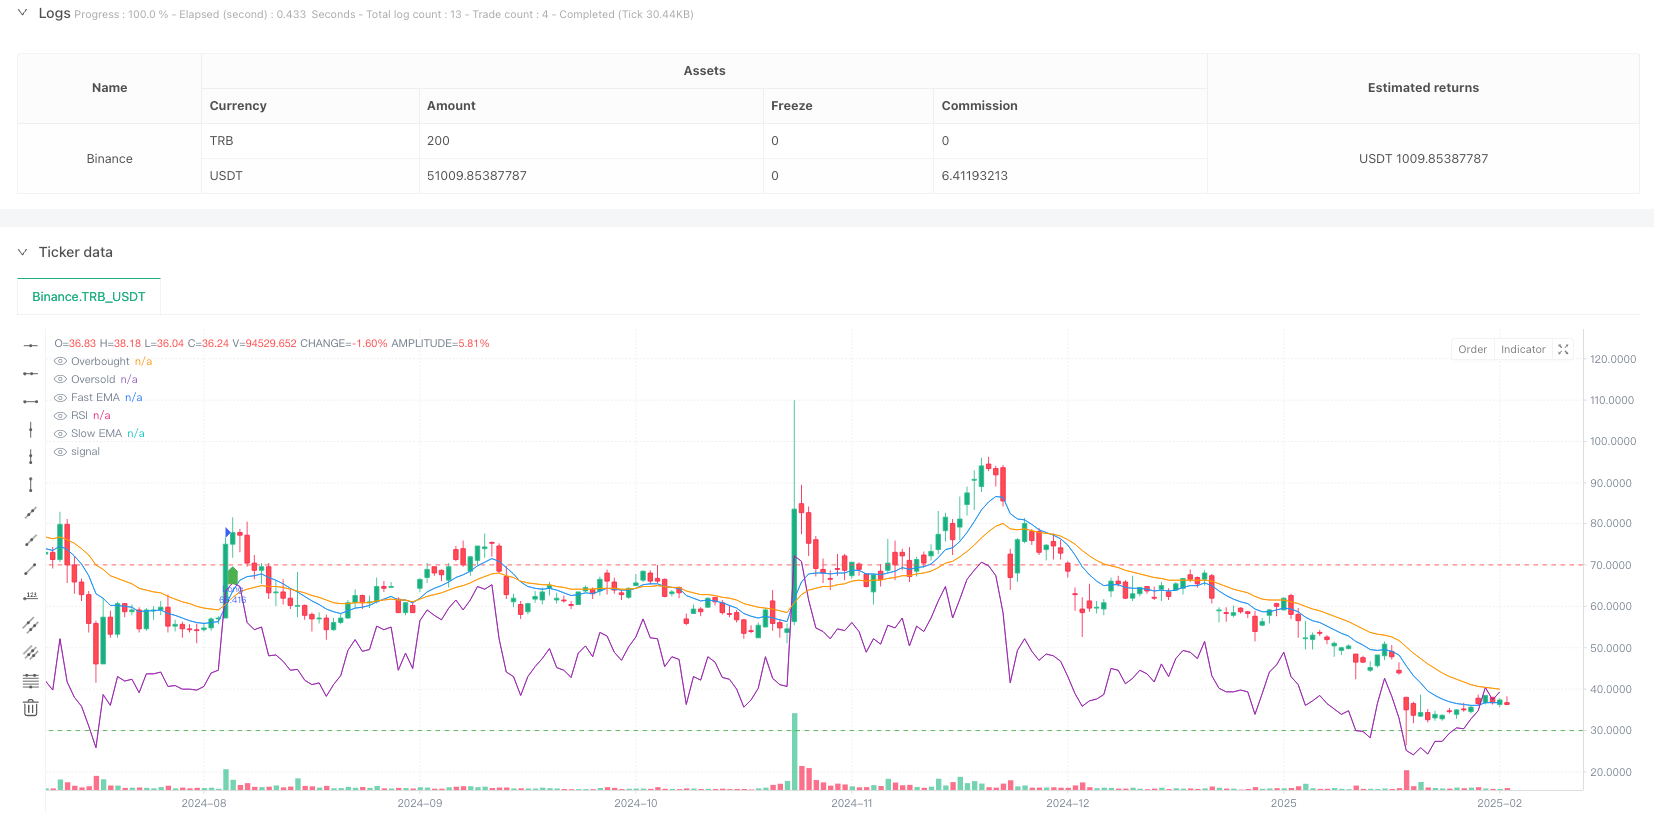
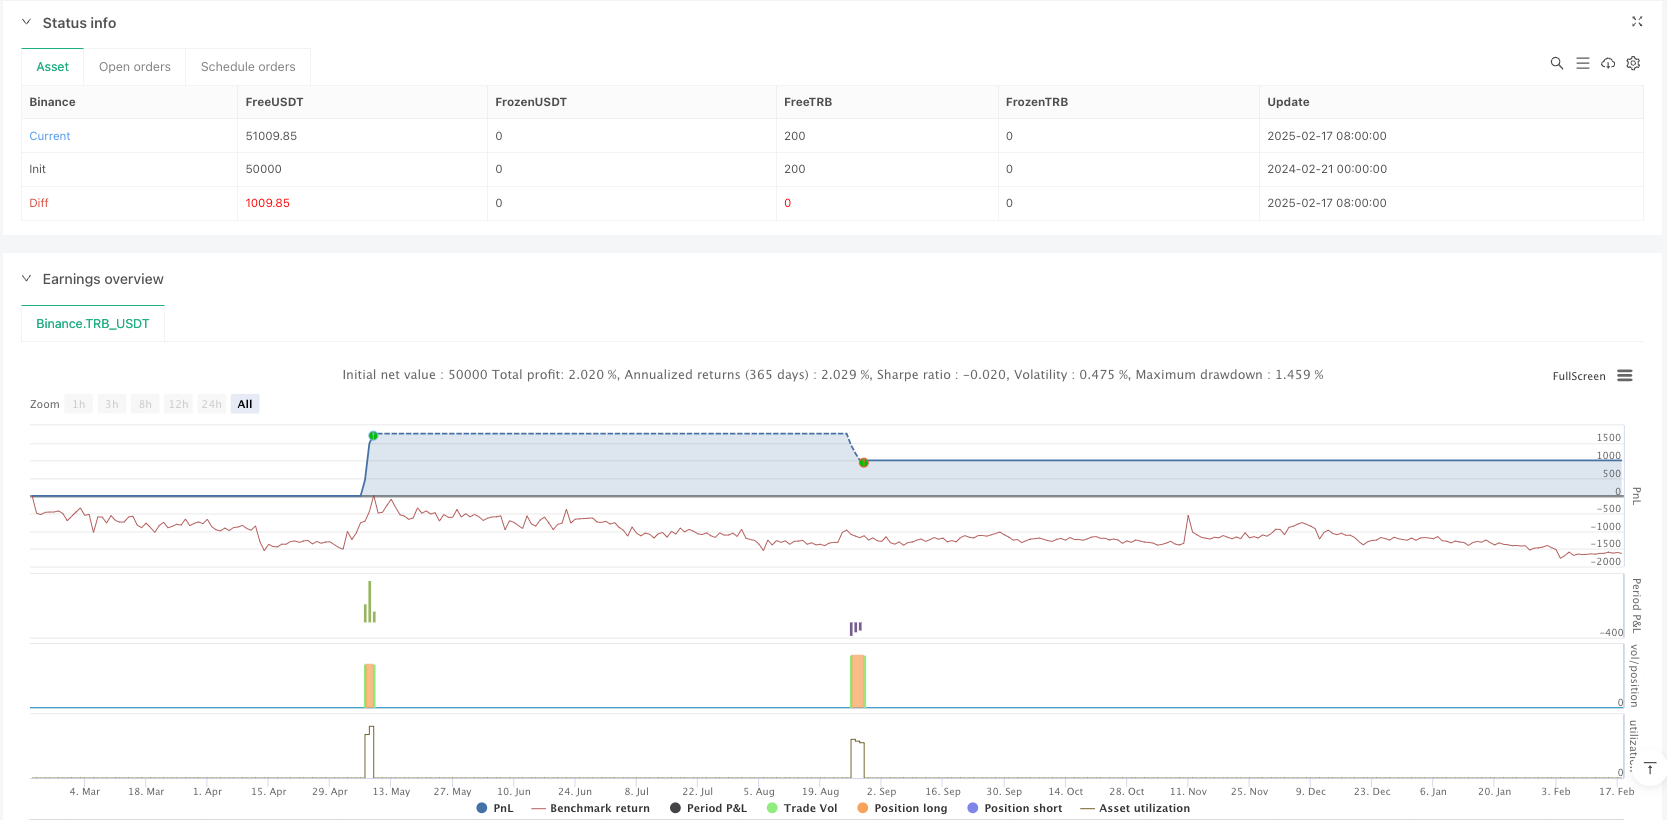
This strategy is a trend-following trading system based on multiple technical indicators. It combines Exponential Moving Averages (EMA), Relative Strength Index (RSI), Volume, and Average True Range (ATR) to determine entry points, while using ATR for dynamic stop-loss and take-profit levels. The strategy also incorporates candle breakout confirmation to enhance signal reliability.
Strategy Principles
The strategy uses the crossover of fast EMA (9-period) and slow EMA (21-period) to capture trend changes. It incorporates RSI (14-period) to filter out overbought and oversold regions, requiring RSI values to be outside overbought (70) and oversold (30) zones. Additionally, the strategy requires volume to be above its 20-period moving average and price to break the previous candle's high/low for confirmation. Once entered, it employs ATR-based dynamic stop-loss (1.5x ATR), take-profit (3x ATR), and trailing stop (1x ATR) mechanisms to protect profits.
Strategy Advantages
- Multiple technical indicators enhance signal reliability
- Dynamic stop-loss and take-profit levels adapt to market volatility
- Trailing stop mechanism effectively protects profits
- Volume confirmation reduces false breakouts
- Candle breakout confirmation increases trade accuracy
- Strategy parameters can be flexibly adjusted for different markets
Strategy Risks
- Multiple indicators may cause missed trading opportunities
- Frequent false signals in ranging markets
- Rapid volatile movements may lead to suboptimal stop-loss placement
- Large gaps may breach stop-loss levels causing unexpected losses Risk management recommendations:
- Regular optimization of indicator parameters
- Filter trades using higher timeframe trends
- Set daily maximum trade limits
- Implement proper money management plans
Optimization Directions
Introduce Adaptive Indicator Parameters: Automatically adjust EMA and RSI periods based on market volatility for better adaptation to different market conditions.
Add Market Environment Filters: Incorporate trend strength indicators like ADX to reduce position size or pause trading in ranging markets.
Optimize Stop-Loss Strategy: Consider incorporating support/resistance levels for more effective stop-loss placement.
Enhance Position Sizing: Dynamically adjust position sizes based on market volatility and liquidity.
Summary
This is a well-structured trend-following strategy with solid logic. The combination of multiple technical indicators ensures reliable trading signals while effectively controlling risks. The dynamic stop-loss and take-profit settings provide favorable risk-reward ratios. The strategy has significant optimization potential and can be continuously improved to adapt to various market conditions.
Source Pine Script
/*backtest
start: 2024-02-21 00:00:00
end: 2025-02-18 08:00:00
period: 1d
basePeriod: 1d
exchanges: [{"eid":"Binance","currency":"TRB_USDT"}]
*/

//@version=6
strategy("15m EMA RSI Strategy with ATR SL/TP and Candle Break Confirmation", overlay=true, initial_capital=100000, default_qty_type=strategy.percent_of_equity, default_qty_value=10)

// INPUTS
fastLength         = input.int(9, title="Fast EMA Length")
slowLength         = input.int(21, title="Slow EMA Length")
rsiLength          = input.int(14, title="RSI Length")
rsiOverbought      = input.int(70, title="RSI Overbought Level")
rsiOversold        = input.int(30, title="RSI Oversold Level")
volLength          = input.int(20, title="Volume MA Length")
atrLength          = input.int(14, title="ATR Length")
atrMultiplierSL    = input.float(1.5, title="ATR Multiplier for Stop Loss")
atrMultiplierTP    = input.float(3.0, title="ATR Multiplier for Take Profit")
trailingStopMultiplier = input.float(1.0, title="ATR Multiplier for Trailing Stop")

// INDICATOR CALCULATIONS
fastEMA  = ta.ema(close, fastLength)
slowEMA  = ta.ema(close, slowLength)
rsiValue = ta.rsi(close, rsiLength)
volMA    = ta.sma(volume, volLength)
atr      = ta.atr(atrLength)

// Candle Breakout Conditions for Confirmation
longCandleBreak  = close > high[1]
shortCandleBreak = close < low[1]

// Plot EMAs for visual reference
plot(fastEMA, color=color.blue, title="Fast EMA")
plot(slowEMA, color=color.orange, title="Slow EMA")

// ENTRY CONDITIONS
longCondition = ta.crossover(fastEMA, slowEMA) and (rsiValue < rsiOverbought) and (volume > volMA) and longCandleBreak
shortCondition = ta.crossunder(fastEMA, slowEMA) and (rsiValue > rsiOversold) and (volume > volMA) and shortCandleBreak

// Plot Buy/Sell Signals on the Chart
plotshape(longCondition, title="Buy Signal", location=location.belowbar, color=color.green, style=shape.labelup, size=size.normal)
plotshape(shortCondition, title="Sell Signal", location=location.abovebar, color=color.red, style=shape.labeldown, size=size.normal)

// TRADE EXECUTION WITH ATR-BASED STOP LOSS, TAKE PROFIT, AND TRAILING STOP
if longCondition
    longStop = close - atrMultiplierSL * atr
    longTP   = close + atrMultiplierTP * atr
    strategy.entry("Long", strategy.long)
    strategy.exit("Exit Long", from_entry="Long", stop=longStop, limit=longTP, trail_points=atr * trailingStopMultiplier)

if shortCondition
    shortStop = close + atrMultiplierSL * atr
    shortTP   = close - atrMultiplierTP * atr
    strategy.entry("Short", strategy.short)
    strategy.exit("Exit Short", from_entry="Short", stop=shortStop, limit=shortTP, trail_points=atr * trailingStopMultiplier)

// OPTIONAL: Plot RSI for reference
hline(rsiOverbought, "Overbought", color=color.red)
hline(rsiOversold, "Oversold", color=color.green)
plot(rsiValue, color=color.purple, title="RSI")
Published by ianzeng123 on the FMZ strategy square · last modified 2025-02-27. Collected in the Quant Trading Vault. Unvalidated research: re-test with your own data and costs before trusting it.
Build this with AgenKit
A spec is not a trading system. Paste this into your coding agent and AgenKit runs a specialist team — architecture, test-first build, risk gates, review — with paper trading on by default.
/agenkit build a production-grade trading bot with a backtest engine, risk controls and paper trading by default from strategies/Multi-Indicator-Trend-Following-Strategy-with-ATR-Dynamic-Stop-Loss-Take-Profit.md- npx agenkit install engineering-kit in your project
- Paste the command into your agent and approve each phase
- Get tests, backtest, risk controls and a paper-trading switch
Understand it first
Before you run this, read the lesson behind the idea and how to backtest it honestly. Specs like this one are the survivors of an unknown number of trials; deflate their results accordingly.
Related specs
- Fixed Range Volume Profile And Anchored VWAP Trend Identification Strategy With Dynamic Stop LossPine Script · Trend following · 1h
- Multi Factor Trend Price Action Strategy with Dynamic Risk Management SystemPine Script · Trend following · 2h
- Trend Tracking and Short term Trading Strategy Based on ADX IndicatorPine Script · Trend following · 1d
- Multi Period Trend Confirmation Dynamic Risk Control Quantitative Trading StrategyPine Script · Trend following · 1h
- Advanced Multi Indicator Trend Confirmation Trading StrategyPine Script · Trend following · 1d
- Multi Factor Trend Tracking Dynamic Risk Management Stock Trading StrategyPine Script · Trend following · 1d