Multi Indicator Trend Recognition and Momentum Validation Trading Strategy
This strategy is a sophisticated trading system that combines multiple technical indicators, primarily utilizing the Ichimoku Cloud, Average Directional Index (ADX), and Volume Weighted Average Price (VWAP) to…
Overview
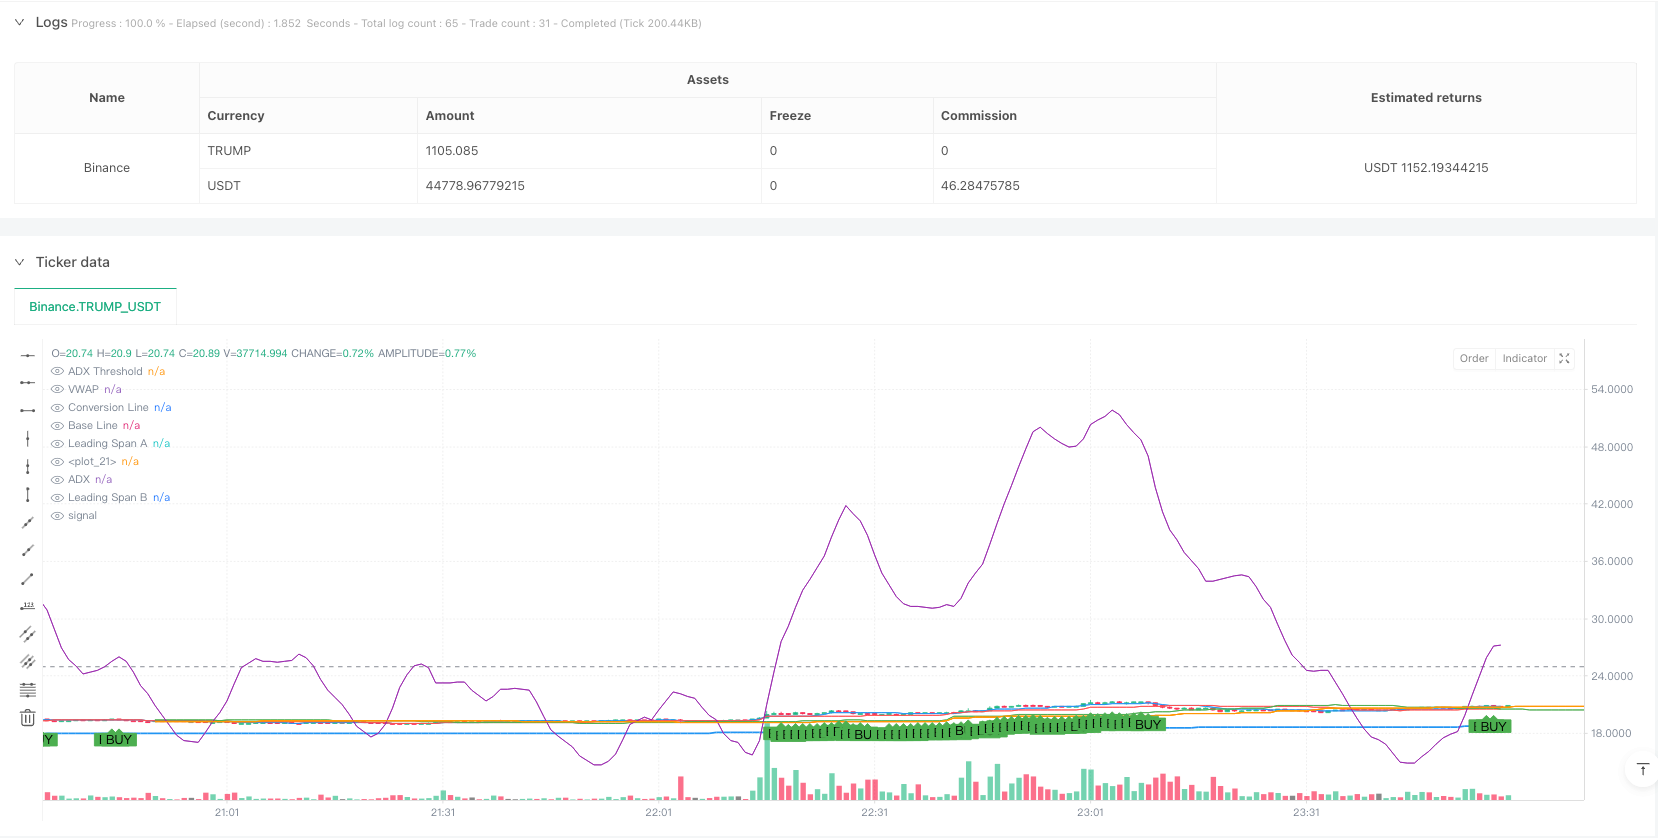
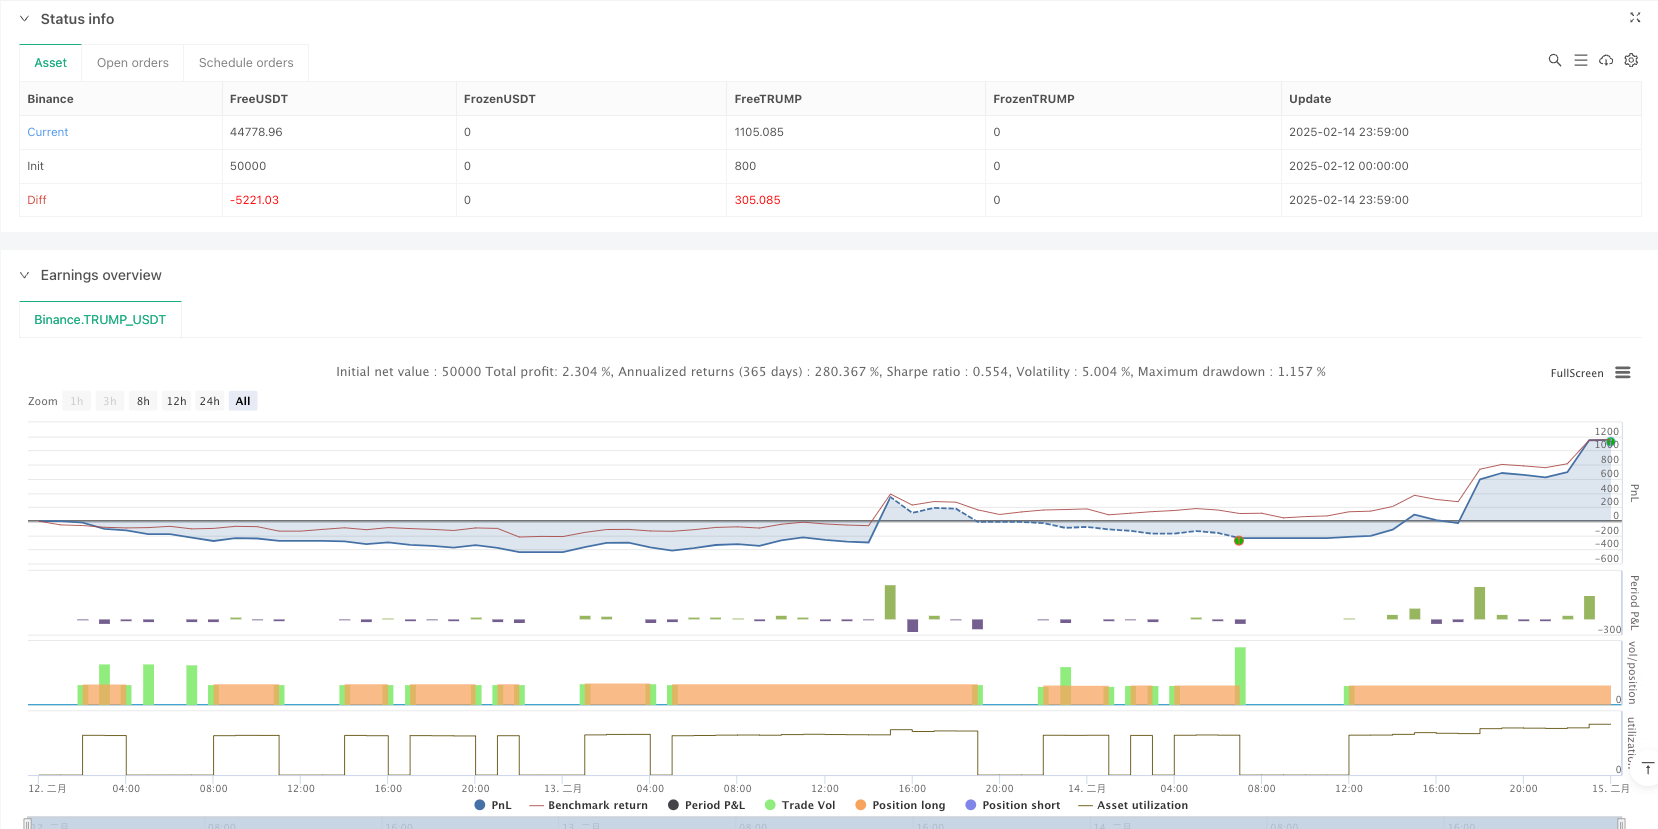
This strategy is a sophisticated trading system that combines multiple technical indicators, primarily utilizing the Ichimoku Cloud, Average Directional Index (ADX), and Volume Weighted Average Price (VWAP) to identify market trends, validate momentum strength, and confirm price positioning. The strategy employs multi-dimensional analysis to enhance trading accuracy and reliability, particularly suitable for medium to long-term trend trading.
Strategy Principles
The strategy employs a three-layer verification mechanism:
- Uses the Ichimoku Cloud system (including Conversion Line, Base Line, Leading Span A, and B) to determine market trend direction through price-cloud relationships.
- Employs the ADX indicator (14-period setting) to evaluate trend strength, with readings above 25 indicating strong trend development.
- Utilizes VWAP as dynamic support/resistance levels to confirm price positioning validity.
Trade Signal Generation: Buy Signal: Price above both Leading Spans A and B + ADX>25 + Price above VWAP Sell Signal: Price below both Leading Spans A and B + ADX>25 + Price below VWAP
Strategy Advantages
- Multi-dimensional verification significantly improves trading reliability, avoiding false signals from single indicators.
- Combines trend following and momentum analysis, capturing major trends while timing entries effectively.
- VWAP verification adds price rationality judgment, improving success rates.
- Strategy design includes robust protection mechanisms against market noise.
Strategy Risks
May generate frequent signals in ranging markets, increasing transaction costs. Solution: Implement minimum holding period restrictions or add oscillator filters.
Potential significant drawdowns during rapid market reversals. Solution: Set appropriate stop-loss levels, consider using ATR for dynamic stop adjustment.
Multiple conditions may cause missed trading opportunities. Solution: Dynamically adjust parameters for different market conditions or use parameter combinations.
Strategy Optimization Directions
- Parameter Optimization: Backtest historical data to optimize indicator parameters for different market environments.
- Market Environment Recognition: Add volatility indicators (like ATR) to employ different parameter sets in varying volatility conditions.
- Risk Control Enhancement: Implement dynamic stop-loss mechanisms that adjust based on market volatility.
- Position Management Improvement: Include scaled entry and exit mechanisms to improve capital efficiency.
Summary
This strategy creates a comprehensive trading system by combining multiple proven technical indicators. The system incorporates core functionalities including trend identification, momentum confirmation, and price verification, while providing clear trading rules and risk control mechanisms. While there is room for optimization, it represents a logically sound and practical trading strategy.
Source Pine Script
/*backtest
start: 2025-02-12 00:00:00
end: 2025-02-15 00:00:00
period: 1m
basePeriod: 1m
exchanges: [{"eid":"Binance","currency":"TRUMP_USDT"}]
*/

//@version=5
strategy("Ichimoku + ADX + VWAP Strategy", overlay=true, default_qty_type=strategy.percent_of_equity, default_qty_value=10)

// --- Ichimoku Cloud Parameters ---
conversionPeriods = 9
basePeriods = 26
laggingSpan2Periods = 52
displacement = 26

// --- Ichimoku Cloud Calculation ---
conversionLine = (ta.highest(high, conversionPeriods) + ta.lowest(low, conversionPeriods)) / 2
baseLine = (ta.highest(high, basePeriods) + ta.lowest(low, basePeriods)) / 2
leadingSpanA = (conversionLine + baseLine) / 2
leadingSpanB = (ta.highest(high, laggingSpan2Periods) + ta.lowest(low, laggingSpan2Periods)) / 2

// Plot Ichimoku Cloud
plot(conversionLine, color=color.blue, title="Conversion Line")
plot(baseLine, color=color.red, title="Base Line")
plot(leadingSpanA, color=color.green, title="Leading Span A", offset=displacement)
plot(leadingSpanB, color=color.orange, title="Leading Span B", offset=displacement)
fill(plot(leadingSpanA, offset=displacement), plot(leadingSpanB, offset=displacement),
     color=leadingSpanA > leadingSpanB ? color.new(color.green, 90) : color.new(color.red, 90),
     title="Ichimoku Cloud")

// --- ADX Calculation ---
adx_length = 14
upMove = high - high[1]
downMove = low[1] - low
plusDM = upMove > downMove and upMove > 0 ? upMove : 0
minusDM = downMove > upMove and downMove > 0 ? downMove : 0
tr = ta.tr(true)
smoothedPlusDM = ta.rma(plusDM, adx_length)
smoothedMinusDM = ta.rma(minusDM, adx_length)
smoothedTR = ta.rma(tr, adx_length)
plusDI = (smoothedPlusDM / smoothedTR) * 100
minusDI = (smoothedMinusDM / smoothedTR) * 100
dx = math.abs(plusDI - minusDI) / (plusDI + minusDI) * 100
adx = ta.rma(dx, adx_length)

// Plot ADX
adx_threshold = 25
hline(adx_threshold, "ADX Threshold", color=color.gray)
plot(adx, color=color.purple, title="ADX")

// --- VWAP Calculation ---
vwap_val = ta.vwap(close)
plot(vwap_val, color=color.blue, title="VWAP", linewidth=2)

// --- Buy and Sell Conditions ---
// Buy Condition:
// - Cena je nad oboma Leading Span A a B
// - ADX je nad prahovou hodnotou
// - Cena je nad VWAP
buyCondition = close > leadingSpanA and close > leadingSpanB and adx > adx_threshold and close > vwap_val

// Sell Condition:
// - Cena je pod oboma Leading Span A a B
// - ADX je nad prahovou hodnotou
// - Cena je pod VWAP
sellCondition = close < leadingSpanA and close < leadingSpanB and adx > adx_threshold and close < vwap_val

// Plot Buy/Sell Signals
plotshape(series=buyCondition, title="Buy Signal", location=location.belowbar, color=color.green, style=shape.labelup, text="BUY")
plotshape(series=sellCondition, title="Sell Signal", location=location.abovebar, color=color.red, style=shape.labeldown, text="SELL")

// --- Execute Trades ---
if (buyCondition)
    strategy.entry("Long", strategy.long)

if (sellCondition)
    strategy.close("Long")
Published by ianzeng123 on the FMZ strategy square · last modified 2025-02-20. Collected in the Quant Trading Vault. Unvalidated research: re-test with your own data and costs before trusting it.
Build this with AgenKit
A spec is not a trading system. Paste this into your coding agent and AgenKit runs a specialist team — architecture, test-first build, risk gates, review — with paper trading on by default.
/agenkit build a production-grade trading bot with a backtest engine, risk controls and paper trading by default from strategies/Multi-Indicator-Trend-Recognition-and-Momentum-Validation-Trading-Strategy.md- npx agenkit install engineering-kit in your project
- Paste the command into your agent and approve each phase
- Get tests, backtest, risk controls and a paper-trading switch
Understand it first
Before you run this, read the lesson behind the idea and how to backtest it honestly. Specs like this one are the survivors of an unknown number of trials; deflate their results accordingly.
Related specs
- Momentum Trend Ichimoku Cloud Trading StrategyPine Script · Momentum · 1d
- Multi Indicator Trend Momentum Trading Strategy Based on SuperTrendPine Script · Momentum · 2d
- Multi Indicator Comprehensive Analysis Quantitative Trading Strategy Trend Momentum and Volatility Collaborative Prediction ModelPine Script · Momentum · 3m
- Advanced Multi Indicator Trend Following and Momentum Quantitative Trading StrategyPine Script · Momentum · 1h
- Trend Following Strategy Based on Support Resistance and Momentum Indicators Across Multiple TimeframesPine Script · Momentum · 1d
- Triple Moving Average Momentum Trend Trading StrategyPine Script · Momentum · 2d