Strategy vault / Trend following
Multi Indicator Trend Tracking Strategy
The strategy is named Multi-Indicator Trend Tracking Strategy . It utilizes multiple indicators including Fisher Transform, Weighted Moving Average (WMA), Relative Strength Index (RSI) and On-Balance Volume (OBV) to…
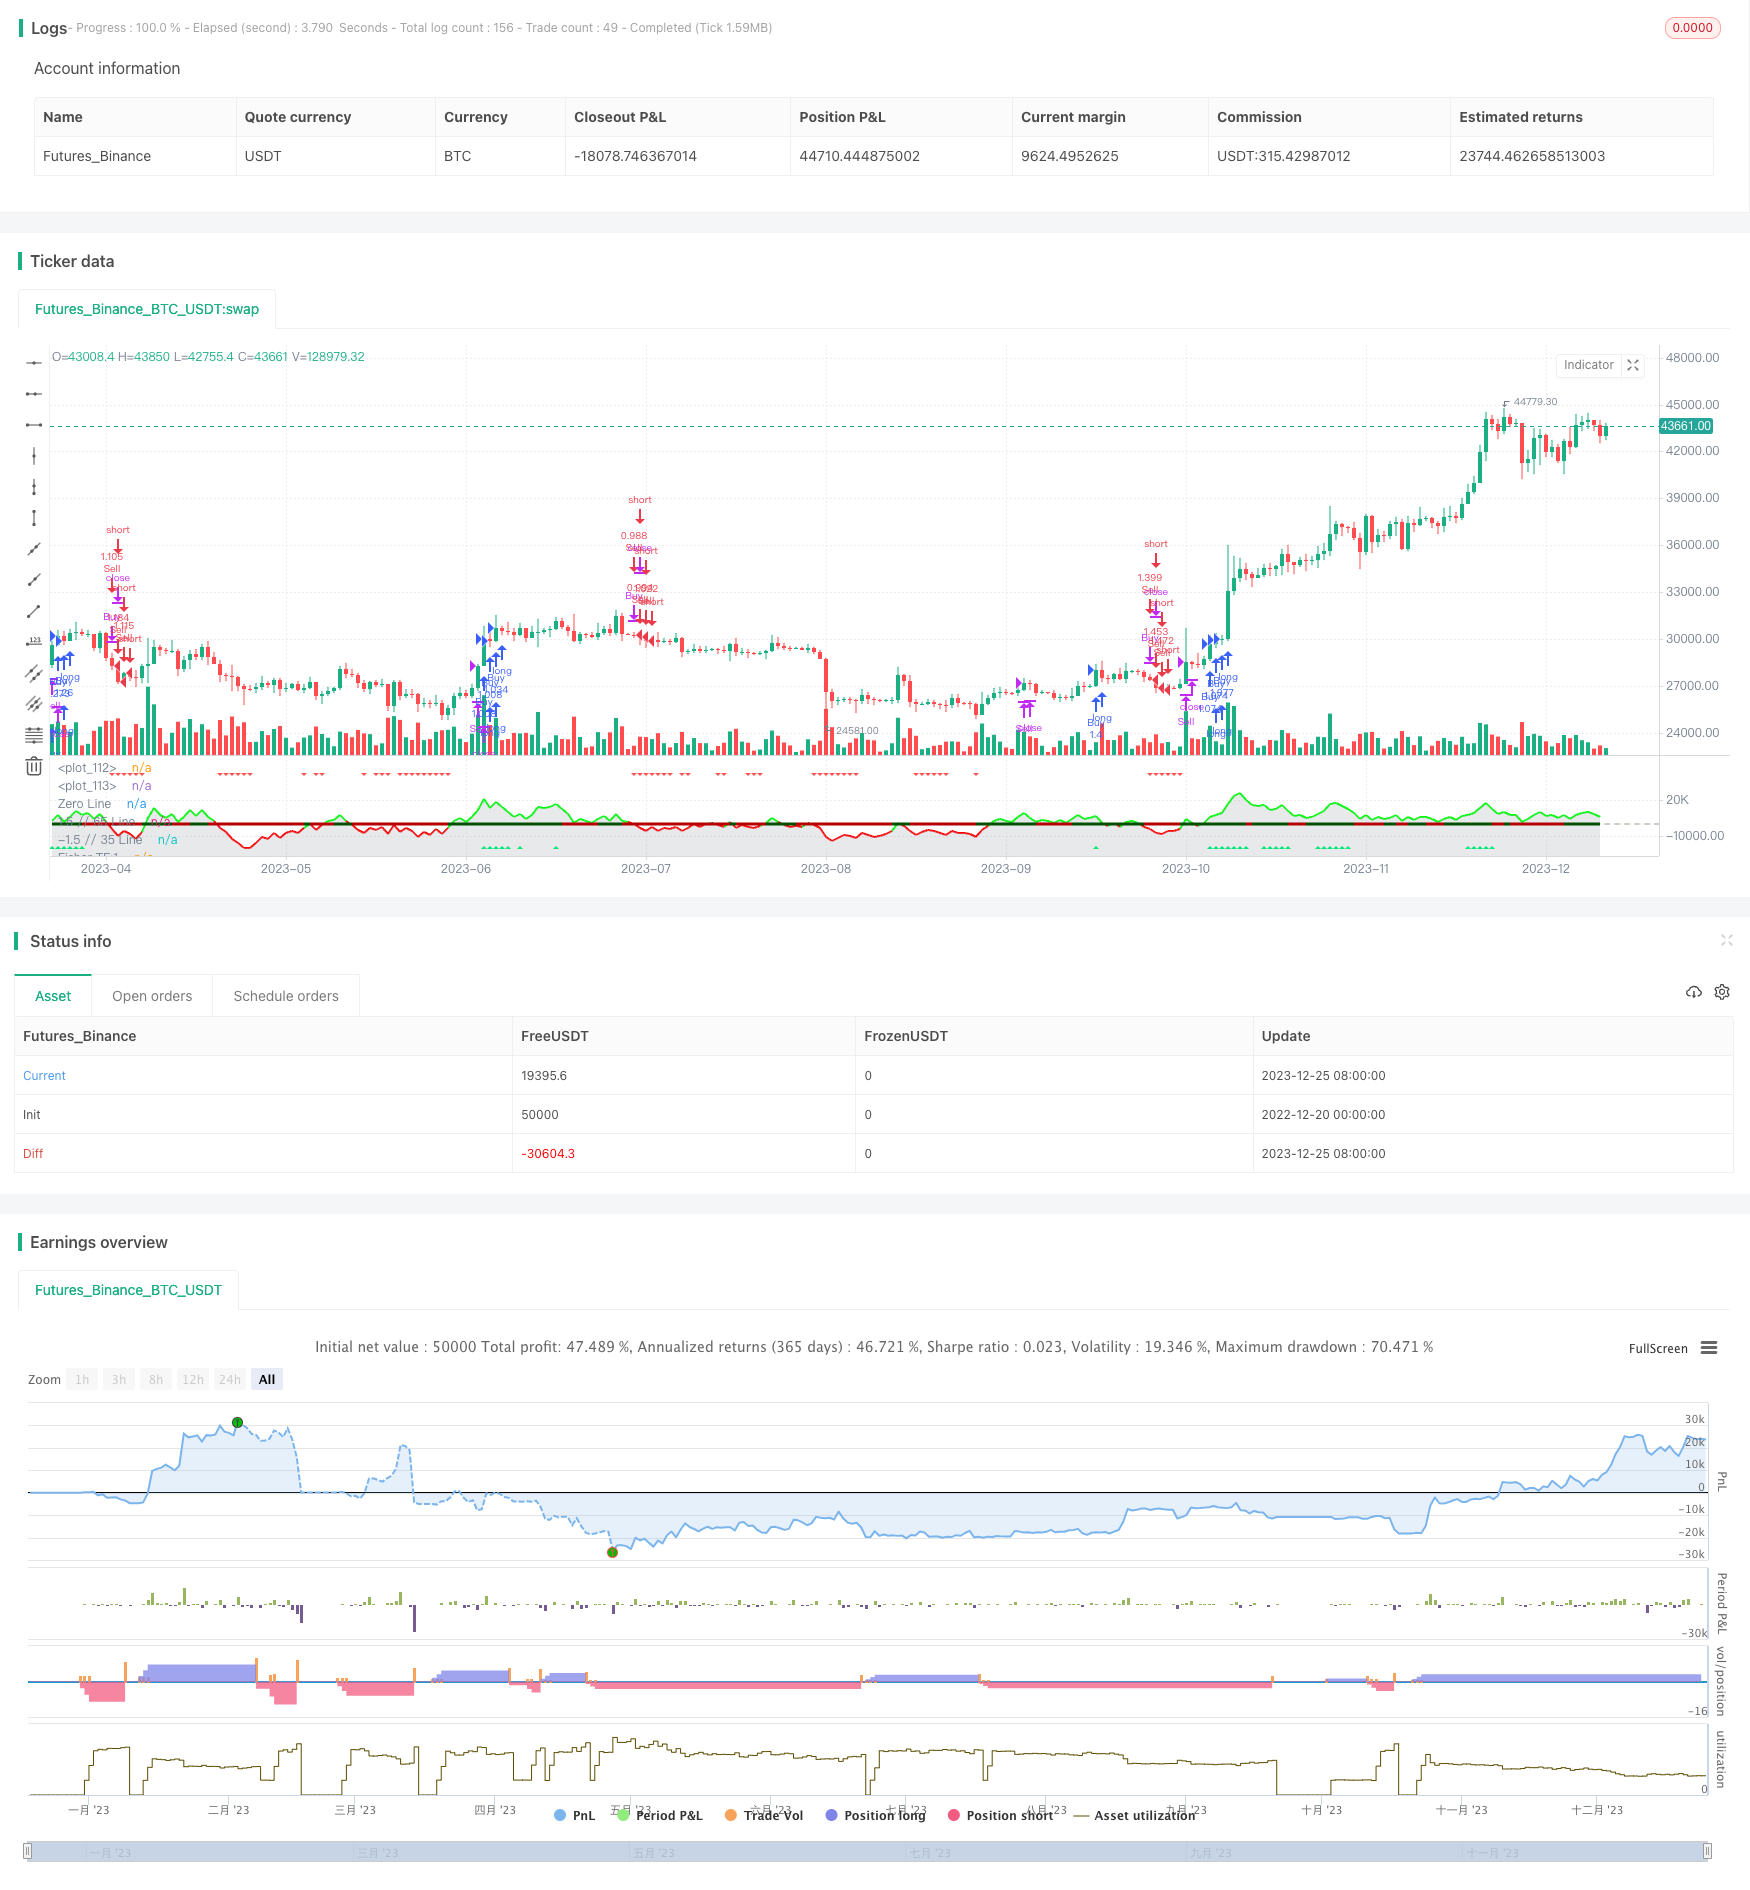
Overview
The strategy is named Multi-Indicator Trend Tracking Strategy. It utilizes multiple indicators including Fisher Transform, Weighted Moving Average (WMA), Relative Strength Index (RSI) and On-Balance Volume (OBV) to determine the trend direction of the market and track the trend for trading.
Strategy Logic
- Fisher Transform to detect price change trend and momentum. Trading signals are generated when four Fisher lines change color synchronously .
- WMA to determine the major trend direction. RSI filters out fake signals.
- OBV to confirm the trend.
Specifically, Fisher Transform contains four lines - 1x, 2x, 4x and 8x. When four lines turn green simultaneously, a long signal is generated. When four lines turn red simultaneously, a short signal is generated. WMA determines if the major trend is bullish or bearish. OBV confirms the trend direction. RSI filters out false signals.
Advantage Analysis
The advantages of this strategy:
- Fisher Transform is momentum-sensitive, when four Fisher lines change color synchronously, it ensures a high probability of trend reversal.
- WMA determines the major trend to avoid trading against the trend.
- OBV confirms the real trend, avoids false breakout in trendless market.
- RSI filters out false signals to ensure reliability of trading signals.
Through the combination of multiple indicators, it ensures accuracy and reliability of trading signals and capable of catching trends, leading to good strategy performance.
Risk Analysis
Risks of this strategy:
- Fisher lines may generate false signals if market is in consolidation. RSI helps filter out false signals in this case.
- Improper WMA parameter setting may impact trend accuracy.
- Fisher Transform does not perform well in ultra short-term trends.
- Waterfall decline can lead to huge losses.
To mitigate the risks, RSI parameter can be adjusted accordingly. WMA period can be optimized. Stop loss can also be set to avoid huge losses.
Optimization Directions
This strategy can be further optimized from the following aspects:
- Test the effectiveness across different timeframes to find the optimal parameter combination.
- Add stop loss mechanism. Set stop loss when loss reaches a certain level.
- Further adjust Fisher Transform parameters based on backtest results to find the optimal parameter combination with best accuracy.
- Attempt to add other filtering indicators such as strength index, bias index etc.
- Test different strategies for setting position sizing.
Conclusion
This strategy integrates Fisher Transform, WMA, OBV and RSI to determine the trend direction. It generates precise trading signals with strong confirmation capability, allowing to effectively lock in profits along the trend. With further parameter optimization, profit factor can be improved. In conclusion, through the combination of multiple indicators, this strategy effectively tracks the trend with good performance.
Parameters
| Name | Default | What it controls |
|---|---|---|
| v_input_int_1 | 10 | (?Fisher Transform)Len |
| v_input_int_2 | true | mult1 |
| v_input_int_3 | 2 | mult2 |
| v_input_int_4 | 4 | mult3 |
| v_input_int_5 | 8 | mult4 |
| v_input_int_6 | 14 | (?Moving Averages)rsiLength |
| v_input_int_7 | 10 | WMA Length |
| v_input_int_8 | 20 | (?On-Balance Volume)OBV Length |
| v_input_float_1 | 0.1 | OBV Bullish minimum value |
| v_input_float_2 | -0.1 | OBV Bearish minimum value |
| v_input_float_3 | -0.7 | (?RSI Level Filters)Reversal Down TP Filter |
| v_input_float_4 | 0.7 | Reversal Up TP Filter |
| v_input_float_5 | 1.66 | RSI Level Buy Filter |
| v_input_float_6 | true | RSI Level Sell Filter |
Source Pine Script
/*backtest
start: 2022-12-20 00:00:00
end: 2023-12-26 00:00:00
period: 1d
basePeriod: 1h
exchanges: [{"eid":"Futures_Binance","currency":"BTC_USDT"}]
*/

//@version=5
//author Sdover0123
strategy(title='FTR, WMA, OBV & RSI Strat', shorttitle='FTR WMA, OBV, RSI',overlay=false, default_qty_type=strategy.percent_of_equity, initial_capital = 100, default_qty_value=100, commission_value = 0.06, pyramiding = 3)
Len = input.int(10, minval=1, group ="Fisher Transform")
mult1 = input.int(1, minval=1, group ="Fisher Transform")
mult2 = input.int(2, minval=1, group ="Fisher Transform")
mult3 = input.int(4, minval=1, group ="Fisher Transform")
mult4 = input.int(8, minval=1, group ="Fisher Transform")
fish(Length, timeMultiplier) =>
    var nValue1 = 0.0
    var nValue2 = 0.0
    var nFish = 0.0
    xHL2 = hl2
    xMaxH = ta.highest(xHL2, Length * timeMultiplier)
    xMinL = ta.lowest(xHL2, Length * timeMultiplier)
    nValue1 := 0.33 * 2 * ((xHL2 - xMinL) / (xMaxH - xMinL) - 0.5) + 0.67 * nz(nValue1[1])
    if nValue1 > .99
        nValue2 := .999
        nValue2
    else if nValue1 < -.99
        nValue2 := -.999
        nValue2
    else
        nValue2 := nValue1
        nValue2
    nFish := 0.5 * math.log((1 + nValue2) / (1 - nValue2)) + 0.5 * nz(nFish[1])
    nFish
Fisher1 = fish(Len, mult1)
Fisher2 = fish(Len, mult2)
Fisher4 = fish(Len, mult3)
Fisher8 = fish(Len, mult4)

rsiLength = input.int(14, minval=1, group ="Moving Averages")
rsiVal = (ta.rsi(close, rsiLength) - 50) / 10
avg = strategy.position_avg_price

wma(source, length) =>
    sum = 0.0
    for i = 0 to length - 1
        sum := sum + source[i] * (length - i)
    wma = sum / (length * (length + 1) / 2)
    wma

wmaLength = input.int(10, "WMA Length", minval=1, group ="Moving Averages")
wmaClose = wma(close, wmaLength)
// Determine if WMA is bullish or bearish
isWmaBullish = wmaClose > wmaClose[1]
isWmaBearish = wmaClose < wmaClose[1]

//OBV
src = close
length = input.int(20, title="OBV Length", group="On-Balance Volume")
obv1(src) =>
    change_1 = ta.change(src)
    ta.cum(ta.change(src) > 0 ? volume : change_1 < 0 ? -volume : 0 * volume)*0.01
os = obv1(src)
obv_osc = os - ta.ema(os, length)
obc_color = (obv_osc > 0 ? color.rgb(0, 255, 8) : color.rgb(255, 0, 0))
plot(obv_osc, color=obc_color, style=plot.style_line, title='OBV-Points', linewidth=2)
plot(obv_osc, color=color.new(#b2b5be, 70), title='OBV', style=plot.style_area)
obvBullFilter = input.float(0.1, minval = 0, maxval = 5, step = 0.01, title ="OBV Bullish minimum value", group="On-Balance Volume")
obvBearFilter = input.float(-0.1, minval = -5, maxval = 0, step = 0.01, title ="OBV Bearish minimum value", group="On-Balance Volume")
obvBull = obv_osc > obvBullFilter
obvBear = obv_osc < obvBearFilter

// Add buy/sell signals
ReversalFilterDown = input.float(-0.7, 'Reversal Down TP Filter', -4, 4, step = 0.01, group = "RSI Level Filters", tooltip = "This is defined by taking the RSI value -50 and /10. When all Fisher lines are changing colour, this will SL/TP the long")
ReversalFilterUp = input.float(0.7, 'Reversal Up TP Filter', -4, 4, step = 0.01, group = "RSI Level Filters", tooltip = "This is defined by taking the RSI value -50 and /10. When all Fisher lines are changing colour, this will SL/TP the short")
RSILevelBuyFilter = input.float(1.66, 'RSI Level Buy Filter', -4, 4, step = 0.01, group = "RSI Level Filters", tooltip = "This is defined by taking the RSI value -50 and /10. Consider negative values")
RSILevelSellFilter = input.float(1, 'RSI Level Sell Filter', -4, 4, step = 0.01, group = "RSI Level Filters", tooltip = "This is defined by taking the RSI value -50 and /10. Consider negative values")
//buys - if breaking out and all Fisher are green and RSI filter value is met
buySignal = Fisher1 > Fisher1[1] and Fisher2 > Fisher2[1] and Fisher4 > Fisher4[1] and Fisher8 > Fisher8[1] and rsiVal > RSILevelBuyFilter and isWmaBullish and obvBull
ReversalUp = Fisher1 > Fisher1[1] and Fisher2 > Fisher2[1] and Fisher4 > Fisher4[1] and Fisher8 > Fisher8[1] and rsiVal > ReversalFilterUp
//sells - if breaking down and all Fisher are green and RSI filter value is met
sellSignal = Fisher1 < Fisher1[1] and Fisher2 < Fisher2[1] and Fisher4 < Fisher4[1] and Fisher8 < Fisher8[1] and rsiVal < RSILevelSellFilter and isWmaBearish and obvBear
ReversalDown = Fisher1 < Fisher1[1] and Fisher2 < Fisher2[1] and Fisher4 < Fisher4[1] and Fisher8 < Fisher8[1] and rsiVal < ReversalFilterDown


// Buy and Sell conditions
if buySignal and time>timestamp(2022, 06, 01, 09, 30) and barstate.isconfirmed
    strategy.close("Sell", comment = "Close Short")
    strategy.entry("Buy", strategy.long, comment = "Long")

if sellSignal and time>timestamp(2022, 06, 01, 09, 30) and barstate.isconfirmed
    strategy.close("Buy", comment = "Close Long")
    strategy.entry("Sell", strategy.short, comment = "Short")

if ReversalDown
    strategy.close("Buy", comment = "Close Long")

if ReversalUp
    strategy.close("Sell", comment = "Close Short")

//Plotting
//Fisher
plot(Fisher1, color=Fisher1 > nz(Fisher1[1]) ? color.green : color.rgb(255, 0, 0), title='Fisher TF:1')
plot(Fisher2, color=Fisher2 > nz(Fisher2[1]) ? color.green : color.rgb(255, 0, 0), title='Fisher TF:1', linewidth=2)
plot(Fisher4, color=Fisher4 > nz(Fisher4[1]) ? #008000 : #b60000, title='Fisher TF:1', linewidth=3)
plot(Fisher8, color=Fisher8 > nz(Fisher8[1]) ? #004f00 : #b60000, title='Fisher TF:1', linewidth=3)
//RSI
plot(rsiVal, color=rsiVal < 0 ? color.purple : color.yellow, linewidth=2, title='RSI')

//WMA
plot(isWmaBullish ? -2 : na, color=color.rgb(76, 175, 79, 20), linewidth=3, style=plot.style_linebr, title="WMA Bullish")
plot(isWmaBearish ? -2 : na, color=color.rgb(255, 82, 82, 20), linewidth=3, style=plot.style_linebr, title="WMA Bearish")

//Buy/Sell Signals
plotshape(buySignal, title='Buy Signal', location=location.bottom, color=color.new(color.lime, 0), style=shape.triangleup, size=size.small)
plotshape(sellSignal, title='Sell Signal', location=location.top, color=color.new(color.red, 0), style=shape.triangledown, size=size.small)

//Orientation
hline(RSILevelBuyFilter, color=color.rgb(25, 36, 99, 20), linestyle=hline.style_dotted, linewidth=2)
hline(RSILevelSellFilter, color=color.rgb(111, 27, 27, 20), linestyle=hline.style_dotted, linewidth=2)
hline(0, color=color.rgb(181, 166, 144, 39), linestyle=hline.style_dashed, linewidth=2, title = "Zero Line")
hline(1.5, color=color.rgb(217, 219, 220, 50), linestyle=hline.style_dotted, linewidth=2, title = "1.5 // 65 Line")
hline(-1.5, color=color.rgb(217, 219, 220, 50), linestyle=hline.style_dotted, linewidth=2, title = "-1.5 // 35 Line")Published by ChaoZhang on the FMZ strategy square · last modified 2023-12-27. Collected in the Quant Trading Vault. Unvalidated research: re-test with your own data and costs before trusting it.
Build this with AgenKit
A spec is not a trading system. Paste this into your coding agent and AgenKit runs a specialist team — architecture, test-first build, risk gates, review — with paper trading on by default.
/agenkit build a production-grade trading bot with a backtest engine, risk controls and paper trading by default from strategies/Multi-Indicator-Trend-Tracking-Strategy.md- npx agenkit install engineering-kit in your project
- Paste the command into your agent and approve each phase
- Get tests, backtest, risk controls and a paper-trading switch
Understand it first
Before you run this, read the lesson behind the idea and how to backtest it honestly. Specs like this one are the survivors of an unknown number of trials; deflate their results accordingly.
Related specs
- Five Minute Triple Confirmation Trend Trading Strategy with Risk Management SystemPine Script · Trend following · 1m
- Multi Moving Average Trend Following with On Balance Volume StrategyPine Script · Trend following · 5d
- Kifiers Hidden MFI STOCH Divergence Trend Breaker Trading StrategyPine Script · Trend following · 1h
- Multi Indicator Integrated Trend Following Trading StrategyPine Script · Trend following · 2m
- Dual Moving Average Crossover Trend Strategy 432917Pine Script · Trend following · 1h
- Quantitative Trend Tracking StrategyPine Script · Trend following · 5h