Multi Indicator Trend Trading System with Momentum Analysis Strategy
This strategy is a sophisticated multi-indicator trading system that combines multiple technical indicators including RSI, MACD, and Moving Averages (SMA) to identify trading opportunities through price trend and…
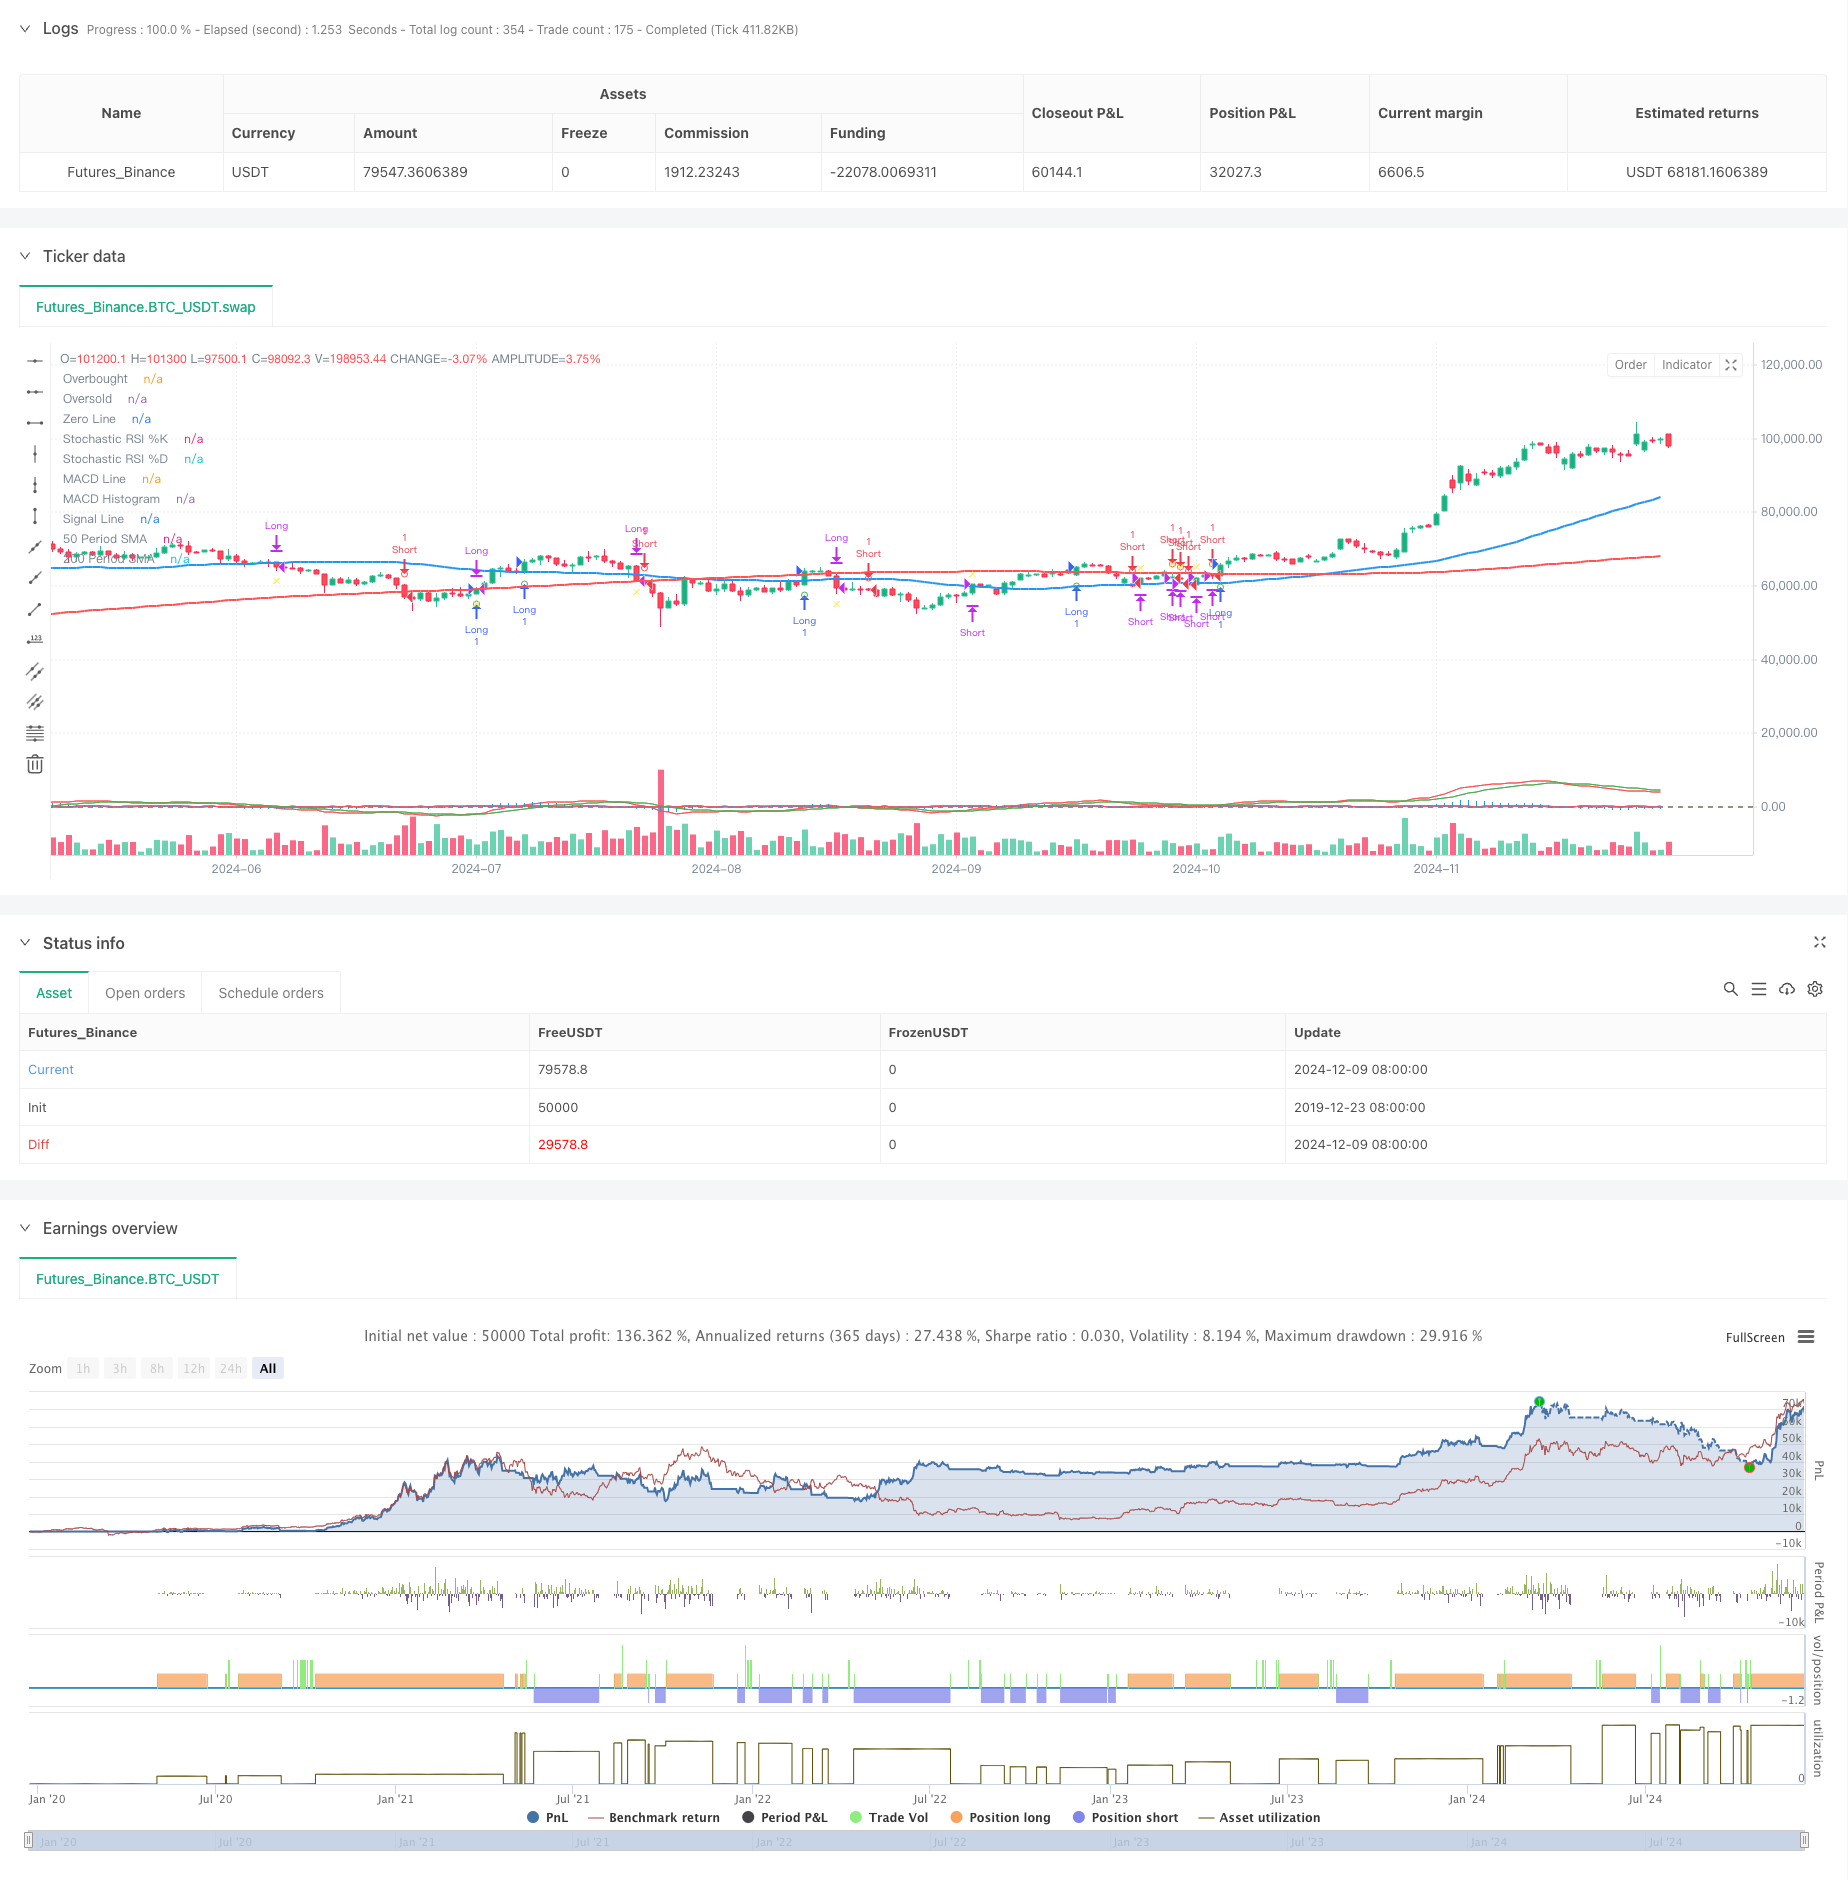
Overview
This strategy is a sophisticated multi-indicator trading system that combines multiple technical indicators including RSI, MACD, and Moving Averages (SMA) to identify trading opportunities through price trend and momentum analysis. The strategy uses the 200-day moving average to determine long-term trends, the 50-day moving average as a medium-term reference, and utilizes Stochastic RSI and MACD crossover signals to confirm trading opportunities.
Strategy Principles
The core logic is built on three main pillars:
- Trend Determination: Uses 200-day moving average to judge the main trend direction, with prices above the line indicating an uptrend and below indicating a downtrend.
- Momentum Confirmation: Uses Stochastic RSI (SRSI) %K and %D line crossovers to confirm price momentum, with %K crossing above %D indicating strengthening upward momentum.
- Trend Confirmation: Uses MACD indicator as a trend confirmation tool, with MACD line above signal line confirming uptrend.
Buy conditions must simultaneously satisfy:
- Price above 200-day moving average
- Stochastic RSI %K line crosses above %D line
- MACD line is above signal line
Sell conditions must simultaneously satisfy:
- Price below 200-day moving average
- Stochastic RSI %K line crosses below %D line
- MACD line is below signal line
Strategy Advantages
- Multiple Verification: Reduces false signal risk through the combined use of multiple technical indicators.
- Trend Following: Effectively captures major trends by combining long-term and medium-term moving averages.
- Momentum Identification: Uses Stochastic RSI to identify potential trend turning points earlier.
- Risk Control: Uses 50-day moving average as a stop-loss reference, providing clear exit mechanisms.
- Systematic Operation: Clear strategy logic, suitable for programmatic implementation and backtesting.
Strategy Risks
- Lag Risk: Moving averages are inherently lagging indicators, potentially causing delayed entry and exit timing.
- Oscillation Risk: Multiple indicators may produce confusing signals in sideways markets.
- False Breakout Risk: Price may quickly retreat after short-term breakouts above moving averages.
- Parameter Sensitivity: Multiple indicator parameters need optimization for different market environments.
- Signal Conflict: Different indicators may produce contradictory signals, increasing decision-making difficulty.
Strategy Optimization Directions
Indicator Parameter Optimization:
- Find optimal moving average periods through historical data backtesting
- Optimize Stochastic RSI parameters to adapt to different market volatilities
Signal Filtering:
- Add volume confirmation mechanism
- Introduce volatility indicators to adjust trading strategy during high volatility periods
Risk Management Improvements:
- Implement dynamic stop-loss mechanisms
- Adjust position sizes dynamically based on market volatility
Market Adaptability:
- Add market environment identification mechanisms
- Use different parameter settings under different market conditions
Summary
This is a systematic trend-following strategy that ensures trading reliability while providing clear risk control mechanisms through the combined use of multiple technical indicators. The strategy's main advantage lies in its multi-layer verification mechanism, but attention must be paid to controlling the lag risks that multiple indicators may bring. Through continuous optimization and improvement, this strategy has the potential to maintain stable performance across different market environments.
Source Pine Script
/*backtest
start: 2019-12-23 08:00:00
end: 2024-12-10 08:00:00
period: 1d
basePeriod: 1d
exchanges: [{"eid":"Futures_Binance","currency":"BTC_USDT"}]
*/

//@version=5
strategy("RSI and MACD by Karthik", overlay=true)

// Define periods for SMAs
sma50Period = 50
sma200Period = 200

// Calculate SMAs
sma50 = ta.sma(close, sma50Period)
sma200 = ta.sma(close, sma200Period)

// Plot SMAs on the main chart
plot(sma50, color=color.blue, title="50 Period SMA", linewidth=2)
plot(sma200, color=color.red, title="200 Period SMA", linewidth=2)

// Define and calculate parameters for Stochastic RSI
stochRSIPeriod = 14
rsi = ta.rsi(close, stochRSIPeriod)
stochRSIK = ta.stoch(rsi, rsi, stochRSIPeriod, 3)
stochRSID = ta.sma(stochRSIK, 3)

// Define and calculate parameters for MACD
macdShort = 12
macdLong = 26
macdSignal = 9
[macdLine, signalLine, macdHist] = ta.macd(close, macdShort, macdLong, macdSignal)

// Plot Stochastic RSI in a separate pane
hline(80, "Overbought", color=color.red, linewidth=1)
hline(20, "Oversold", color=color.green, linewidth=1)
plot(stochRSIK, color=color.blue, title="Stochastic RSI %K")
plot(stochRSID, color=color.red, title="Stochastic RSI %D")

// Plot MACD in a separate pane
hline(0, "Zero Line", color=color.gray, linewidth=1)
plot(macdHist, color=color.blue, title="MACD Histogram", style=plot.style_histogram)
plot(macdLine, color=color.red, title="MACD Line")
plot(signalLine, color=color.green, title="Signal Line")

// Conditions for buy and sell signals
isAbove200SMA = close > sma200
isStochRSIKAbove = stochRSIK > stochRSID
macdLineAbove = macdLine > signalLine
buySignal = isAbove200SMA and isStochRSIKAbove and macdLineAbove

isBelow200SMA = close < sma200
isStochRSIKBelow = stochRSIK < stochRSID
macdLineBelow = macdLine < signalLine
sellSignal = isBelow200SMA and isStochRSIKBelow and macdLineBelow

// Track the last signal with explicit type declaration
var string lastSignal = na

// Create series for plotting conditions
var bool plotBuySignal = na
var bool plotSellSignal = na
var bool plotExitBuySignal = na
var bool plotExitSellSignal = na

// Update plotting conditions based on signal and last signal
if buySignal and (lastSignal != "buy")
    plotBuySignal := true
    lastSignal := "buy"
else
    plotBuySignal := na

if sellSignal and (lastSignal != "sell")
    plotSellSignal := true
    lastSignal := "sell"
else
    plotSellSignal := na

// Update exit conditions based on SMA50
if lastSignal == "buy" and close < sma50
    plotExitBuySignal := true
    lastSignal := na // Clear lastSignal after exit
else
    plotExitBuySignal := na

if lastSignal == "sell" and close > sma50
    plotExitSellSignal := true
    lastSignal := na // Clear lastSignal after exit
else
    plotExitSellSignal := na

// Plot buy and sell signals on the main chart
plotshape(series=plotBuySignal, location=location.belowbar, color=color.green, style=shape.circle, size=size.small, title="Buy Signal")
plotshape(series=plotSellSignal, location=location.abovebar, color=color.red, style=shape.circle, size=size.small, title="Sell Signal")

// Plot exit signals for buy and sell
plotshape(series=plotExitBuySignal, location=location.belowbar, color=color.yellow, style=shape.xcross, size=size.small, title="Exit Buy Signal")
plotshape(series=plotExitSellSignal, location=location.abovebar, color=color.yellow, style=shape.xcross, size=size.small, title="Exit Sell Signal")


// Strategy to Backtest

long = buySignal
short = sellSignal

// Exit Conditions
exitBuy = close < sma50
exitSell = close > sma50


if (buySignal)
    strategy.entry("Long", strategy.long, 1.0)
if (sellSignal)
    strategy.entry("Short", strategy.short, 1.0)

strategy.close("Long", when=exitBuy)
strategy.close("Short", when=exitSell)
Published by ChaoZhang on the FMZ strategy square · last modified 2024-12-12. Collected in the Quant Trading Vault. Unvalidated research: re-test with your own data and costs before trusting it.
Build this with AgenKit
A spec is not a trading system. Paste this into your coding agent and AgenKit runs a specialist team — architecture, test-first build, risk gates, review — with paper trading on by default.
/agenkit build a production-grade trading bot with a backtest engine, risk controls and paper trading by default from strategies/Multi-Indicator-Trend-Trading-System-with-Momentum-Analysis-Strategy.md- npx agenkit install engineering-kit in your project
- Paste the command into your agent and approve each phase
- Get tests, backtest, risk controls and a paper-trading switch
Understand it first
Before you run this, read the lesson behind the idea and how to backtest it honestly. Specs like this one are the survivors of an unknown number of trials; deflate their results accordingly.
Related specs
- MoonFlag MACD Momentum StochRSI Trading StrategyPine Script · Momentum · 1d
- Multi Indicator Probability Threshold Momentum Trend Trading StrategyPine Script · Momentum · 1d
- Multi factor Adaptive Momentum Tracking StrategyPine Script · Momentum · 3m
- Dual Momentum Oscillator Smart Timing Trading StrategyPine Script · Momentum · 1h
- Multi Indicator Crossover Volume Confirmed Trend Momentum Trading StrategyPine Script · Momentum · 1d
- Multi Indicator Comprehensive Analysis Quantitative Trading Strategy Trend Momentum and Volatility Collaborative Prediction ModelPine Script · Momentum · 3m