Multi Indicator Volatility Trading RSI EMA ATR Strategy
This strategy is a short-term trading system that combines multiple technical indicators, primarily based on RSI (Relative Strength Index), EMA (Exponential Moving Average), and ATR (Average True Range) for…
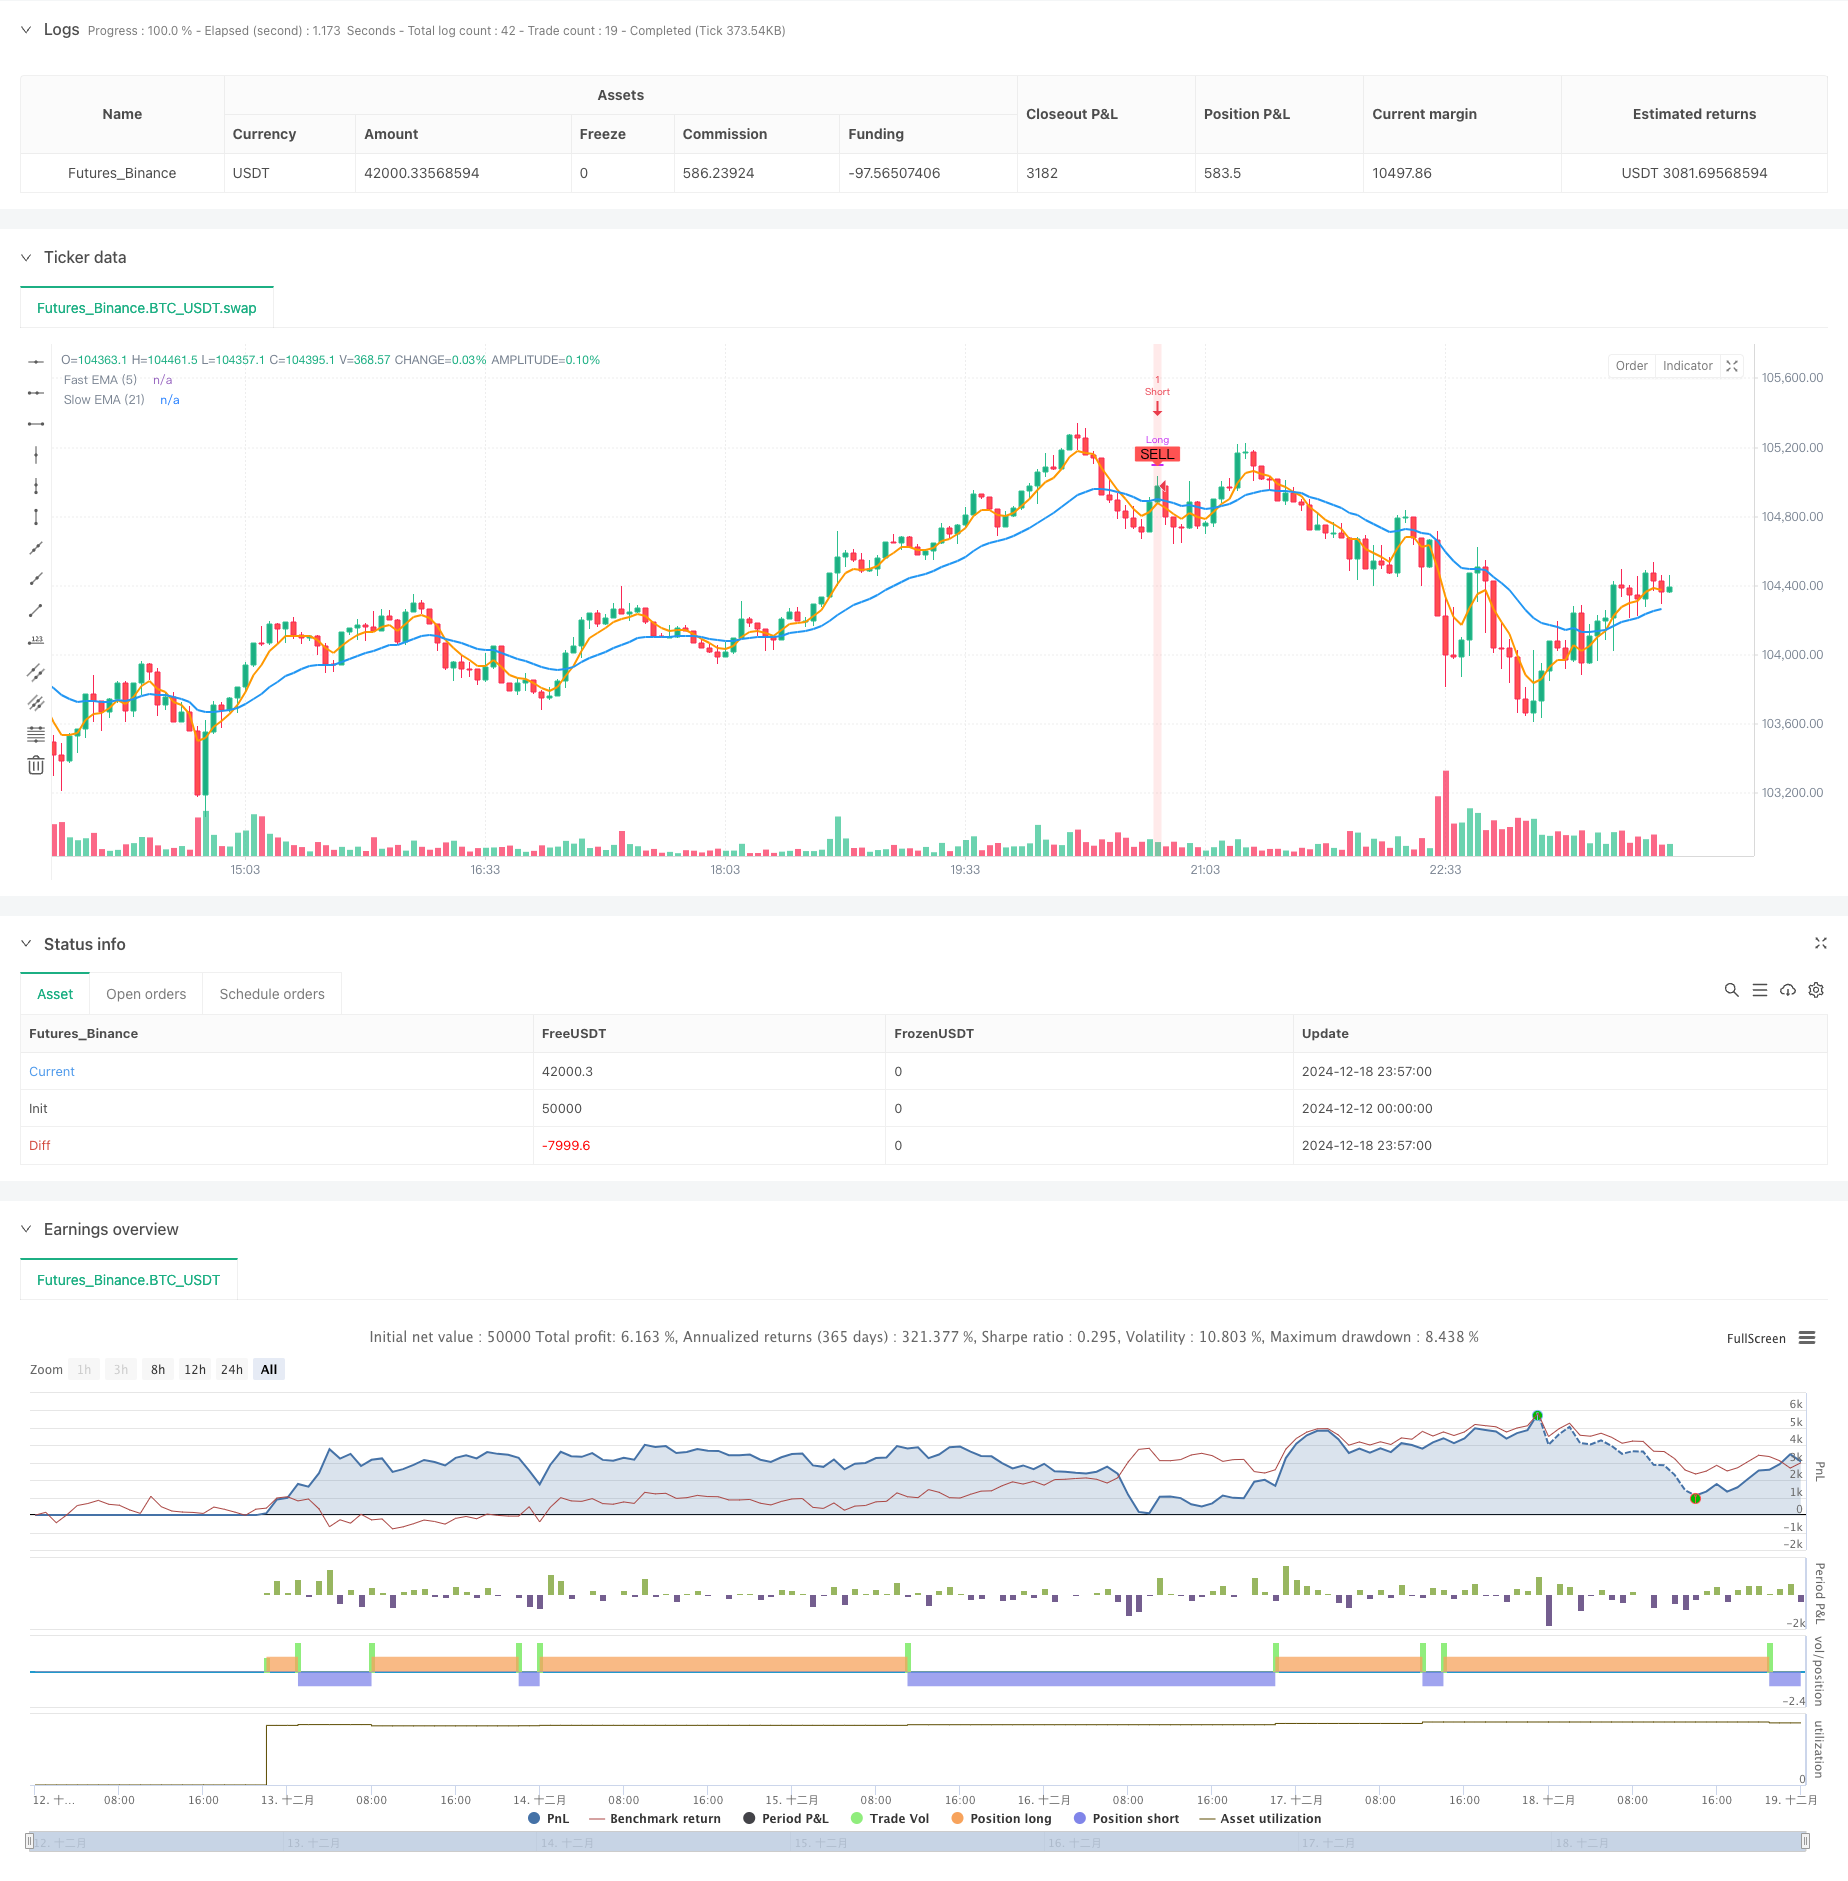
Overview
This strategy is a short-term trading system that combines multiple technical indicators, primarily based on RSI (Relative Strength Index), EMA (Exponential Moving Average), and ATR (Average True Range) for generating trading signals. By utilizing multiple indicators together, the strategy considers both price trends and market volatility, with an optional volume filter, creating a relatively complete trading decision system.
Strategy Principle
The strategy employs a triple-filtering mechanism to ensure signal reliability:
- Trend Determination: Using the crossover relationship between Fast EMA (5-period) and Slow EMA (21-period) to judge current market trend
- Overbought/Oversold: Using RSI indicator (14-period) for reversal trading within the 45-55 range
- Volatility Confirmation: Using ATR indicator to determine if current market volatility is suitable for trading, requiring ATR value to be greater than 0.8 times its moving average
- Optional volume filter requiring volume to be above its 20-period moving average
Specific trigger conditions for long and short signals are:
- Long Condition: Fast EMA above Slow EMA + RSI below 45 + Volatility condition met
- Short Condition: Fast EMA below Slow EMA + RSI above 55 + Volatility condition met
Strategy Advantages
- Multiple confirmation mechanisms improve trading reliability and effectively reduce false signals
- Combines trend-following and reversal trading characteristics, capable of capturing major trends while profiting from range-bound markets
- Controls volatility through ATR indicator, avoiding frequent trading during low volatility periods
- Strategy has good adaptability and can be adjusted through parameters to suit different market environments
- Optional volume filtering mechanism further improves trading accuracy
Strategy Risks
- May experience slippage in volatile markets, affecting actual execution
- Parameter optimization faces overfitting risk, requiring thorough testing across different time periods
- Fast and Slow EMAs may produce excessive crossovers in sideways markets, leading to false signals
- Fixed RSI thresholds may need adjustment in different market environments
- Trading costs (0.1% commission) may significantly impact strategy returns
Strategy Optimization Directions
- Consider adding multiple timeframe confirmation, such as adding trend filters on larger timeframes
- Recommend adding stop-loss and take-profit mechanisms, potentially based on ATR multiples
- Consider implementing a position management system with dynamic position sizing based on volatility
- Consider introducing market sentiment indicators to adjust trading parameters in extreme market conditions
- Recommend adding trading time filters to avoid trading during low liquidity periods
Summary
This is a well-designed multi-indicator trading system that improves trading reliability through multiple confirmation mechanisms. The strategy's core advantage lies in combining trend and volatility analysis while considering multiple market dimensions. While there is room for optimization, it is overall a trading strategy worth further refinement and implementation.
Source Pine Script
/*backtest
start: 2024-12-12 00:00:00
end: 2024-12-19 00:00:00
period: 3m
basePeriod: 3m
exchanges: [{"eid":"Futures_Binance","currency":"BTC_USDT"}]
*/

//@version=5
strategy("Scalp Master BTCUSDT Strategy", overlay=true, max_labels_count=500, initial_capital=10000, commission_type=strategy.commission.percent, commission_value=0.1)

//=== Kullanıcı Parametreleri ===
rsi_length         = input.int(14, "RSI Length")
rsi_lower_band     = input.float(45, "RSI Lower Band")
rsi_upper_band     = input.float(55, "RSI Upper Band")

ema_fast_length    = input.int(5, "Fast EMA")
ema_slow_length    = input.int(21, "Slow EMA")

atr_period         = input.int(14, "ATR Period")
atr_mult           = input.float(0.8, "ATR Multiplier")

volume_filter      = input.bool(false, "Enable Volume Filter")
volume_period      = input.int(20, "Volume SMA Period")
volume_mult        = input.float(1.0, "Volume Threshold Multiplier")

//=== Hesaplamalar ===

// RSI Hesabı
rsi_val = ta.rsi(close, rsi_length)

// ATR Tabanlı Volatilite Kontrolü
atr_val = ta.atr(atr_period)
volatility_ok = atr_val > (ta.sma(atr_val, atr_period) * atr_mult)

// EMA Trend
ema_fast_val = ta.ema(close, ema_fast_length)
ema_slow_val = ta.ema(close, ema_slow_length)
trend_up = ema_fast_val > ema_slow_val
trend_down = ema_fast_val < ema_slow_val

// Hacim Filtresi
volume_sma = ta.sma(volume, volume_period)
high_volume = volume > (volume_sma * volume_mult)

// Sinyal Koşulları (Aynı Alarm Koşulları)
long_signal = trend_up and rsi_val < rsi_lower_band and volatility_ok and (volume_filter ? high_volume : true)
short_signal = trend_down and rsi_val > rsi_upper_band and volatility_ok and (volume_filter ? high_volume : true)

//=== Strateji Mantığı ===
// Basit bir yaklaşım:
// - Long sinyali gelince önce Short pozisyonu kapat, sonra Long pozisyona gir.
// - Short sinyali gelince önce Long pozisyonu kapat, sonra Short pozisyona gir.

if (long_signal)
    strategy.close("Short") // Eğer varsa Short pozisyonu kapat
    strategy.entry("Long", strategy.long)

if (short_signal)
    strategy.close("Long") // Eğer varsa Long pozisyonu kapat
    strategy.entry("Short", strategy.short)

// EMA Çizimleri
plot(ema_fast_val, title="Fast EMA (5)", color=color.new(color.orange, 0), linewidth=2)
plot(ema_slow_val, title="Slow EMA (21)", color=color.new(color.blue, 0), linewidth=2)

// Sinyal İşaretleri
plotshape(long_signal, title="BUY Signal", location=location.belowbar,
     color=color.new(color.green, 0), style=shape.labelup, text="BUY")

plotshape(short_signal, title="SELL Signal", location=location.abovebar,
     color=color.new(color.red, 0), style=shape.labeldown, text="SELL")

// Arka plan renklendirmesi
bgcolor(long_signal ? color.new(color.green, 85) : short_signal ? color.new(color.red, 85) : na)

// Alarm Koşulları (İndikatör ile aynı koşullar)
alertcondition(long_signal, title="Buy Alert", message="BTCUSDT Scalp Master: Buy Signal Triggered")
alertcondition(short_signal, title="Sell Alert", message="BTCUSDT Scalp Master: Sell Alert Triggered")
Published by ChaoZhang on the FMZ strategy square · last modified 2024-12-20. Collected in the Quant Trading Vault. Unvalidated research: re-test with your own data and costs before trusting it.
Build this with AgenKit
A spec is not a trading system. Paste this into your coding agent and AgenKit runs a specialist team — architecture, test-first build, risk gates, review — with paper trading on by default.
/agenkit build a production-grade trading bot with a backtest engine, risk controls and paper trading by default from strategies/Multi-Indicator-Volatility-Trading-RSI-EMA-ATR-Strategy.md- npx agenkit install engineering-kit in your project
- Paste the command into your agent and approve each phase
- Get tests, backtest, risk controls and a paper-trading switch
Understand it first
Before you run this, read the lesson behind the idea and how to backtest it honestly. Specs like this one are the survivors of an unknown number of trials; deflate their results accordingly.
Related specs
- Multi Indicator Dynamic Adaptive Position Sizing with ATR Volatility StrategyPine Script · Volatility · 2h
- Big Snapper Alerts R30 Chaiking Volatility condition TP RSIPine Script · Volatility · 2h
- Multi Indicator Dynamic Position Size Volatility Adaptive Quantitative Trading StrategyPine Script · Volatility · 1d
- Profit rate theory volatility index quantification strategyPine Script · Volatility · 3h
- Rose Cross Star Dual Indicator Volatility StrategyPine Script · Volatility · 1d
- Stan The Man An Advanced Stock Trading Strategy Based on Dual Moving Average and VolatilityPine Script · Volatility · 1m