Strategy vault / Trend following
Multi Level Fibonacci EMA Trend Following Strategy
This strategy is a trend-following trading system that combines Fibonacci retracements, multiple exponential moving averages, and volume analysis. It identifies potential trading opportunities by analyzing price…
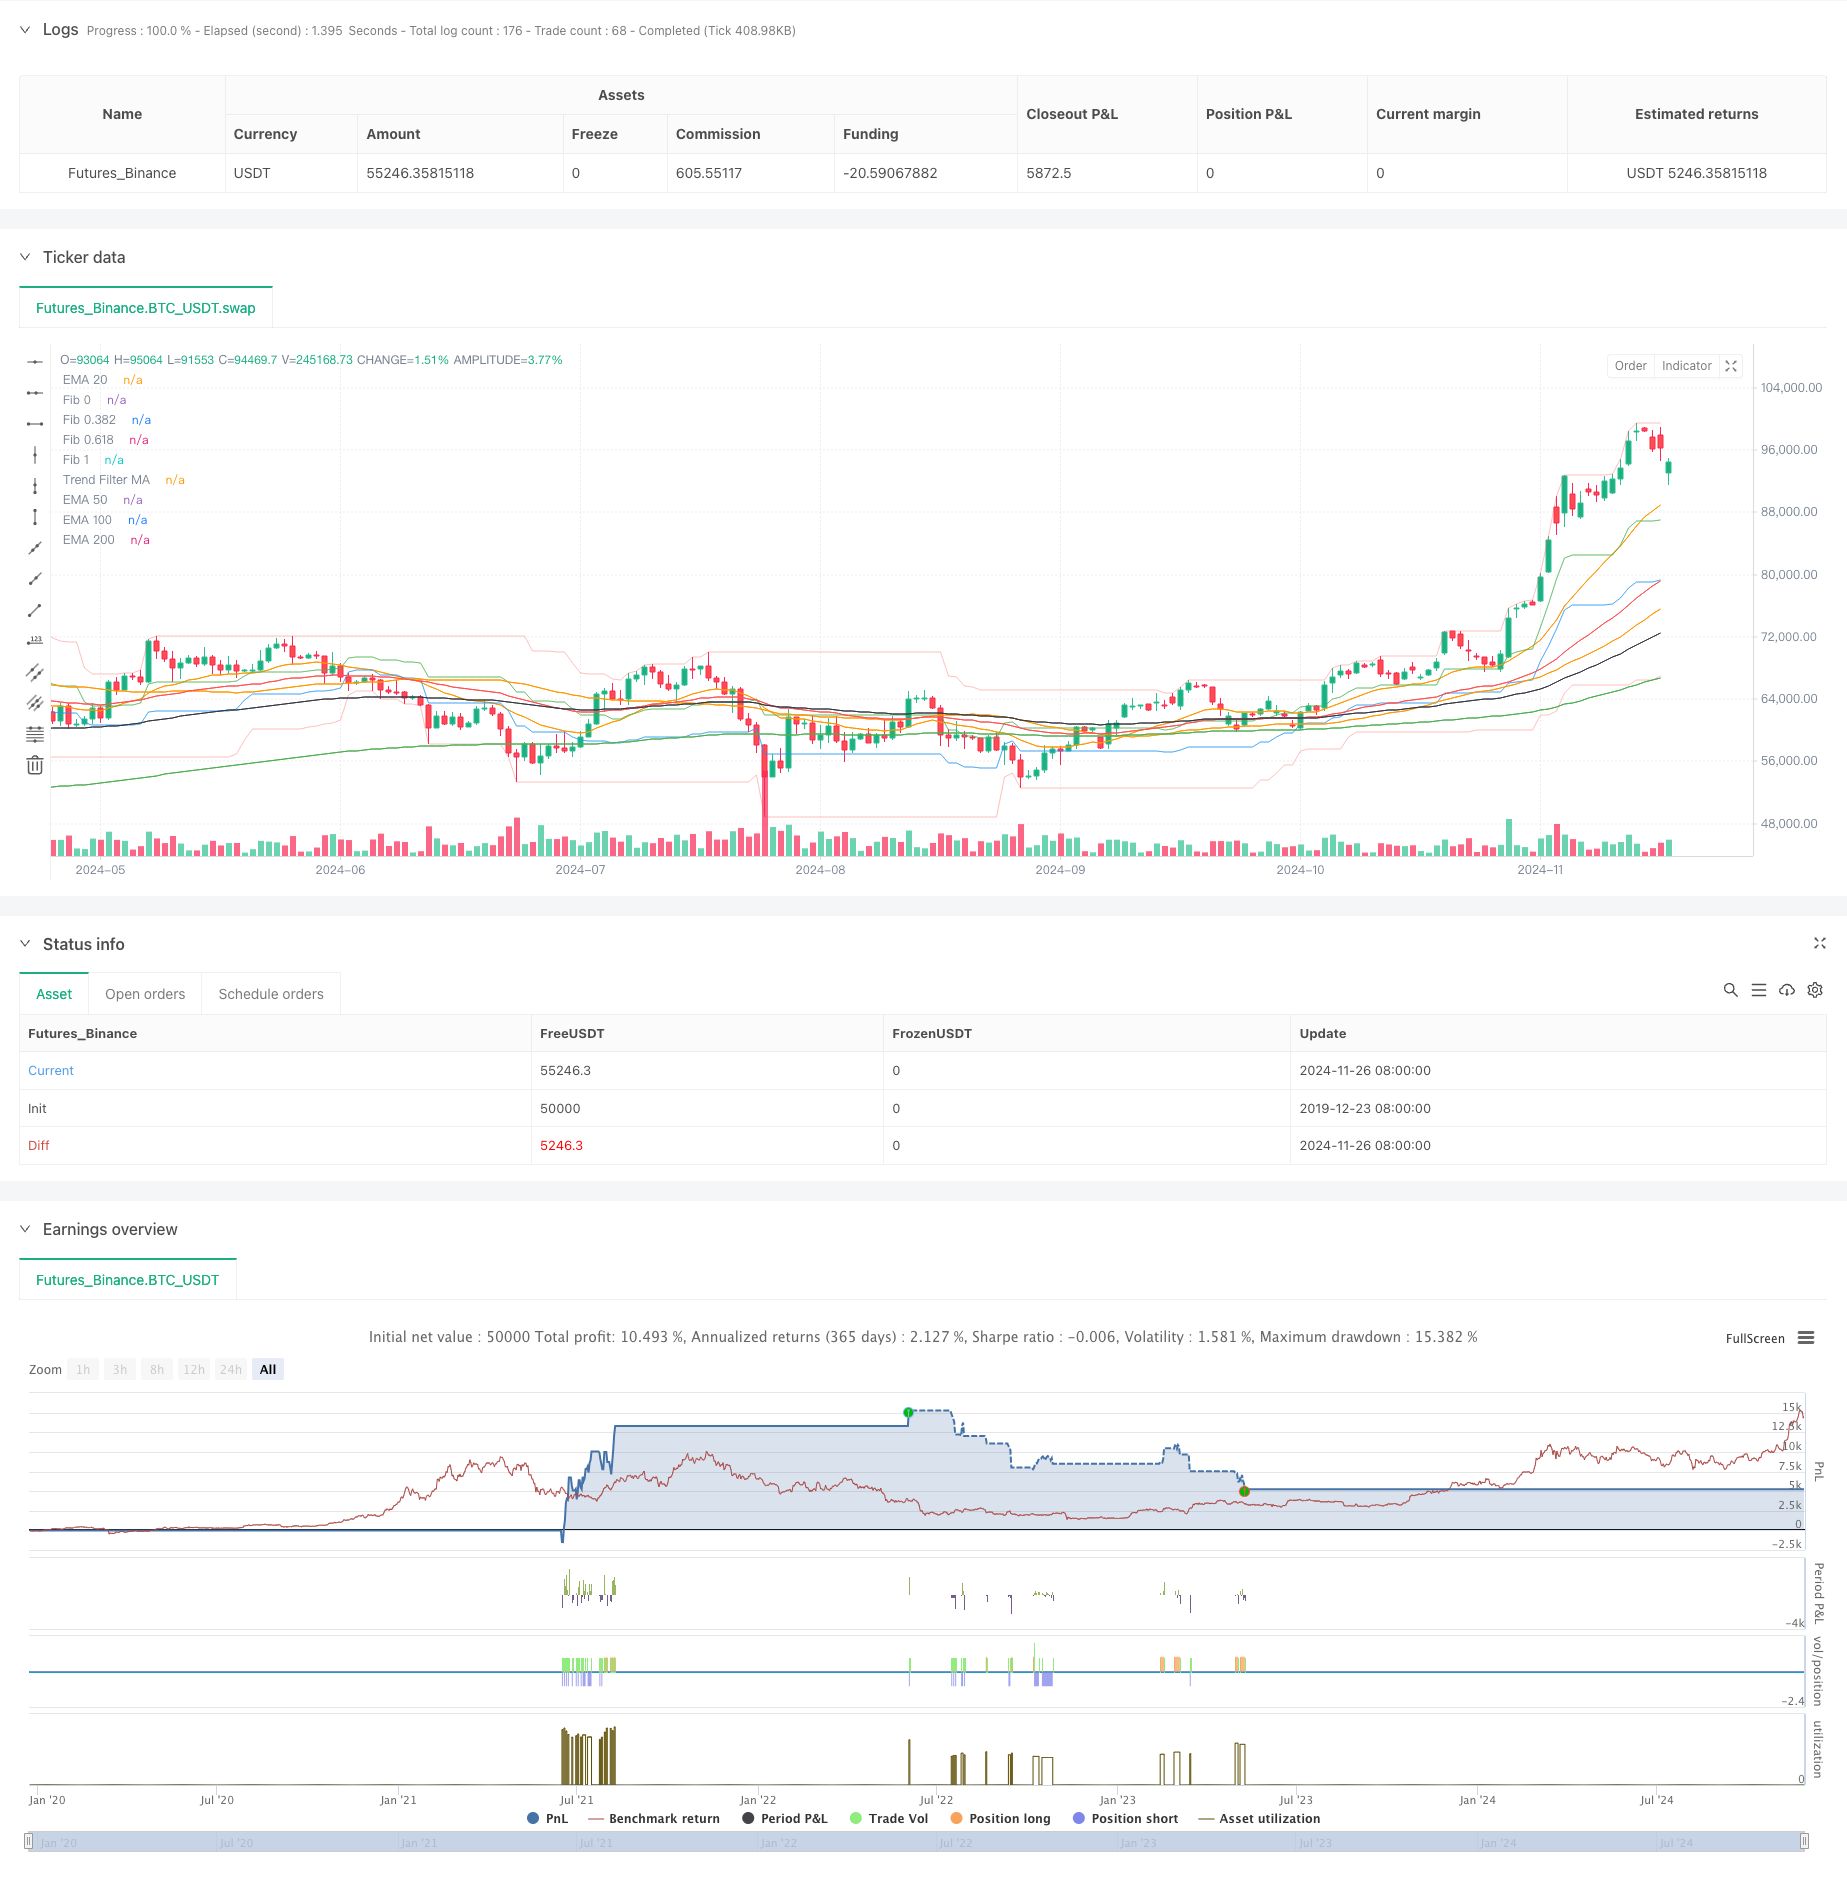
Overview
This strategy is a trend-following trading system that combines Fibonacci retracements, multiple exponential moving averages, and volume analysis. It identifies potential trading opportunities by analyzing price positions at different Fibonacci retracement levels (0, 0.382, 0.618, 1), confirming trends with multi-period EMAs (20/50/100/200), and filtering through volume thresholds. The system includes a comprehensive risk management mechanism with fixed percentage stop-loss and take-profit settings.
Strategy Principles
The core logic is based on multi-level technical analysis:
- Uses a 30-period lookback window to calculate Fibonacci retracement levels, establishing support and resistance framework
- Constructs a multi-level trend confirmation system using 20/50/100/200 period exponential moving averages
- Triggers long signals when price approaches the 0.382 Fibonacci level with volume above threshold and price above moving averages
- Triggers short signals when price approaches the 0.618 Fibonacci level with volume above threshold and price below moving averages
- Implements percentage-based take-profit and stop-loss mechanisms at 6% and 3% respectively
Strategy Advantages
- Multi-dimensional Analysis: Combines price patterns, trends, and volume for improved signal reliability
- Comprehensive Risk Management: Clear stop-loss and take-profit conditions effectively control risk per trade
- Thorough Trend Confirmation: Multiple moving average system accurately judges trend strength and direction
- Strict Signal Filtering: Requires simultaneous satisfaction of price, moving average, and volume conditions
- High Visualization: Clear label system marks entry and exit points for analysis and optimization
Strategy Risks
- Sideways Market Risk: May generate frequent false signals in ranging markets, consider adding oscillator filters
- Slippage Risk: Volume conditions may lead to execution slippage, requires volume threshold adjustment
- Money Management Risk: Fixed percentage stops may lack flexibility, consider dynamic adjustment based on volatility
- Trend Dependency: Strategy performs well in clear trends but may face consecutive losses during trend transitions
- Parameter Sensitivity: Multiple parameter combinations increase overfitting risk, requires backtesting across timeframes
Optimization Directions
- Dynamic Stop-Loss: Implement ATR indicator for dynamic stop-loss adjustment and improved market volatility adaptation
- Trend Strength Quantification: Add ADX or similar indicators to adjust position sizing based on trend strength
- Enhanced Volume Analysis: Include volume moving averages and abnormal volume analysis
- Entry Timing Optimization: Incorporate RSI or similar oscillators for overbought/oversold opportunities in trend direction
- Position Management: Implement dynamic position sizing based on trend strength and market volatility
Summary
This is a well-designed multi-level trend following strategy that builds a comprehensive analysis framework using classic technical analysis tools. Its strengths lie in the rigorous signal confirmation and complete risk management, while attention needs to be paid to performance in ranging markets. Through the suggested optimizations, particularly in dynamic risk management and trend strength quantification, the strategy's stability and profitability can be further enhanced.
Source Pine Script
/*backtest
start: 2019-12-23 08:00:00
end: 2024-11-27 08:00:00
period: 1d
basePeriod: 1d
exchanges: [{"eid":"Futures_Binance","currency":"BTC_USDT"}]
*/

//@version=5
strategy("ALD Fib Ema SAKALAM", overlay=true)

// Inputs
lookback = input.int(30, title="Lookback Period for Fibonacci", minval=10)
volumeThreshold = input.float(500000, title="24h Volume Threshold", step=50000)
stopLossPct = input.float(3.0, title="Stop Loss %", minval=0.5)
takeProfitPct = input.float(6.0, title="Take Profit %", minval=1.0)
maLength = input.int(50, title="Trend Filter MA Length", minval=1)

// Moving Average (Trend Filter)
ma = ta.sma(close, maLength)

// High and Low for Fibonacci Levels
var float swingHigh = na
var float swingLow = na

if bar_index > lookback
    swingHigh := ta.highest(high, lookback)
    swingLow := ta.lowest(low, lookback)

// Fibonacci Levels Calculation
fib0 = swingLow
fib1 = swingHigh
fib382 = swingHigh - 0.382 * (swingHigh - swingLow)
fib618 = swingHigh - 0.618 * (swingHigh - swingLow)

// 24-hour Volume Calculation
volume24h = ta.sma(volume, 24)

// Plot Fibonacci Levels
plot(fib0, title="Fib 0", color=color.new(color.red, 80))
plot(fib382, title="Fib 0.382", color=color.new(color.green, 50))
plot(fib618, title="Fib 0.618", color=color.new(color.blue, 50))
plot(fib1, title="Fib 1", color=color.new(color.red, 80))
plot(ma, title="Trend Filter MA", color=color.orange)

// Entry Condition: Buy Signal
longCondition = (close <= fib382) and (volume24h > volumeThreshold) and (close > ma)
if (longCondition)
    strategy.entry("Buy", strategy.long)
    label.new(bar_index, low, "BUY", style=label.style_label_up, color=color.green, textcolor=color.white)

// Exit Conditions
takeProfitPrice = strategy.position_avg_price * (1 + takeProfitPct / 100)
stopLossPrice = strategy.position_avg_price * (1 - stopLossPct / 100)

// Place Exit Orders
strategy.exit("Take Profit/Stop Loss", from_entry="Buy", limit=takeProfitPrice, stop=stopLossPrice)

// Add Labels for Exits
if (strategy.position_size > 0)
    if (high >= takeProfitPrice)
        label.new(bar_index, high, "EXIT (Take Profit)", style=label.style_label_down, color=color.blue, textcolor=color.white)

    if (low <= stopLossPrice)
        label.new(bar_index, low, "EXIT (Stop Loss)", style=label.style_label_down, color=color.red, textcolor=color.white)

// Short Selling Conditions
shortCondition = (close >= fib618) and (volume24h > volumeThreshold) and (close < ma)
if (shortCondition)
    strategy.entry("Sell", strategy.short)
    label.new(bar_index, high, "SELL", style=label.style_label_down, color=color.red, textcolor=color.white)

// Short Exit Conditions
if (strategy.position_size < 0)
    strategy.exit("Short Take Profit/Stop Loss", from_entry="Sell", limit=strategy.position_avg_price * (1 - takeProfitPct / 100), stop=strategy.position_avg_price * (1 + stopLossPct / 100))

// Add EMA 20/50/100/200
shortest = ta.ema(close, 20)
short = ta.ema(close, 50)
longer = ta.ema(close, 100)
longest = ta.ema(close, 200)

plot(shortest, color=color.orange, title="EMA 20")
plot(short, color=color.red, title="EMA 50")
plot(longer, color=color.black, title="EMA 100")
plot(longest, color=color.green, title="EMA 200")
Published by ChaoZhang on the FMZ strategy square · last modified 2024-11-29. Collected in the Quant Trading Vault. Unvalidated research: re-test with your own data and costs before trusting it.
Build this with AgenKit
A spec is not a trading system. Paste this into your coding agent and AgenKit runs a specialist team — architecture, test-first build, risk gates, review — with paper trading on by default.
/agenkit build a production-grade trading bot with a backtest engine, risk controls and paper trading by default from strategies/Multi-Level-Fibonacci-EMA-Trend-Following-Strategy.md- npx agenkit install engineering-kit in your project
- Paste the command into your agent and approve each phase
- Get tests, backtest, risk controls and a paper-trading switch
Understand it first
Before you run this, read the lesson behind the idea and how to backtest it honestly. Specs like this one are the survivors of an unknown number of trials; deflate their results accordingly.
Related specs
- Multi Period Trend Confirmation Dynamic Risk Control Quantitative Trading StrategyPine Script · Trend following · 1h
- Multi Factor Trend Price Action Strategy with Dynamic Risk Management SystemPine Script · Trend following · 2h
- Multi Indicator Dynamic Trend Following Strategy Based on EMA and SMAPine Script · Trend following · 1d
- Trend Tracking and Short term Trading Strategy Based on ADX IndicatorPine Script · Trend following · 1d
- ADX Filtered SuperTrend Pivot Trading StrategyPine Script · Trend following · 1d
- Advanced Multi Indicator Trend Confirmation Trading StrategyPine Script · Trend following · 1d