Strategy vault / Mean reversion
Multi Level Support Resistance Momentum Reversal Trading Strategy
This strategy is a multi-dimensional trading system that combines Fibonacci retracement, pivot points, and the Relative Strength Index (RSI). It captures potential trading opportunities by identifying key…
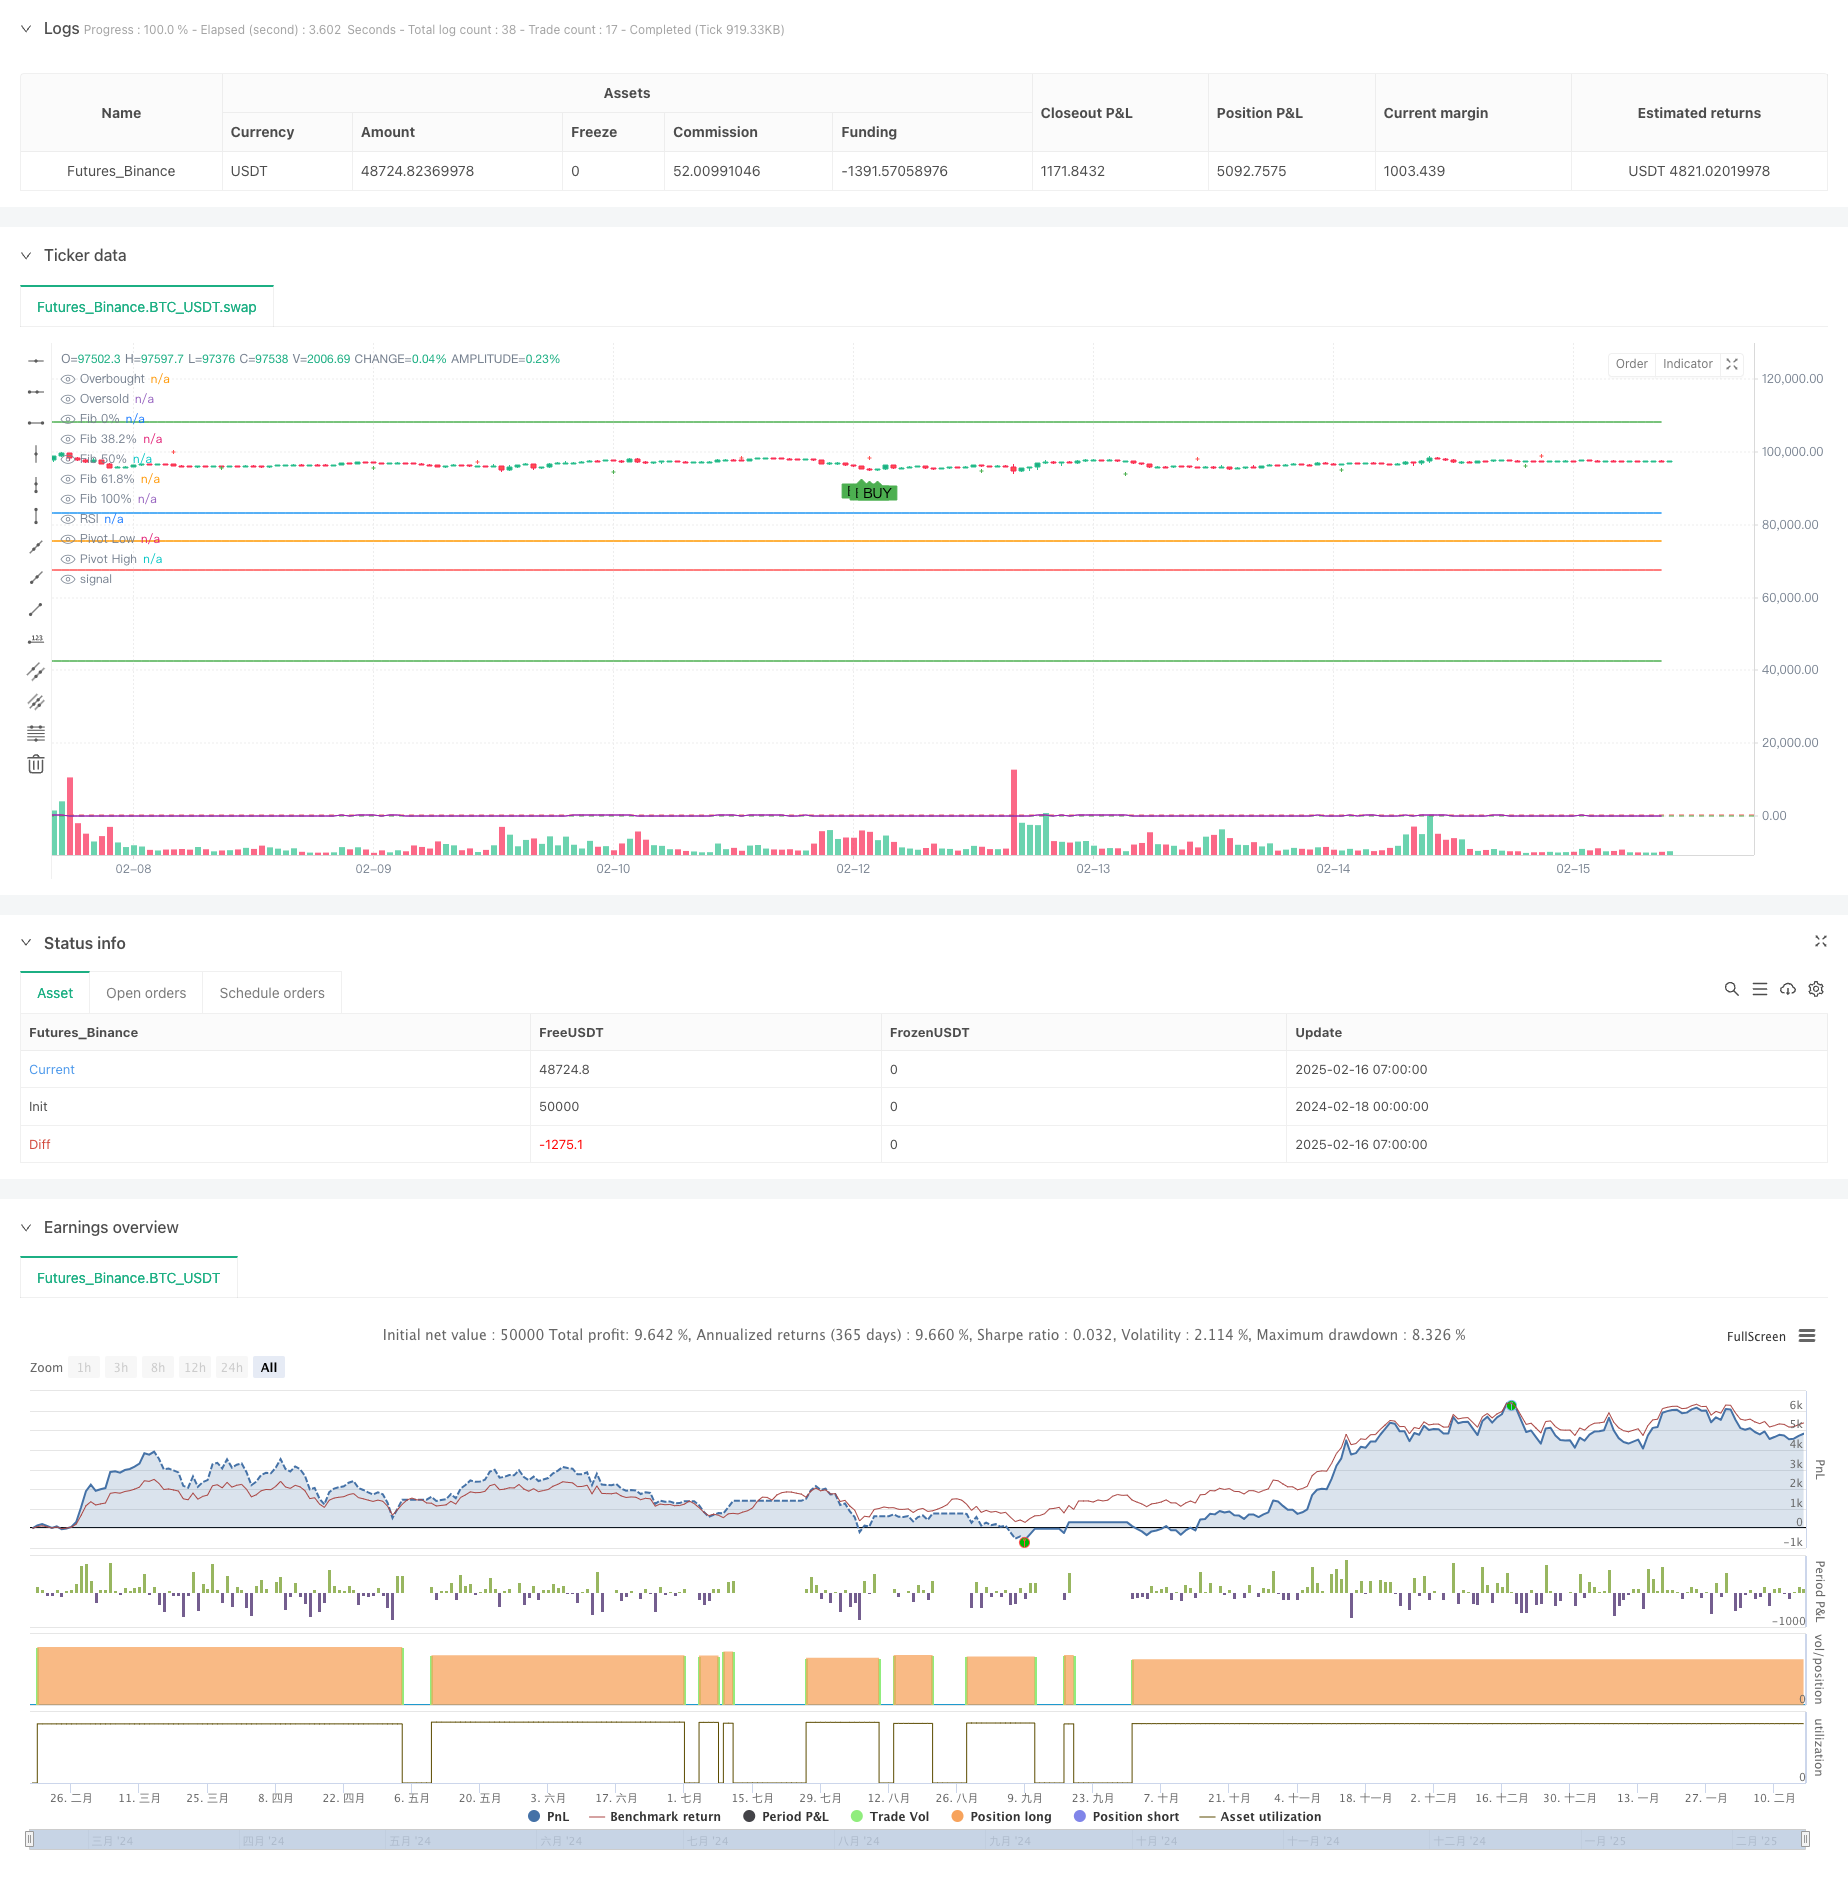
Overview
This strategy is a multi-dimensional trading system that combines Fibonacci retracement, pivot points, and the Relative Strength Index (RSI). It captures potential trading opportunities by identifying key support/resistance levels and market overbought/oversold conditions. The strategy employs multiple technical indicators for cross-validation, enhancing the reliability of trading signals.
Strategy Principles
The core logic is based on the synergy of three key components:
- Fibonacci retracement levels (38.2%, 50%, 61.8%) determine potential support/resistance zones, automatically calculated from highs and lows.
- The pivot point system identifies swing highs and lows using a 14-period window, helping determine market structure.
- RSI indicator uses a 14-period setting to identify overbought (>70) and oversold (<30) conditions.
Trade signal triggers:
- Buy signal: Price bounces from Fibonacci retracement levels with RSI in oversold territory
- Sell signal: Price rejects from Fibonacci retracement levels with RSI in overbought territory
Strategy Advantages
- Multi-dimensional analysis improves trading accuracy through cross-validation of technical indicators.
- Strong adaptability with automatic adjustment of support/resistance levels based on market volatility.
- Comprehensive risk management through percentage-based position sizing.
- Excellent visualization allowing traders to intuitively understand market structure and trading signals.
Strategy Risks
- Support/resistance levels may become less effective in highly volatile markets.
- Multiple indicators might lead to lagging signals, affecting entry timing.
- Strategy performance may be suboptimal during strong trend periods.
Risk control recommendations:
- Set appropriate stop-loss levels to avoid significant losses
- Trade cautiously during major economic data releases
- Incorporate higher timeframe trend analysis
Strategy Optimization Directions
Indicator Parameter Optimization:
- Consider adjusting RSI periods and thresholds for different market conditions
- Optimize pivot point calculation periods to improve turning point identification
Signal Filtering:
- Add volume confirmation
- Introduce trend filters to avoid reversal trades during strong trends
Risk Management Enhancement:
- Implement dynamic stop-loss mechanisms
- Adjust position sizes based on volatility
Summary
This is a comprehensive trading system based on multiple technical indicators, capturing market reversal opportunities through the combination of support/resistance levels and momentum indicators. The strategy's strength lies in its multi-dimensional analysis approach and robust risk management mechanisms, but users need to be aware of market conditions' impact on strategy performance and optimize parameters according to actual circumstances.
Source Pine Script
/*backtest
start: 2024-02-18 00:00:00
end: 2025-02-16 08:00:00
period: 1h
basePeriod: 1h
exchanges: [{"eid":"Futures_Binance","currency":"BTC_USDT"}]
*/

//@version=5
strategy("Fibonacci Retracement + Pivot Points + RSI Strategy", overlay=true, default_qty_type=strategy.percent_of_equity, default_qty_value=20)

// --- Fibonacci Retracement Parameters ---
var float fib_low = na
var float fib_high = na

if (ta.change(close) > 0)
    fib_low := na(fib_low) ? close : math.min(fib_low, close)
    fib_high := na(fib_high) ? close : math.max(fib_high, close)

fib_0 = fib_low
fib_100 = fib_high
fib_38 = fib_high - (fib_high - fib_low) * 0.382
fib_50 = fib_high - (fib_high - fib_low) * 0.5
fib_61 = fib_high - (fib_high - fib_low) * 0.618

plot(fib_0, color=color.green, title="Fib 0%")
plot(fib_38, color=color.blue, title="Fib 38.2%")
plot(fib_50, color=color.orange, title="Fib 50%")
plot(fib_61, color=color.red, title="Fib 61.8%")
plot(fib_100, color=color.green, title="Fib 100%")

// --- Pivot Points Parameters ---
pp_length = 14
pivot_high = ta.pivothigh(high, pp_length, pp_length)
pivot_low = ta.pivotlow(low, pp_length, pp_length)
plot(pivot_high, color=color.red, style=plot.style_cross, title="Pivot High")
plot(pivot_low, color=color.green, style=plot.style_cross, title="Pivot Low")

// --- RSI Parameters ---
rsi_length = 14
rsi_overbought = 70
rsi_oversold = 30
rsi = ta.rsi(close, rsi_length)
plot(rsi, color=color.purple, title="RSI")
hline(rsi_overbought, "Overbought", color=color.red)
hline(rsi_oversold, "Oversold", color=color.green)

// --- Buy and Sell Conditions ---
// Buy Condition:
// - Price bounces from Fibonacci retracement levels (38.2%, 50%, or 61.8%)
// - RSI is below oversold level (30)
buyCondition = (close > fib_38 or close > fib_50 or close > fib_61) and rsi < rsi_oversold

// Sell Condition:
// - Price rejects from Fibonacci retracement levels (38.2%, 50%, or 61.8%)
// - RSI is above overbought level (70)
sellCondition = (close < fib_38 or close < fib_50 or close < fib_61) and rsi > rsi_overbought

// Plot Buy/Sell Signals
plotshape(series=buyCondition, title="Buy Signal", location=location.belowbar, color=color.green, style=shape.labelup, text="BUY")
plotshape(series=sellCondition, title="Sell Signal", location=location.abovebar, color=color.red, style=shape.labeldown, text="SELL")

// --- Execute Trades ---
if (buyCondition)
    strategy.entry("Long", strategy.long)

if (sellCondition)
    strategy.close("Long")
Published by ChaoZhang on the FMZ strategy square · last modified 2025-02-18. Collected in the Quant Trading Vault. Unvalidated research: re-test with your own data and costs before trusting it.
Build this with AgenKit
A spec is not a trading system. Paste this into your coding agent and AgenKit runs a specialist team — architecture, test-first build, risk gates, review — with paper trading on by default.
/agenkit build a production-grade trading bot with a backtest engine, risk controls and paper trading by default from strategies/Multi-Level-Support-Resistance-Momentum-Reversal-Trading-Strategy.md- npx agenkit install engineering-kit in your project
- Paste the command into your agent and approve each phase
- Get tests, backtest, risk controls and a paper-trading switch
Understand it first
Before you run this, read the lesson behind the idea and how to backtest it honestly. Specs like this one are the survivors of an unknown number of trials; deflate their results accordingly.
Related specs
- Advanced Fibonacci Retracement Trend Following and Reversal Trading StrategyPine Script · Mean reversion · 3h
- Advanced Momentum EMA Trend Following with RSI Overbought Oversold Trading StrategyPine Script · Mean reversion · 1d
- EMA Crossover Fibonacci Reversal StrategyPine Script · Mean reversion · 1h
- Multi Level Support Resistance Weekly Mean Reversion Trading StrategyPine Script · Mean reversion · 1d
- Fibonacci Channel Based Candlestick Reversal Trading StrategyPine Script · Mean reversion · 1h
- Multi Dimensional Technical Indicator Cross Confirmation Buy Signal Optimization StrategyPine Script · Mean reversion · 1d