Strategy vault / Mean reversion
Multi model Candlestick Pattern Combination Strategy
This strategy combines multiple candlestick pattern models to trade stocks. It incorporates engulfing pattern, harami pattern and harami cross pattern to capture trading opportunities in different market conditions.
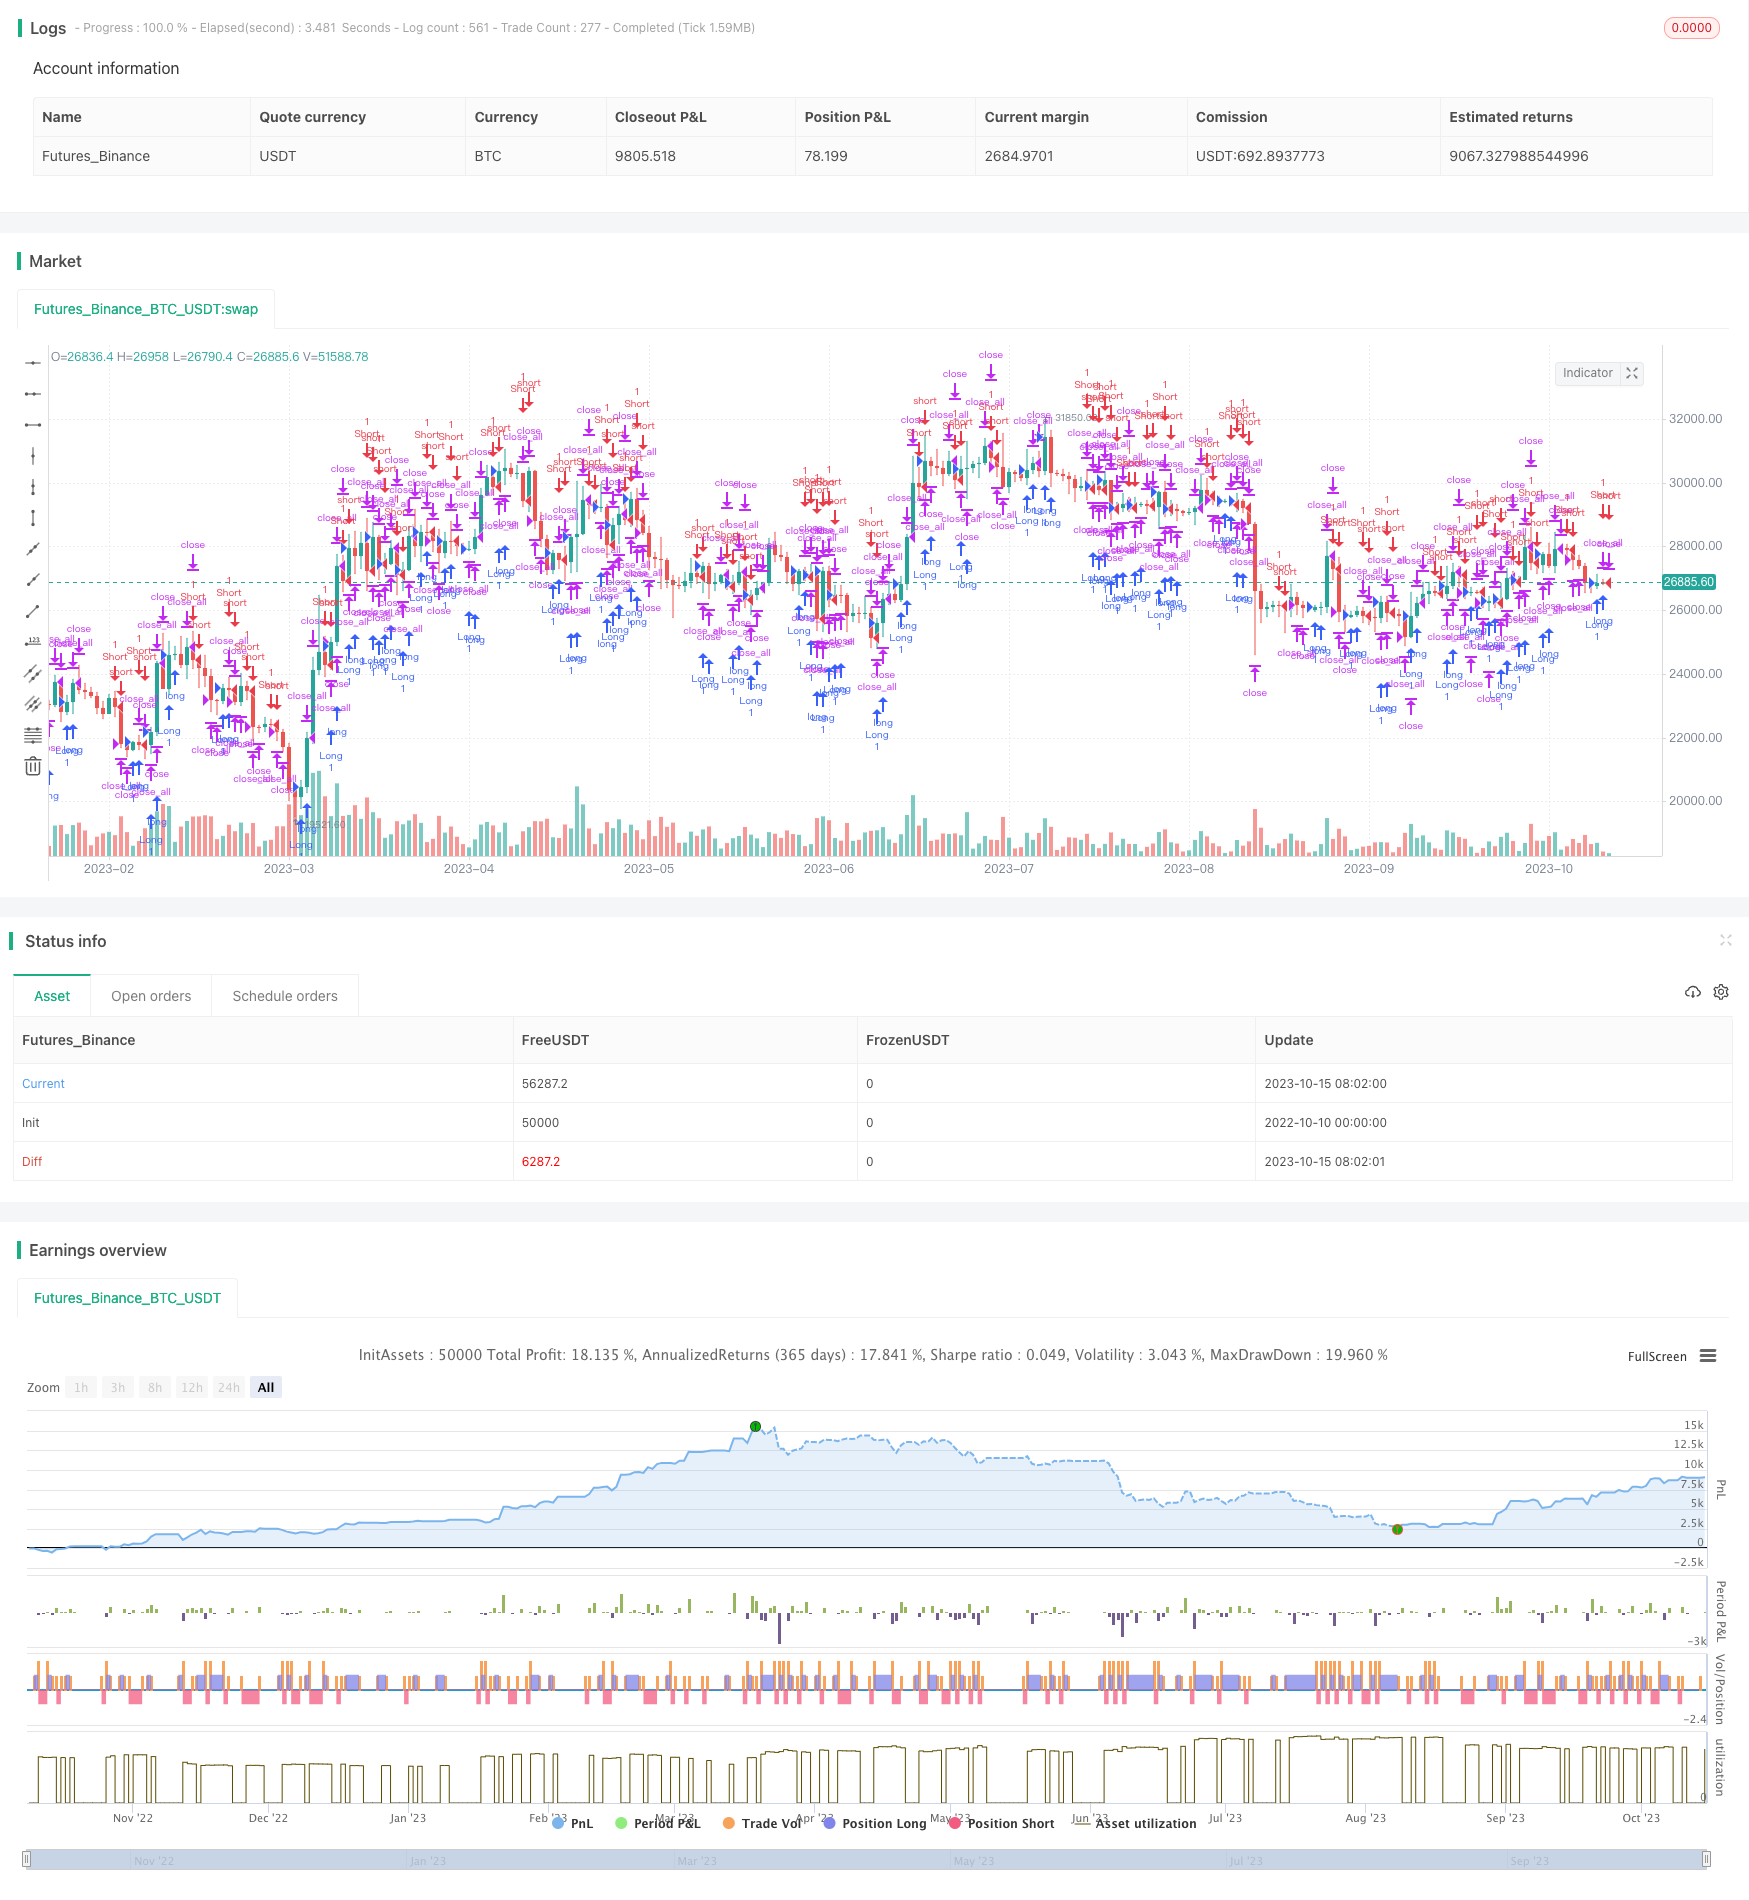
Overview
This strategy combines multiple candlestick pattern models to trade stocks. It incorporates engulfing pattern, harami pattern and harami cross pattern to capture trading opportunities in different market conditions.
Principle
The core logic of this strategy is to build several candlestick pattern recognition rules and then generate trading signals by combining these rules.
Firstly, it defines some basic variables to describe candlestick properties like the candle body size, open price, close price etc.
Then based on the relationship between the closing price and opening price, it defines 3 types of trading bar: 1 for rising, -1 for falling and 0 for no change.
On this basis, 3 candlestick pattern recognition rules are constructed:
Engulfing Pattern: current candle engulfs the previous one, generating buy or sell signals.
Harami Pattern: previous candle engulfs the current one, generating buy or sell signals.
Harami Cross Pattern: combination of Harami and Doji, generating buy or sell signals.
According to these candlestick patterns, the timing of buy and sell can be determined. Some additional conditions are combined to filter out invalid signals, like trading time range limit.
The trading logic checks existing position first. If contradicting with signal direction, it will close current position first, then open new position according to signal.
Advantages
Combination enhances stability. Single pattern is prone to specific market conditions. Combination can improve reliability.
Confirmation improves accuracy. Different patterns verify each other. False signals can be avoided.
Flexibility. Users can freely combine models and adjust parameters for different market dynamics.
Risk control. Stop loss and position handling logic manages risks effectively.
Risks
Complexity. More parameters means more complexity. Improper combination may undermine performance.
Parameter tuning requires expertise. How to set proper pattern parameters needs experience.
One-side holding risk. Long or short only limits profit potential. Allow both long and short can help.
Missing reversal points. Focusing on patterns loses sight of trend reversal signals. Adding other indicators can help identify potential reversal points.
Enhancement
Add stop loss to reduce holding risk.
Incorporate other technical indicators to determine overall trend, avoiding trading against major trend. E.g. MACD, Bollinger Band etc.
Test model parameters across different products, establish optimal parameter sets fitting each product.
Introduce machine learning to help optimize parameters and pattern recognition using AI.
Conclusion
This strategy constructs a relatively stable short-term trading system by combining multiple candlestick patterns. But parameter tuning and risk control still need improvement to adapt more complex markets. Overall it has solid logic and has great potential after accumulating enough data and experience, and leveraging machine learning for intelligent optimization.
Parameters
| Name | Default | What it controls |
|---|---|---|
| v_input_1 | true | Long |
| v_input_2 | true | Short |
| v_input_3 | true | Model Engulfing |
| v_input_4 | true | Model Harami |
| v_input_5 | true | Model Harami Cross |
| v_input_6 | 1900 | From Year |
| v_input_7 | 2100 | To Year |
| v_input_8 | true | From Month |
| v_input_9 | 12 | To Month |
| v_input_10 | true | From day |
| v_input_11 | 31 | To day |
| v_input_12 | false | Reversive trading |
Source Pine Script
/*backtest
start: 2022-10-10 00:00:00
end: 2023-10-16 00:00:00
period: 1d
basePeriod: 1h
exchanges: [{"eid":"Futures_Binance","currency":"BTC_USDT"}]
*/

//Noro
//2018

//@version=3
strategy(title = "Noro's CandleModels Tests", shorttitle = "CandleModels tests", overlay = true, default_qty_type = strategy.percent_of_equity, default_qty_value = 100, pyramiding = 0)

//Settings
needlong = input(true, defval = true, title = "Long")
needshort = input(true, defval = true, title = "Short")

eng = input(true, defval = true, title = "Model Engulfing")
har = input(true, defval = true, title = "Model Harami")
harc = input(true, defval = true, title = "Model Harami Cross")

fromyear = input(1900, defval = 1900, minval = 1900, maxval = 2100, title = "From Year")
toyear = input(2100, defval = 2100, minval = 1900, maxval = 2100, title = "To Year")
frommonth = input(01, defval = 01, minval = 01, maxval = 12, title = "From Month")
tomonth = input(12, defval = 12, minval = 01, maxval = 12, title = "To Month")
fromday = input(01, defval = 01, minval = 01, maxval = 31, title = "From day")
today = input(31, defval = 31, minval = 01, maxval = 31, title = "To day")
rev = input(false, defval = false, title = "Reversive trading")

//Body
body = abs(close - open)
abody = sma(body, 10)

//MinMax Bars
min = min(close, open)
max = max(close, open)

//Signals
bar = close > open ? 1 : close < open ? -1 : 0
doji = body < abody / 10
up1 = eng and bar == 1 and bar[1] == -1 and min <= min[1] and max >= max[1]
dn1 = eng and bar == -1 and bar[1] == 1 and min <= min[1] and max >= max[1]
up2 = har and bar == 1 and bar[1] == -1 and min >= min[1] and max <= max[1]
dn2 = har and bar == -1 and bar[1] == 1 and min >= min[1] and max <= max[1]
up3 = harc and doji and bar[1] == -1 and low >= min[1] and high <= max[1]
dn3 = harc and doji and bar[1] == 1 and low >= min[1] and high <= max[1]
exit = ((strategy.position_size > 0 and bar == 1) or (strategy.position_size < 0 and bar == -1)) and body > abody / 2 and rev == false

//Trading
if up1 or up2 or up3
    if strategy.position_size < 0
        strategy.close_all()

    strategy.entry("Long", strategy.long, needlong == false ? 0 : na, when=(time > timestamp(fromyear, frommonth, fromday, 00, 00) and time < timestamp(toyear, tomonth, today, 23, 59)))

if dn1 or dn2 or dn3
    if strategy.position_size > 0
        strategy.close_all()

    strategy.entry("Short", strategy.short, needshort == false ? 0 : na, when=(time > timestamp(fromyear, frommonth, fromday, 00, 00) and time < timestamp(toyear, tomonth, today, 23, 59)))

if time > timestamp(toyear, tomonth, today, 23, 59) or exit
strategy.close_all()Published by ChaoZhang on the FMZ strategy square · last modified 2023-10-17. Collected in the Quant Trading Vault. Unvalidated research: re-test with your own data and costs before trusting it.
Build this with AgenKit
A spec is not a trading system. Paste this into your coding agent and AgenKit runs a specialist team — architecture, test-first build, risk gates, review — with paper trading on by default.
/agenkit build a production-grade trading bot with a backtest engine, risk controls and paper trading by default from strategies/Multi-model-Candlestick-Pattern-Combination-Strategy.md- npx agenkit install engineering-kit in your project
- Paste the command into your agent and approve each phase
- Get tests, backtest, risk controls and a paper-trading switch
Understand it first
Before you run this, read the lesson behind the idea and how to backtest it honestly. Specs like this one are the survivors of an unknown number of trials; deflate their results accordingly.
Related specs
- Advanced 15 Minute Chart Trading Signal StrategyPine Script · Mean reversion · 3h
- CCTBBO Reversal Tracking StrategyPine Script · Mean reversion · 45m
- Enhanced Mean Reversion Strategy with MACD ATR ImplementationPine Script · Mean reversion · 3h
- Multi Timeframe Gold Reversal Tracking StrategyPine Script · Mean reversion · 2h
- Price Volatility Mean Reversion StrategyPine Script · Mean reversion · 2d
- Reversal Bollinger Band RSI MACD Quant StrategyPine Script · Mean reversion · 4h