Multi Moving Average Trading System with Momentum and Volume Confirmation Quantitative Trend Strategy
This strategy is a comprehensive quantitative trading system that combines multiple moving averages, Relative Strength Index (RSI), Average Directional Index (ADX), and volume analysis. The strategy executes trades…
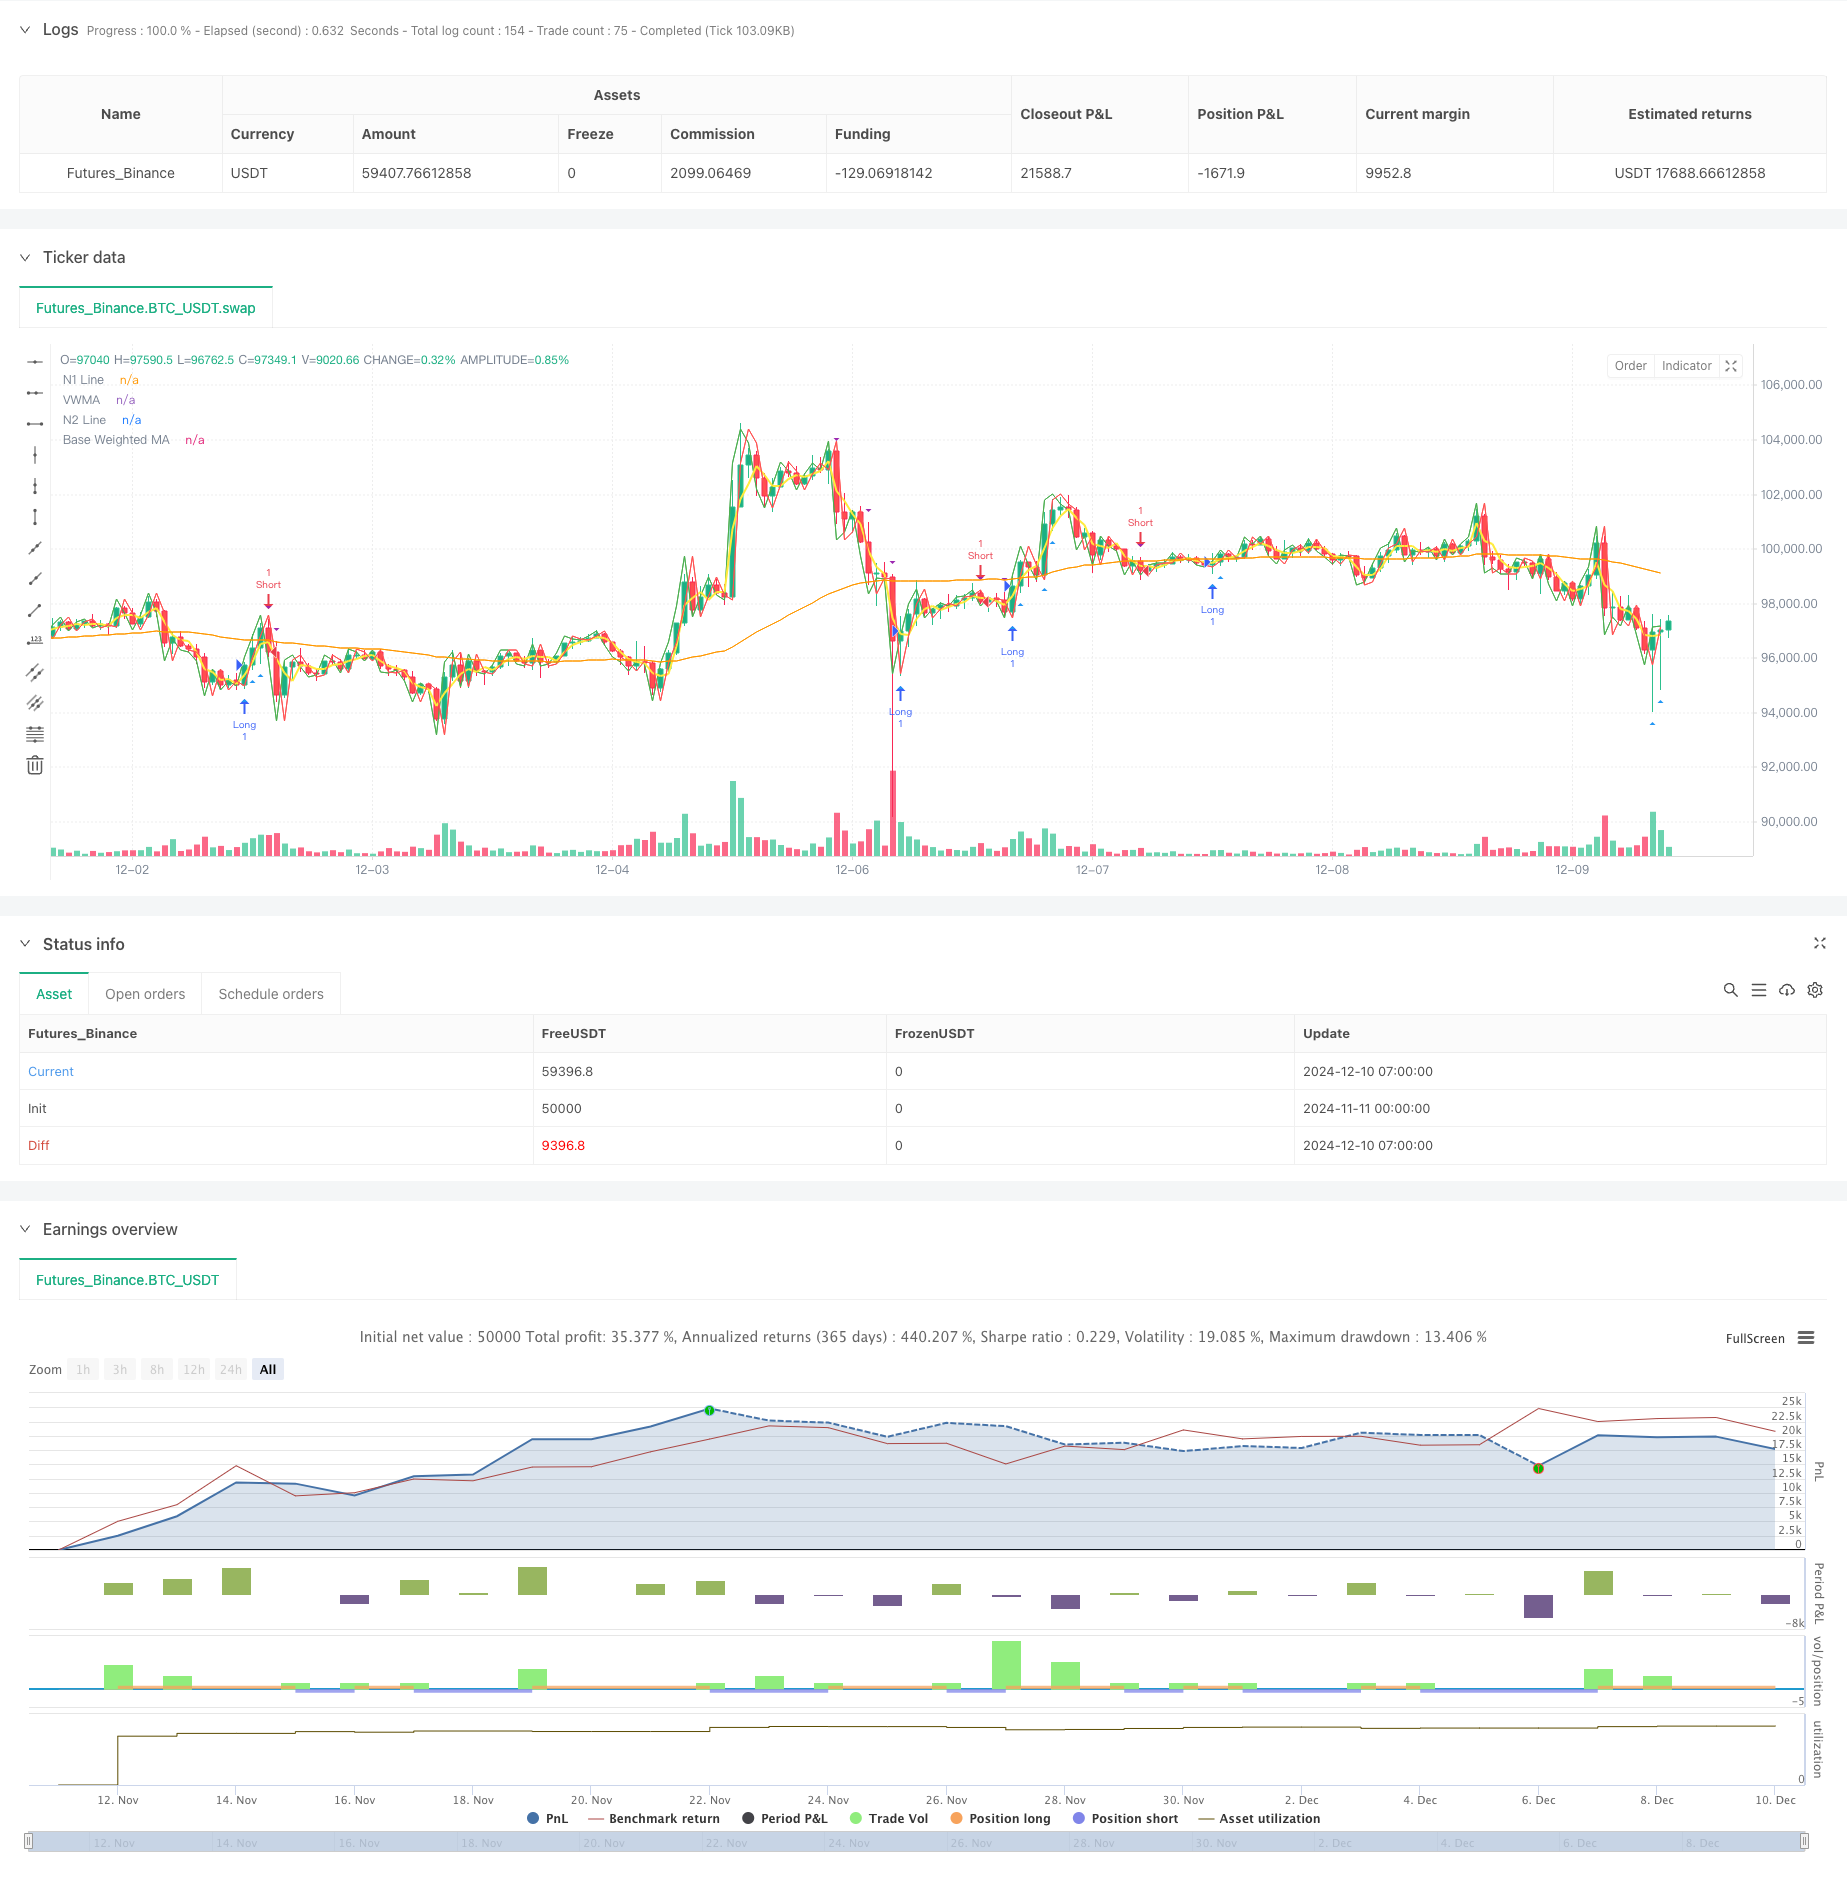
Overview
This strategy is a comprehensive quantitative trading system that combines multiple moving averages, Relative Strength Index (RSI), Average Directional Index (ADX), and volume analysis. The strategy executes trades based on trend confirmation through multiple technical indicators, using volume and momentum filters to enhance trading reliability.
Strategy Principles
The core logic is based on several key components:
- Multiple moving average system using Double HullMA, Volume-Weighted Moving Average (VWMA), and Basic Weighted Moving Average (WMA)
- Trend strength assessment using ADX indicator, trading only in strong trends
- RSI filtering to avoid extreme market conditions
- Volume analysis requiring above-threshold volume for trade signals
- Trade direction determination through n1 and n2 line crossovers
The multiple moving average system provides basic trend judgment, ADX ensures trading only in strong trends, RSI helps avoid chasing extremes, and volume analysis ensures trading during periods of high market activity.
Strategy Advantages
- Multiple confirmation mechanisms reduce false breakout risks
- Integration of technical indicators and volume analysis improves trading reliability
- RSI filtering avoids entering during unfavorable market conditions
- ADX usage ensures trading only in clear trends, improving win rate
- Volume requirements help confirm market consensus
- Clear strategy logic with adjustable parameters
Strategy Risks
- Multiple filters may cause missed trading opportunities
- May underperform in ranging markets
- Parameter optimization risks overfitting
- Moving average system may lag in quick reversals
- Volume filtering may limit opportunities in low liquidity markets
Risk management recommendations:
- Adjust parameters based on market characteristics
- Set appropriate stop-loss and take-profit levels
- Control position sizing
- Regular strategy backtesting
Strategy Optimization
- Introduce adaptive parameters based on market conditions
- Add volatility filters to adjust positions in high volatility periods
- Improve exit mechanisms with trailing stops
- Optimize volume filters using relative rather than absolute values
- Add time filters to avoid major news releases
- Consider adding price volatility indicators for better risk assessment
Summary
The strategy builds a relatively complete trend following system through multiple technical indicators working in concert. Its main feature is using multiple confirmations to improve trading reliability while controlling risk through various filters. While it may miss some opportunities, it generally helps improve trading stability. The suggested optimization directions provide room for further strategy enhancement.
Source Pine Script
/*backtest
start: 2024-11-11 00:00:00
end: 2024-12-10 08:00:00
period: 1h
basePeriod: 1h
exchanges: [{"eid":"Futures_Binance","currency":"BTC_USDT"}]
*/

//@version=5
strategy("Optimized Multi-MA Strategy with Volume, ADX and RSI", overlay=true)

// Kullanıcı Parametreleri
keh = input.int(3, title="Double HullMA", minval=1)
teh = input.int(3, title="Volume-Weighted MA", minval=1)
yeh = input.int(75, title="Base Weighted MA", minval=1)
rsiPeriod = input.int(14, title="RSI Period", minval=1)
adxPeriod = input.int(14, title="ADX Period", minval=1)
volumeLookback = input.int(10, title="Volume Lookback Period", minval=1)  // Son X mumun hacmi
adxThreshold = input.int(20, title="ADX Trend Strength Threshold", minval=1) // ADX için trend gücü eşiği

// Hareketli Ortalamalar
rvwma = ta.vwma(close, teh)
yma = ta.wma(close, yeh)
n2ma = 2 * ta.wma(close, math.round(keh / 2))
nma = ta.wma(close, keh)
diff = n2ma - nma
sqrtKeh = math.round(math.sqrt(keh))
n1 = ta.wma(diff, sqrtKeh)
n2 = ta.wma(diff[1], sqrtKeh)

// ADX Hesaplaması
trueRange = ta.rma(ta.tr, adxPeriod)
plusDM = ta.rma(math.max(high - high[1], 0), adxPeriod)
minusDM = ta.rma(math.max(low[1] - low, 0), adxPeriod)
plusDI = (plusDM / trueRange) * 100
minusDI = (minusDM / trueRange) * 100
dx = math.abs(plusDI - minusDI) / (plusDI + minusDI) * 100
adx = ta.rma(dx, adxPeriod)
trendIsStrong = adx > adxThreshold

// RSI Filtreleme
rsiValue = ta.rsi(close, rsiPeriod)
rsiFilter = rsiValue > 30 and rsiValue < 70  // Aşırı alım ve aşırı satım bölgelerinin dışında olmak

// Hacim Filtresi
volumeThreshold = ta.sma(volume, volumeLookback)  // Ortalama hacim seviyesi
highVolume = volume > volumeThreshold

// Sinyal Şartları (Sadece güçlü trendler ve rsi'nın aşırı bölgelerde olmaması)
longCondition = n1 > n2 and close > rvwma and trendIsStrong and rsiFilter and highVolume
shortCondition = n1 < n2 and close < rvwma and trendIsStrong and rsiFilter and highVolume

// Hacim Filtresi ile İşaretler
plotshape(series=longCondition and highVolume ? close : na, style=shape.triangleup, location=location.belowbar, color=color.blue, size=size.small, title="High Volume Long Signal")
plotshape(series=shortCondition and highVolume ? close : na, style=shape.triangledown, location=location.abovebar, color=color.purple, size=size.small, title="High Volume Short Signal")

// Strateji Giriş ve Çıkış Şartları
if (longCondition)
    strategy.entry("Long", strategy.long)

if (shortCondition)
    strategy.entry("Short", strategy.short)

// Görsel Göstergeler
plot(n1, color=color.green, title="N1 Line")
plot(n2, color=color.red, title="N2 Line")
plot(rvwma, color=color.yellow, linewidth=2, title="VWMA")
plot(yma, color=color.orange, title="Base Weighted MA")
Published by ChaoZhang on the FMZ strategy square · last modified 2024-12-12. Collected in the Quant Trading Vault. Unvalidated research: re-test with your own data and costs before trusting it.
Build this with AgenKit
A spec is not a trading system. Paste this into your coding agent and AgenKit runs a specialist team — architecture, test-first build, risk gates, review — with paper trading on by default.
/agenkit build a production-grade trading bot with a backtest engine, risk controls and paper trading by default from strategies/Multi-Moving-Average-Trading-System-with-Momentum-and-Volume-Confirmation-Quantitative-Trend-Strategy.md- npx agenkit install engineering-kit in your project
- Paste the command into your agent and approve each phase
- Get tests, backtest, risk controls and a paper-trading switch
Understand it first
Before you run this, read the lesson behind the idea and how to backtest it honestly. Specs like this one are the survivors of an unknown number of trials; deflate their results accordingly.
Related specs
- Dual Period Moving Average with RSI Momentum and Volume Trend Following StrategyPine Script · Momentum · 1d
- Multi Period Moving Average and RSI Momentum Cross StrategyPine Script · Momentum · 1d
- Multi Indicator Adaptive Momentum Crossover Trading SystemPine Script · Momentum · 1h
- Multi Indicator Dynamic Stop Loss Momentum Trend Trading StrategyPine Script · Momentum · 1h
- Multi Indicator Trend Momentum ATR Target Trading StrategyPine Script · Momentum · 1d
- RSI Trend Momentum Trading Strategy with Dual MA and Volume ConfirmationPine Script · Momentum · 1d