Strategy vault / Trend following
Multi Moving Average Trend Following and Risk Management Quantitative Trading Strategy
This strategy is a trend following system that combines multiple moving averages, momentum indicators, and dynamic risk control. The strategy identifies trading opportunities by analyzing price trends, market…
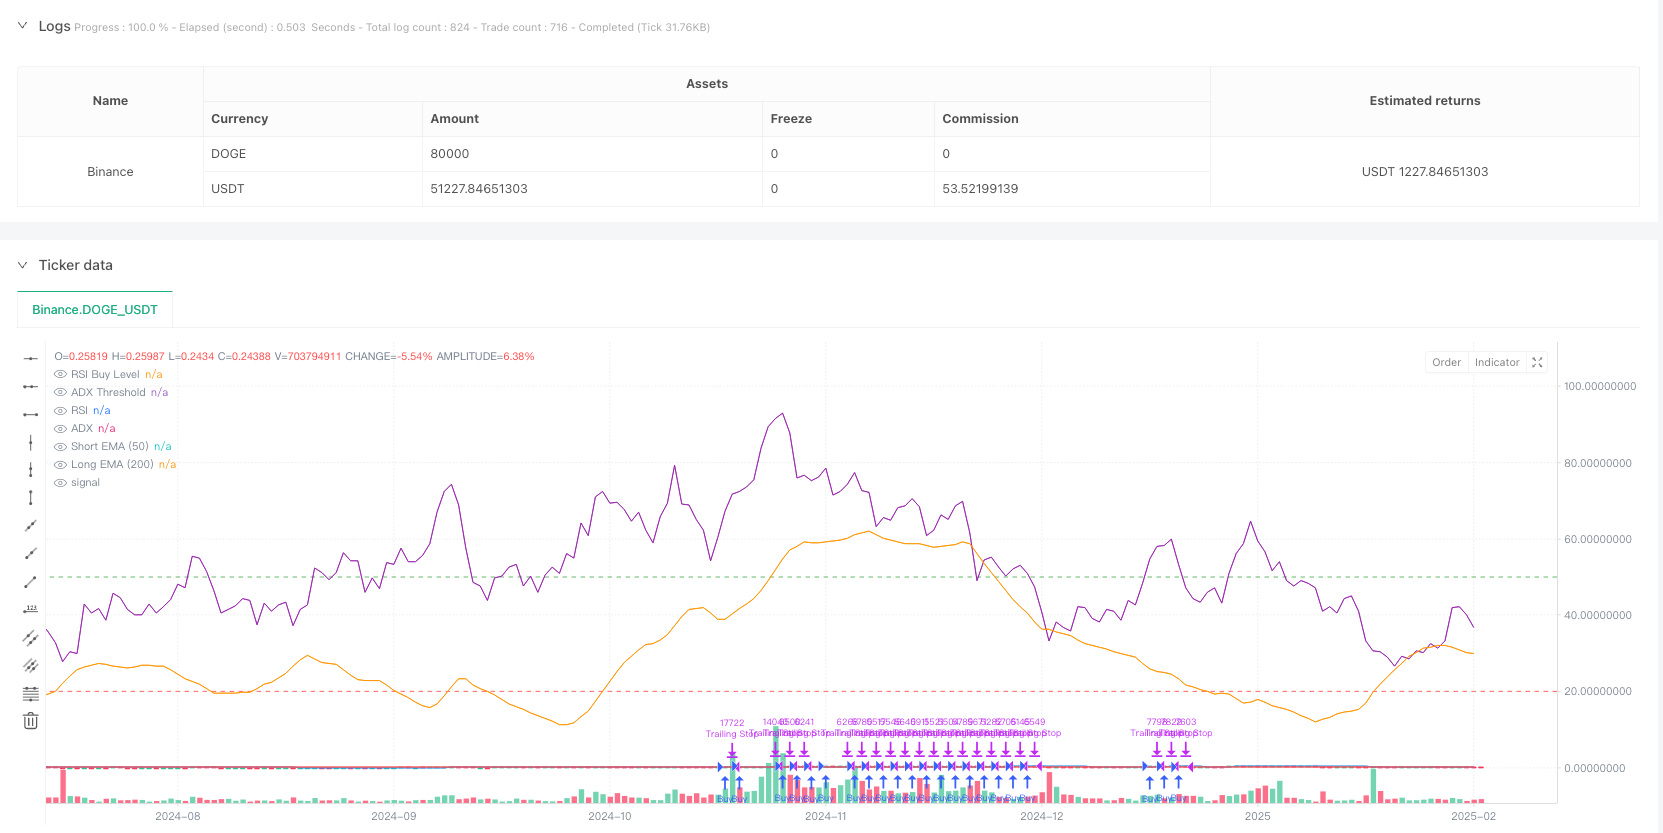
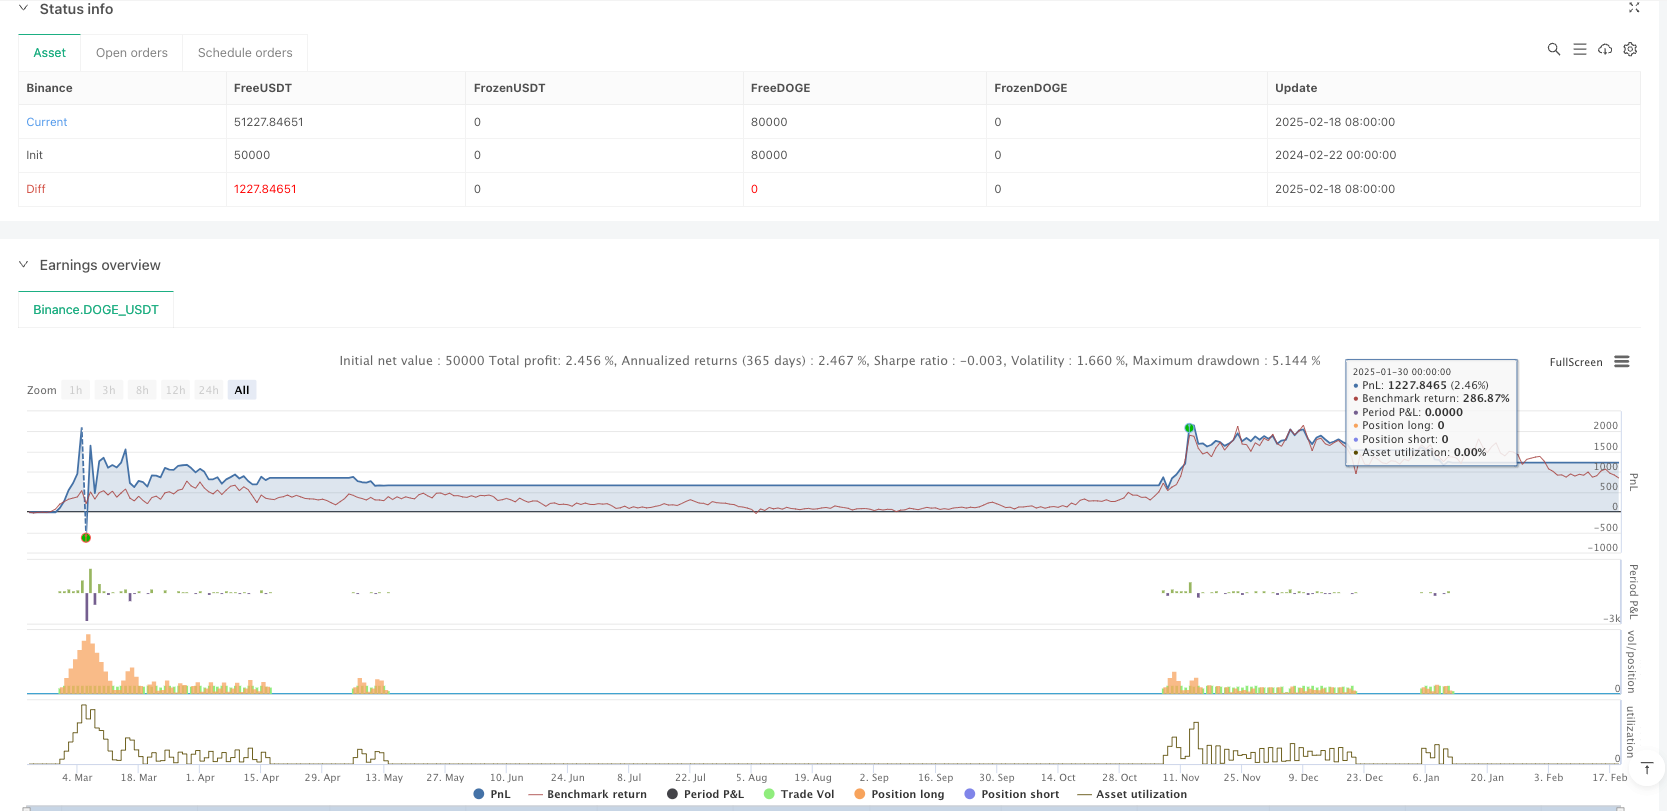
Overview
This strategy is a trend following system that combines multiple moving averages, momentum indicators, and dynamic risk control. The strategy identifies trading opportunities by analyzing price trends, market momentum and volatility, while employing strict position management and stop-loss mechanisms to control risk. The core logic revolves around the intersection of long- and short-term exponential moving averages (EMA) and the use of the relative strength index (RSI), and dynamically adjusts the stop loss position through the average true range (ATR).
Strategy Principle
The strategy uses a multi-level verification mechanism to confirm trade signals:
- Trend confirmation: Use the 50-day and 200-day exponential moving averages to determine the mid- and long-term trends, requiring the short-term average to remain above the long-term average for more than 10 periods.
- Momentum Verification: Use the RSI indicator to verify price momentum; confirm upward momentum when the RSI value is above the set threshold (default 50).
- Trend Strength: Introduce the Average Trend Index (ADX) to measure trend strength; an ADX above 20 indicates a significant trend.
- Dynamic Risk Control: Design dynamic stop-loss based on ATR, set stop-loss distance at 2.5 times ATR, and also set a trailing stop mechanism.
- Intelligent Position Management: Based on account equity and preset risk ratios, combined with ATR, the number of positions opened is dynamically calculated.
Strategy Advantages
- Multiple signal verification: Improve signal reliability through indicator verification in multiple dimensions such as moving average, momentum and trend strength.
- Dynamic Risk Management: Uses volatility-based dynamic stop-loss and trailing stop-loss that can adapt to market conditions.
- Intelligent position control: dynamically adjust positions based on account size and market volatility, effectively managing the risk of a single trade.
- Trend Persistence Requirements: Avoid false breakouts by setting trend duration requirements.
- Systematic Trading Prompts: Integrated trading signal alert functions for real-time operations.
Strategy Risks
- Trend reversal risk: large pullbacks may occur at the end of strong trends, it is recommended to adjust in combination with the market macro environment.
- Volatile market performance: Frequent transactions may occur in sideways and volatile markets, increasing transaction costs.
- Parameter Sensitivity: The settings of multiple indicator parameters will affect strategy performance and need to be optimized through backtesting.
- Impact of slippage: large slippage may occur when market liquidity is insufficient, affecting strategy returns.
Strategy optimization direction
- Market Environment Adaptation: Volatility indicators (such as VIX) can be introduced to dynamically adjust strategy parameters, improving adaptability across different market environments.
- Signal filtering: consider adding a volume indicator for verification to improve signal quality.
- Take-profit mechanism: a dynamic take-profit mechanism based on market volatility can be designed to optimize the risk-return ratio.
- Time cycle optimization: Consider verifying signal consistency across different time periods to improve trading stability.
- Machine learning optimization: Machine learning algorithms can be introduced to dynamically optimize parameters and improve strategy adaptability.
Summary
This strategy constructs a complete trend-following trading system through the comprehensive use of multiple technical indicators. The strategy performs well in risk control, effectively managing drawdowns through dynamic stop-loss and position management. The strategy is highly scalable, with multiple directions for optimization reserved. It is recommended that traders adjust parameters according to the specific market characteristics and their own risk preferences when using it in live trading.
Overview
This strategy is a trend following system that combines multiple moving averages, momentum indicators, and dynamic risk control. It identifies trading opportunities by analyzing price trends, market momentum, and volatility while implementing strict position management and stop-loss mechanisms. The core logic revolves around the crossover of long and short-term exponential moving averages (EMA) combined with the Relative Strength Index (RSI), using Average True Range (ATR) for dynamic stop-loss positioning.
Strategy Principles
The strategy employs a multi-layer verification mechanism to confirm trading signals:
- Trend Confirmation: Uses 50-day and 200-day EMAs to judge medium and long-term trends, requiring the short-term average to remain above the long-term average for more than 10 periods.
- Momentum Verification: Uses RSI to verify price momentum, confirming upward momentum when RSI exceeds the set threshold (default 50).
- Trend Strength: Incorporates Average Directional Index (ADX) to measure trend strength, with ADX above 20 indicating significant trend.
- Dynamic Risk Control: Designs dynamic stop-loss based on ATR, with stop-loss distance set at 2.5 times ATR, including trailing stop mechanism.
- Intelligent Position Management: Dynamically calculates position size based on account equity and preset risk ratio in combination with ATR.
Strategy Advantages
- Multiple Signal Verification: Improves signal reliability through validation across multiple dimensions including moving averages, momentum, and trend strength.
- Dynamic Risk Management: Employs volatility-based dynamic and trailing stops that adapt to market conditions.
- Intelligent Position Control: Dynamically adjusts positions based on account size and market volatility, effectively controlling single trade risk.
- Trend Persistence Requirement: Avoids false breakouts by setting trend duration requirements.
- Systematic Trading Alerts: Integrates trading signal notifications for real-time operation.
Strategy Risks
- Trend Reversal Risk: May experience significant drawdowns at trend endings, suggesting adjustment based on macro market conditions.
- Sideways Market Performance: May generate frequent trades in range-bound markets, increasing transaction costs.
- Parameter Sensitivity: Strategy performance affected by multiple indicator parameters, requiring backtest optimization.
- Slippage Impact: May face significant slippage in low liquidity conditions, affecting strategy returns.
Optimization Directions
- Market Environment Adaptation: Consider introducing volatility indicators (like VIX) for dynamic parameter adjustment to improve adaptability across different market conditions.
- Signal Filtering: Consider adding volume indicator verification to improve signal quality.
- Profit-Taking Mechanism: Design dynamic profit-taking mechanisms based on market volatility to optimize return-to-drawdown ratio.
- Timeframe Optimization: Consider validating signal consistency across different timeframes to improve trading stability.
- Machine Learning Optimization: Consider introducing machine learning algorithms for dynamic parameter optimization to enhance strategy adaptability.
Summary
This strategy constructs a complete trend following trading system through the comprehensive use of multiple technical indicators. It shows excellent performance in risk control through dynamic stop-loss and position management. The strategy demonstrates strong extensibility with multiple optimization directions reserved. Traders are advised to adjust parameters according to specific market characteristics and their own risk preferences when implementing in live trading.
Source Pine Script
/*backtest
start: 2024-02-22 00:00:00
end: 2025-02-19 08:00:00
period: 1d
basePeriod: 1d
exchanges: [{"eid":"Binance","currency":"DOGE_USDT"}]
*/

//@version=6
strategy("High-Return Trend Strategy (Final)", overlay=true)

// === Inputs ===
longEmaLength = input(200, title="Long EMA Length")
shortEmaLength = input(50, title="Short EMA Length")
rsiLength = input(14, title="RSI Length")
rsiBuyLevel = input(50, title="RSI Buy Level")
atrLength = input(14, title="ATR Length")
atrMultiplier = input(2.5, title="ATR Multiplier")  // Adjusted for lower drawdown
riskPerTrade = input.float(1.0, title="Risk % per Trade", minval=0.1, maxval=5.0, step=0.1)  // Risk % of equity


// === Indicators ===
longEma = ta.ema(close, longEmaLength)
shortEma = ta.ema(close, shortEmaLength)
rsi = ta.rsi(close, rsiLength)
atr = ta.atr(atrLength)
[plusDI, minusDI, adx] = ta.dmi(14, 14)  // DI and ADX smoothing set to 14

// === Position Sizing ===
// Calculate position size based on risk per trade
riskAmount = strategy.equity * (riskPerTrade / 100)  // Risk % of account equity
positionSize = riskAmount / (atr * atrMultiplier)  // ATR-based stop-loss distance

// === Entry Conditions ===
trendConfirmed = ta.barssince(shortEma <= longEma) > 10  // Persistent trend above long EMA
longCondition = shortEma > longEma and rsi > rsiBuyLevel and adx > 20 and trendConfirmed

// === Exit Conditions ===
longStopLoss = close - atr * atrMultiplier  // Dynamic stop-loss
strategy.exit("Trailing Stop", from_entry="Buy", trail_points=atr * 1.5, trail_offset=atr * 1.5)  // Trailing stop

// === Strategy Logic ===
if (longCondition)
    strategy.entry("Buy", strategy.long, qty=positionSize)

// === Alerts ===
alertcondition(longCondition, title="Buy Signal", message="Buy Signal Triggered!")
alertcondition(strategy.closedtrades > 0, title="Trade Closed", message="Trade Closed!")

// === Debugging and Visualization ===
plot(longEma, color=color.red, title="Long EMA (200)")
plot(shortEma, color=color.blue, title="Short EMA (50)")
plot(rsi, color=color.purple, title="RSI")
hline(rsiBuyLevel, "RSI Buy Level", color=color.green)
plot(adx, color=color.orange, title="ADX")
hline(20, "ADX Threshold", color=color.red)
Published by ianzeng123 on the FMZ strategy square · last modified 2025-02-21. Collected in the Quant Trading Vault. Unvalidated research: re-test with your own data and costs before trusting it.
Build this with AgenKit
A spec is not a trading system. Paste this into your coding agent and AgenKit runs a specialist team — architecture, test-first build, risk gates, review — with paper trading on by default.
/agenkit build a production-grade trading bot with a backtest engine, risk controls and paper trading by default from strategies/Multi-Moving-Average-Trend-Following-and-Risk-Management-Quantitative-Trading-Strategy.md- npx agenkit install engineering-kit in your project
- Paste the command into your agent and approve each phase
- Get tests, backtest, risk controls and a paper-trading switch
Understand it first
Before you run this, read the lesson behind the idea and how to backtest it honestly. Specs like this one are the survivors of an unknown number of trials; deflate their results accordingly.
Related specs
- Trend Tracking and Short term Trading Strategy Based on ADX IndicatorPine Script · Trend following · 1d
- Adaptive Dynamic Stop Loss and Take Profit Strategy Based on EMA Crossover and RSI FilterPine Script · Trend following
- Dynamic Trend Identification Strategy with Exponential Moving Average and Adaptive Volatility ThresholdPine Script · Trend following · 1h
- Multi Indicator Crossover Dynamic Stop Loss Trend Following StrategyPine Script · Trend following · 1d
- Multi Period Trend Confirmation Dynamic Risk Control Quantitative Trading StrategyPine Script · Trend following · 1h
- Dual Trend Strategy with EMA Crossover and RSI FilterPine Script · Trend following · 1d