Strategy vault / Trend following
Multi Moving Average Trend Following Strategy Long term Investment Signal System Based on EMA and SMA Indicators
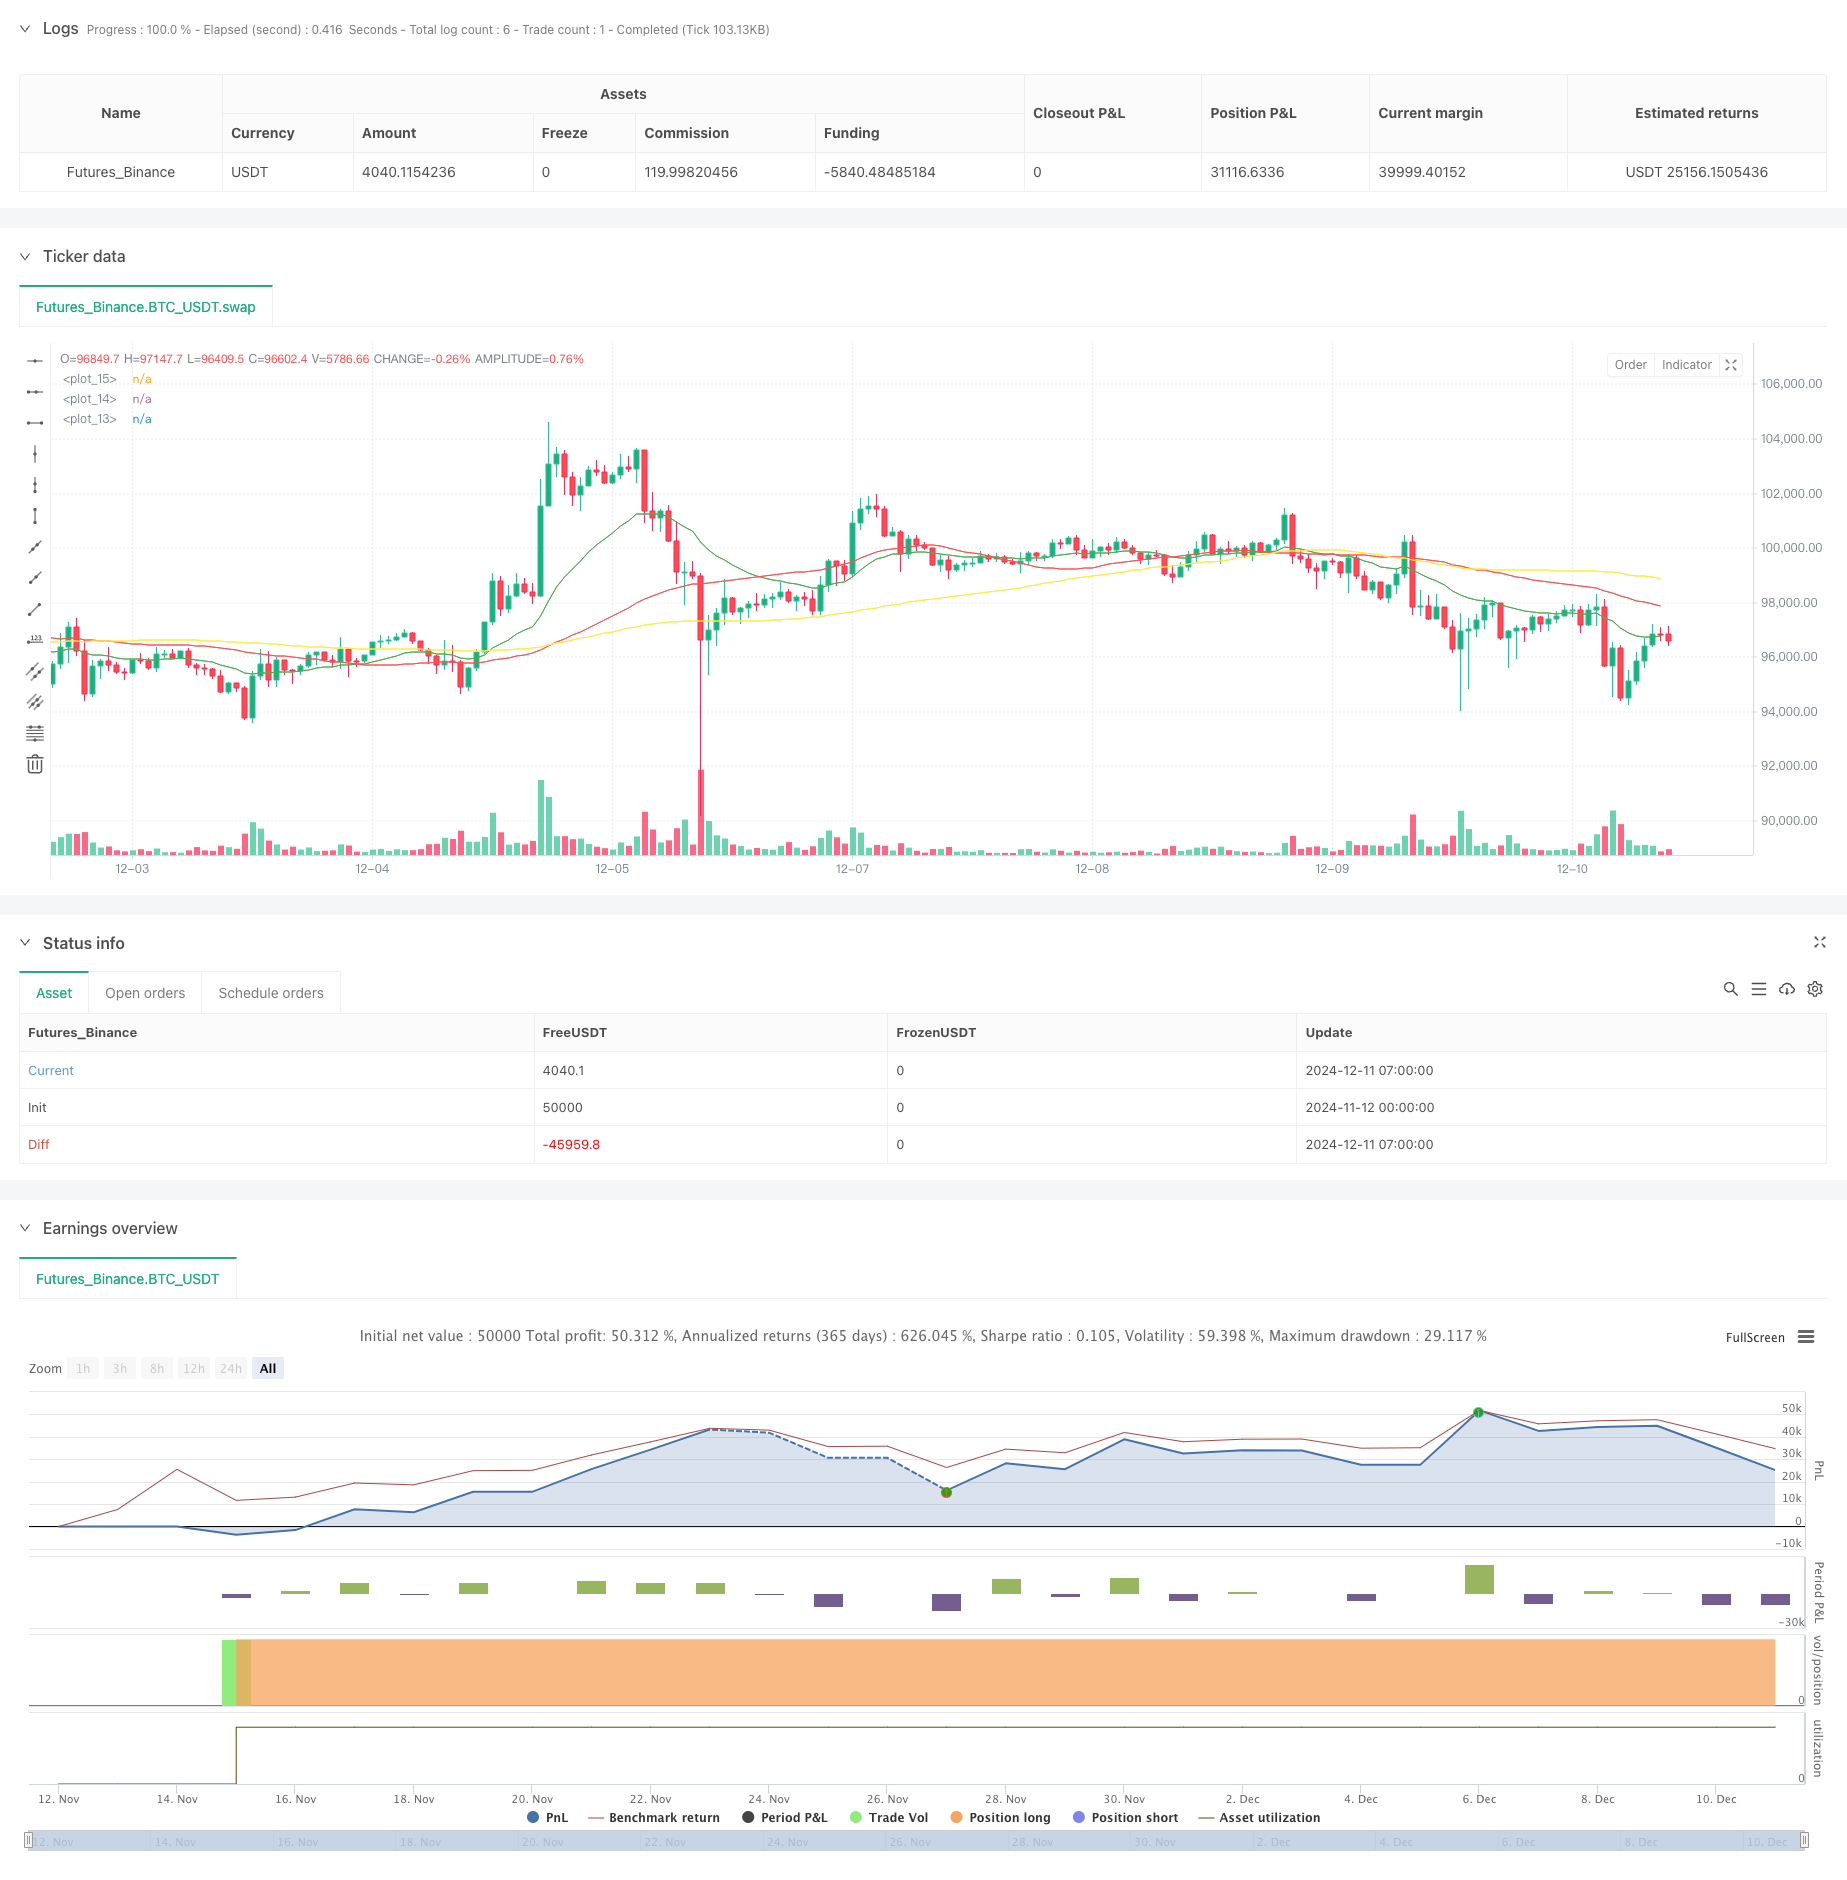
This strategy is a trend following system based on multiple moving averages combination, mainly utilizing the crossover and position relationships between Weekly EMA20, Daily SMA100, Daily SMA50, and Daily EMA20 to…
Overview
This strategy is a trend following system based on multiple moving averages combination, mainly utilizing the crossover and position relationships between Weekly EMA20, Daily SMA100, Daily SMA50, and Daily EMA20 to capture medium to long-term investment opportunities. The strategy identifies potential long entry points by observing the relationship between price and moving averages, combined with duration requirements.
Strategy Principles
The core logic of the strategy is based on the following key conditions:
- Uses 20-period Weekly Exponential Moving Average (EMA1W20) as the primary trend indicator
- Combines with 100-day Simple Moving Average (SMA1D100) for secondary trend confirmation
- Employs 50-day Simple Moving Average (SMA1D50) as medium-term trend reference
- Utilizes 20-day Exponential Moving Average (EMA1D20) for short-term trend confirmation The system generates a long signal when the price maintains above EMA1W20 and SMA1D100 for 14 consecutive days and then falls below SMA1D50. This design combines trend confirmation across multiple timeframes to enhance signal reliability.
Strategy Advantages
- Multi-timeframe validation: Combines weekly and daily moving averages for more comprehensive trend assessment
- Strict entry conditions: Requires price to maintain above major moving averages for sufficient duration, effectively filtering false signals
- Reasonable risk control: Uses multiple moving average crossovers and positions for clear risk boundaries
- High adaptability: Strategy parameters can be adjusted for different market environments
- Clear execution: Trading signals are well-defined and suitable for programmatic implementation
Strategy Risks
- Lag risk: Moving averages inherently have some lag, potentially causing delayed entries
- Sideways market risk: May generate frequent false breakout signals in ranging markets
- Parameter sensitivity: Optimal parameters may vary in different market environments
- Drawdown risk: May experience significant drawdowns during sudden trend reversals
- Execution risk: Requires stable system operation to avoid signal loss or execution delays
Strategy Optimization Directions
- Incorporate volume indicators: Add volume confirmation mechanism to improve signal reliability
- Optimize parameter adaptation: Develop dynamic parameter adjustment mechanisms
- Add filtering conditions: Consider adding market environment indicators
- Improve stop-loss mechanism: Design more detailed stop-loss and profit-taking rules
- Enhance signal confirmation: Consider adding other technical indicators for auxiliary confirmation
Summary
This strategy establishes a relatively comprehensive trend following system through multiple moving average combinations, suitable for medium to long-term investors. While it has certain lag and parameter sensitivity risks, the strategy has practical value through proper risk control and continuous optimization. Investors are advised to make appropriate adjustments based on their risk preferences and market conditions.
Source Pine Script
/*backtest
start: 2024-11-12 00:00:00
end: 2024-12-11 08:00:00
period: 1h
basePeriod: 1h
exchanges: [{"eid":"Futures_Binance","currency":"BTC_USDT"}]
*/

// This Pine Script™ code is subject to the terms of the Mozilla Public License 2.0 at https://mozilla.org/MPL/2.0/
// © petitepupu

//@version=5

ema20wTemp = ta.ema(close, 20)
ema20w = request.security(syminfo.tickerid, "1W", ema20wTemp, barmerge.gaps_on, barmerge.lookahead_off)
sma100d = ta.sma(close, 100)
sma50d = ta.sma(close, 50)
ema20d = ta.ema(close, 20)
daysAbove = input.int(14, title="Days", minval=1)
plot(ema20w, color=color.blue)
plot(sma100d, color=color.yellow)
plot(sma50d, color=color.red)
plot(ema20d, color=color.green)

longCondition = true
clean = true
for i = 0 to daysAbove
    if close[i] < ema20w or close[i] < sma100d or close > sma50d
        longCondition := false
        clean := false
        break

//TODO:
if clean != true
    longCondition := true
    for i = 0 to daysAbove
        if close[i] > ema20w or close[i] > sma100d or close >= ema20d or -100 * (close - ema20d)/ema20d < 5.9
            longCondition := false
            break


// plotshape(series=longCondition, location=location.belowbar, color=color.green, style=shape.triangleup, title="Buy Signal", size = size.small)

if (longCondition)
    strategy.entry("Long", strategy.long)


strategy(title="LT Strategy", overlay=true, default_qty_type=strategy.percent_of_equity, default_qty_value=800)
Published by ChaoZhang on the FMZ strategy square · last modified 2024-12-13. Collected in the Quant Trading Vault. Unvalidated research: re-test with your own data and costs before trusting it.
Build this with AgenKit
A spec is not a trading system. Paste this into your coding agent and AgenKit runs a specialist team — architecture, test-first build, risk gates, review — with paper trading on by default.
/agenkit build a production-grade trading bot with a backtest engine, risk controls and paper trading by default from strategies/Multi-Moving-Average-Trend-Following-Strategy-Long-term-Investment-Signal-System-Based-on-EMA-and-SMA-Indicators.md- npx agenkit install engineering-kit in your project
- Paste the command into your agent and approve each phase
- Get tests, backtest, risk controls and a paper-trading switch
Understand it first
Before you run this, read the lesson behind the idea and how to backtest it honestly. Specs like this one are the survivors of an unknown number of trials; deflate their results accordingly.
Related specs
- EMA SMA Trend Following with Swing Trading Strategy Combined Volume Filter and Percentage Take Profit Stop Loss SystemPine Script · Trend following · 1d
- Fixed Range Volume Profile And Anchored VWAP Trend Identification Strategy With Dynamic Stop LossPine Script · Trend following · 1h
- Multi Factor Trend Price Action Strategy with Dynamic Risk Management SystemPine Script · Trend following · 2h
- Multi Period Moving Average Ribbon and MACD Crossover Strategy SystemPine Script · Trend following · 1h
- Multi Period Phase Crossover with EMA Trend Following StrategyPine Script · Trend following · 1d
- Trend Following Strategy Based on Moving Average 439858Pine Script · Trend following · 1d