Strategy vault / Mean reversion
Multi Moving Average Trend Reversal Quantitative Strategy Combined EMA and SMA Signal System
This strategy is a trend reversal trading system based on multiple moving average combinations, incorporating 9-period, 21-period, 50-period, and 200-period moving averages to identify market trend turning points…
Overview
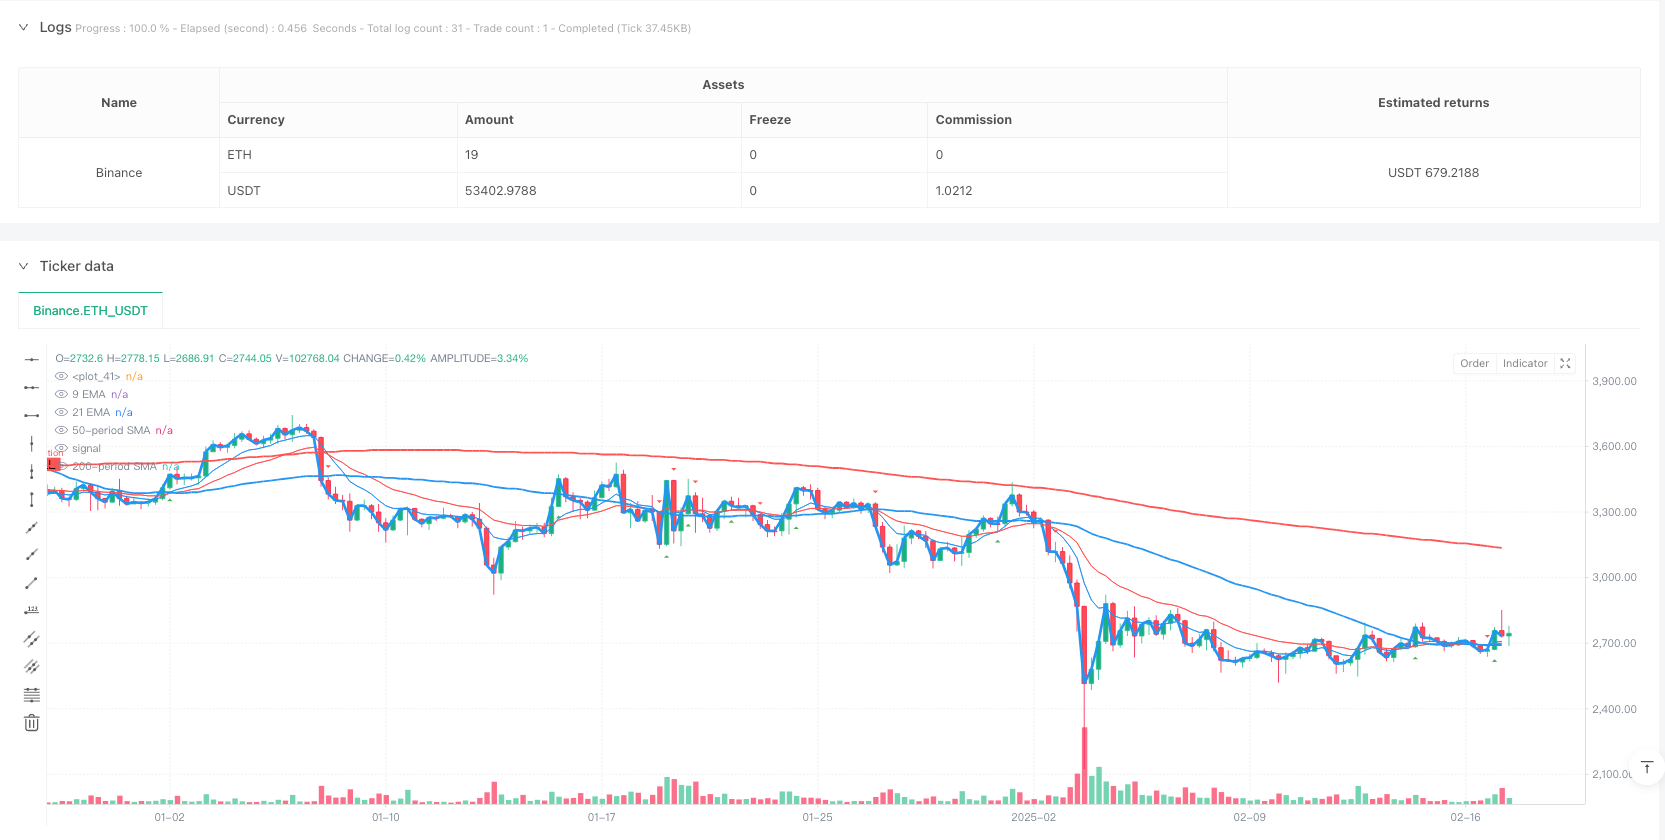
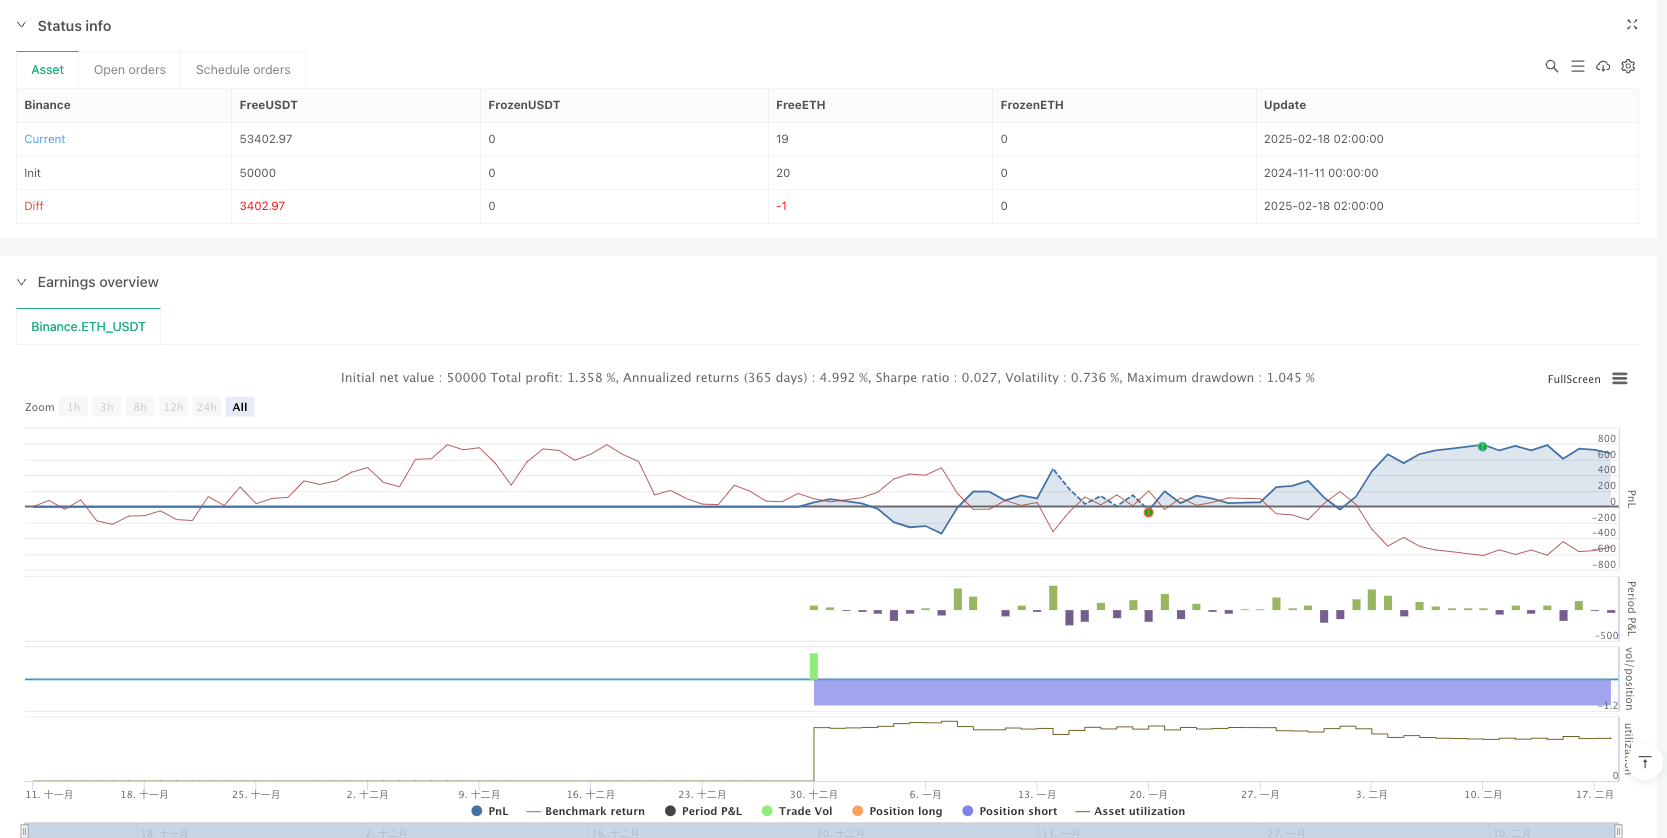
This strategy is a trend reversal trading system based on multiple moving average combinations, incorporating 9-period, 21-period, 50-period, and 200-period moving averages to identify market trend turning points through crossover signals. The strategy integrates the advantages of both short-term and long-term moving averages, enabling timely capture of market momentum changes while effectively filtering false signals.
Strategy Principles
The core logic is built on a multiple timeframe moving average crossover system. Specifically:
- Uses 50-period and 200-period Simple Moving Averages (SMA) as primary trend indicators
- Employs 9-period and 21-period Exponential Moving Averages (EMA) for short-term signal confirmation
- Optimizes signal quality through lookback period and threshold parameters
- Incorporates support and resistance level identification using pivot point algorithms The system generates buy signals when shorter-term averages cross above longer-term ones, and sell signals when the opposite occurs.
Strategy Advantages
- Signal Reliability: Multiple moving average confirmations significantly reduce false signal risks
- Timely Trend Capture: Short-term averages enable quick response to market changes
- Comprehensive Risk Control: Support and resistance identification aids in stop-loss and take-profit placement
- Parameter Flexibility: Adjustable lookback and threshold parameters for different market conditions
- Intuitive Visualization: Clear graphical interface facilitates trading decisions
Strategy Risks
- Choppy Market Risk: May generate frequent false signals during consolidation phases
- Lag Risk: Moving averages are inherently lagging indicators, potentially missing optimal entry points
- Parameter Sensitivity: Different parameter combinations may lead to varying strategy performance
- Market Environment Dependency: Strategy performs better in trending markets, may underperform during high volatility periods
Strategy Optimization Directions
- Volume Integration: Consider incorporating volume as a signal confirmation indicator
- Signal Filtering Enhancement: Design stricter signal confirmation mechanisms, such as requiring signal persistence
- Dynamic Parameter Adjustment: Develop adaptive parameter systems that automatically adjust based on market conditions
- Risk Control Improvement: Add dynamic stop-loss mechanisms to protect profits
- Market Context Integration: Incorporate volatility indicators to adapt parameters to different market environments
Summary
The strategy effectively identifies market trend turning points through the synergy of multiple moving average systems. The design emphasizes practicality and operability, with flexible parameter adjustment capabilities for different market conditions. While certain limitations exist, continuous optimization and refinement show promising potential for overall strategy performance.
Source Pine Script
/*backtest
start: 2024-11-11 00:00:00
end: 2025-02-18 08:00:00
period: 6h
basePeriod: 6h
exchanges: [{"eid":"Binance","currency":"ETH_USDT"}]
*/

//@version=6
//indicator("9/21 EMA Support & Resistance By DSW", overlay=true)
//indicator("Thick and Colorful Line", overlay=true)


// Define the price data
price = close

//@version=6
strategy("9/21/50/200 By DSW Trend Reversal for Options", overlay=true)

// Define the moving averages
short_term_sma = ta.sma(close, 50)  // 50-period SMA
long_term_sma = ta.sma(close, 200)  // 200-period SMA

// Plot the moving averages
plot(short_term_sma, color=color.blue, linewidth=2, title="50-period SMA")
plot(long_term_sma, color=color.red, linewidth=2, title="200-period SMA")

// Detect crossovers
bullish_reversal = ta.crossover(short_term_sma, long_term_sma)  // Short-term SMA crosses above long-term SMA
bearish_reversal = ta.crossunder(short_term_sma, long_term_sma)  // Short-term SMA crosses below long-term SMA

// Plot signals on the chart
plotshape(bullish_reversal, title="Bullish Reversal", location=location.belowbar, color=color.green, style=shape.labelup, text="BUY")
plotshape(bearish_reversal, title="Bearish Reversal", location=location.abovebar, color=color.red, style=shape.labeldown, text="SELL")

// Strategy to buy or sell based on the crossovers
if bullish_reversal
    strategy.entry("Buy Option", strategy.long)  // Buy Call for a bullish reversal

if bearish_reversal
    strategy.entry("Sell Option", strategy.short)  // Buy Put for a bearish reversal


// Define the color and line thickness
line_color = color.new(color.blue, 0)  // You can change this to any color you like
line_width = 3  // This controls the thickness of the line

// Plot the line
plot(price, color=line_color, linewidth=line_width)

// Input parameters
lookback = input.int(10, "Lookback Period")
threshold = input.float(0.5, "Threshold", minval=0, maxval=100, step=0.1)

// Calculate EMAs
ema9 = ta.ema(close, 9)
ema21 = ta.ema(close, 21)

// Plot EMAs
plot(ema9, color=color.blue, title="9 EMA")
plot(ema21, color=color.red, title="21 EMA")

// Function to find pivot highs and lows
pivotHigh = ta.pivothigh(high, lookback, lookback)
pivotLow = ta.pivotlow(low, lookback, lookback)

// EMA Crossover
crossover = ta.crossover(ema9, ema21)
crossunder = ta.crossunder(ema9, ema21)

// Plot crossover signals
plotshape(crossover, title="Bullish Crossover", location=location.belowbar, color=color.green, style=shape.triangleup, size=size.small)
// Plot bearish crossover signals
plotshape(crossunder, title="Bearish Crossover", location=location.abovebar, color=color.red, style=shape.triangledown, size=size.small)


// Alert conditions
if crossover
    alert("Bullish EMA Crossover", alert.freq_once_per_bar)

if crossunder
    alert("Bearish EMA Crossover", alert.freq_once_per_bar)
Published by ianzeng123 on the FMZ strategy square · last modified 2025-02-27. Collected in the Quant Trading Vault. Unvalidated research: re-test with your own data and costs before trusting it.
Build this with AgenKit
A spec is not a trading system. Paste this into your coding agent and AgenKit runs a specialist team — architecture, test-first build, risk gates, review — with paper trading on by default.
/agenkit build a production-grade trading bot with a backtest engine, risk controls and paper trading by default from strategies/Multi-Moving-Average-Trend-Reversal-Quantitative-Strategy-Combined-EMA-and-SMA-Signal-System.md- npx agenkit install engineering-kit in your project
- Paste the command into your agent and approve each phase
- Get tests, backtest, risk controls and a paper-trading switch
Understand it first
Before you run this, read the lesson behind the idea and how to backtest it honestly. Specs like this one are the survivors of an unknown number of trials; deflate their results accordingly.
Related specs
- Advanced Momentum EMA Trend Following with RSI Overbought Oversold Trading StrategyPine Script · Mean reversion · 1d
- Advanced Quantitative Trading Strategy Combining RSI Divergence and Moving AveragesPine Script · Mean reversion · 1h
- Oma and Apollo Dual Rail Trading StrategyPine Script · Mean reversion · 5m
- Trend Reversal Momentum Indicators Crossover Tracking StrategyPine Script · Mean reversion · 1h
- Fibonacci Channel Based Candlestick Reversal Trading StrategyPine Script · Mean reversion · 1h
- Reversal Fluctuation CAT StrategyPine Script · Mean reversion · 2h