Multi Parameter Crossover Trend Momentum Strategy
This is a complex multi-indicator trading strategy that combines four technical analysis tools: Exponential Moving Average (EMA), Relative Strength Index (RSI), Moving Average Convergence Divergence (MACD), and…
Overview
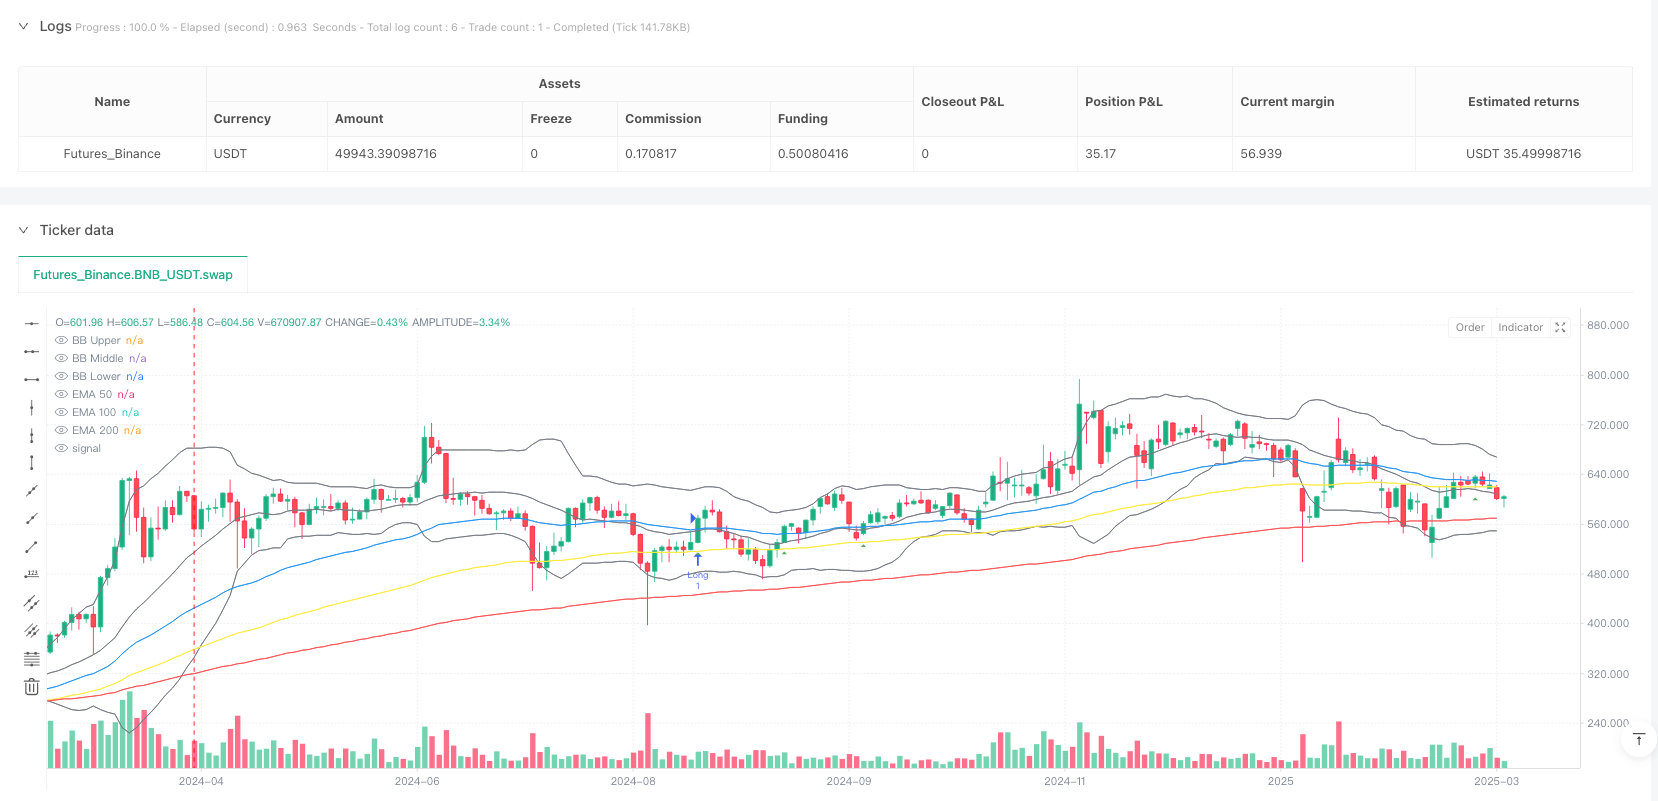
This is a complex multi-indicator trading strategy that combines four technical analysis tools: Exponential Moving Average (EMA), Relative Strength Index (RSI), Moving Average Convergence Divergence (MACD), and Bollinger Bands. The strategy aims to identify potential entry points by verifying signals through multiple indicators, focusing on capturing trend-driven price movements with a strict signal filtering mechanism.
Strategy Principle
The core principle is based on comprehensive analysis of four key technical indicators:
- Using three EMA lines of different periods to determine overall trend direction
- Using RSI to assess market momentum and overbought/oversold conditions
- Judging trend momentum through MACD line and signal line crossovers
- Combining Bollinger Bands upper and lower rails as additional price volatility reference
Specific entry logic includes:
Long entry conditions:
- Close price crosses above 50-day EMA
- 50-day EMA higher than 100-day EMA, and 100-day EMA higher than 200-day EMA
- RSI between 50-70
- MACD line above signal line
Short entry conditions:
- Close price crosses below 50-day EMA
- 50-day EMA lower than 100-day EMA, and 100-day EMA lower than 200-day EMA
- RSI between 30-50
- MACD line below signal line
Strategy Advantages
- Multi-indicator verification significantly improves signal reliability
- Strong trend tracking capability using triple EMA structure
- Precise momentum judgment through RSI and MACD combination
- Effective risk control with strict entry conditions
- Clear visual entry signals and trend indications
Strategy Risks
- Complex multi-indicator approach may cause signal delays
- Potential multiple invalid signals in range-bound markets
- Fixed parameters might not adapt to all market environments
- Lack of stop-loss mechanism risks significant drawdowns
Strategy Optimization Directions
- Introduce adaptive parameter adjustment mechanism
- Add stop-loss and take-profit strategies
- Dynamically adjust entry thresholds based on market cycles
- Incorporate volatility indicators for further signal verification
- Evaluate and optimize the best combination of indicator parameters
Conclusion
This is a highly systematic multi-parameter crossover trend momentum strategy that aims to provide more accurate and reliable trading signals through compound verification of four technical indicators. Despite its significant advantages, continuous optimization and risk management remain crucial.
Source Pine Script
/*backtest
start: 2024-04-02 00:00:00
end: 2025-04-01 00:00:00
period: 2d
basePeriod: 2d
exchanges: [{"eid":"Futures_Binance","currency":"BNB_USDT"}]
*/

//@version=5
strategy("Multi-Indicator Trading Strategy", overlay=true)

// Input variables
len1 = input(50, "EMA 50")
len2 = input(100, "EMA 100")
len3 = input(200, "EMA 200")
rsiLength = input(14, "RSI Length")
rsiOverbought = input(70, "RSI Overbought")
rsiOversold = input(30, "RSI Oversold")

// Indicators
ema50 = ta.ema(close, len1)
ema100 = ta.ema(close, len2)
ema200 = ta.ema(close, len3)
rsi = ta.rsi(close, rsiLength)
[macdLine, signalLine, histLine] = ta.macd(close, 12, 26, 9)
[middle, upper, lower] = ta.bb(close, 20, 2)

// Trading signals
longCondition = ta.crossover(close, ema50) and ema50 > ema100 and ema100 > ema200 and rsi > 50 and rsi < rsiOverbought and macdLine > signalLine

shortCondition = ta.crossunder(close, ema50) and
                 ema50 < ema100 and
                 ema100 < ema200 and
                 rsi < 50 and
                 rsi > rsiOversold and
                 macdLine < signalLine

// Plots
plot(ema50, "EMA 50", color.blue)
plot(ema100, "EMA 100", color.yellow)
plot(ema200, "EMA 200", color.red)
plot(upper, "BB Upper", color.gray)
plot(middle, "BB Middle", color.gray)
plot(lower, "BB Lower", color.gray)

// Signals
plotshape(longCondition, "Long", shape.triangleup, location.belowbar, color.green)
plotshape(shortCondition, "Short", shape.triangledown, location.abovebar, color.red)

// Strategy
if (longCondition)
    strategy.entry("Long", strategy.long)

if (shortCondition)
    strategy.entry("Short", strategy.short)
Published by ianzeng123 on the FMZ strategy square · last modified 2025-04-02. Collected in the Quant Trading Vault. Unvalidated research: re-test with your own data and costs before trusting it.
Build this with AgenKit
A spec is not a trading system. Paste this into your coding agent and AgenKit runs a specialist team — architecture, test-first build, risk gates, review — with paper trading on by default.
/agenkit build a production-grade trading bot with a backtest engine, risk controls and paper trading by default from strategies/Multi-Parameter-Crossover-Trend-Momentum-Strategy.md- npx agenkit install engineering-kit in your project
- Paste the command into your agent and approve each phase
- Get tests, backtest, risk controls and a paper-trading switch
Understand it first
Before you run this, read the lesson behind the idea and how to backtest it honestly. Specs like this one are the survivors of an unknown number of trials; deflate their results accordingly.
Related specs
- Advanced Multi Indicator Trend Following and Momentum Quantitative Trading StrategyPine Script · Momentum · 1h
- Momentum Indicator Aggregation Trading StrategyPine Script · Momentum · 1h
- Multi Indicator Trend Momentum Trading Strategy An Optimized Quantitative Trading System Based on Bollinger Bands Fibonacci and ATRPine Script · Momentum · 1h
- Multi Trend Momentum Crossover Strategy with Volatility Optimization SystemPine Script · Momentum · 1d
- Momentum Oscillation Crossing Bollinger Bands with Moving Average StrategyPine Script · Momentum · 1d
- Schaff Trend Cycle Momentum Following StrategyPine Script · Momentum · 1h