Multi Period EMA Crossover with RSI Momentum and ATR Volatility Based Trend Following Strategy
This strategy is a trend-following system based on technical analysis, combining moving averages, RSI momentum indicator, and ATR volatility indicator to validate trading opportunities through multiple signal…
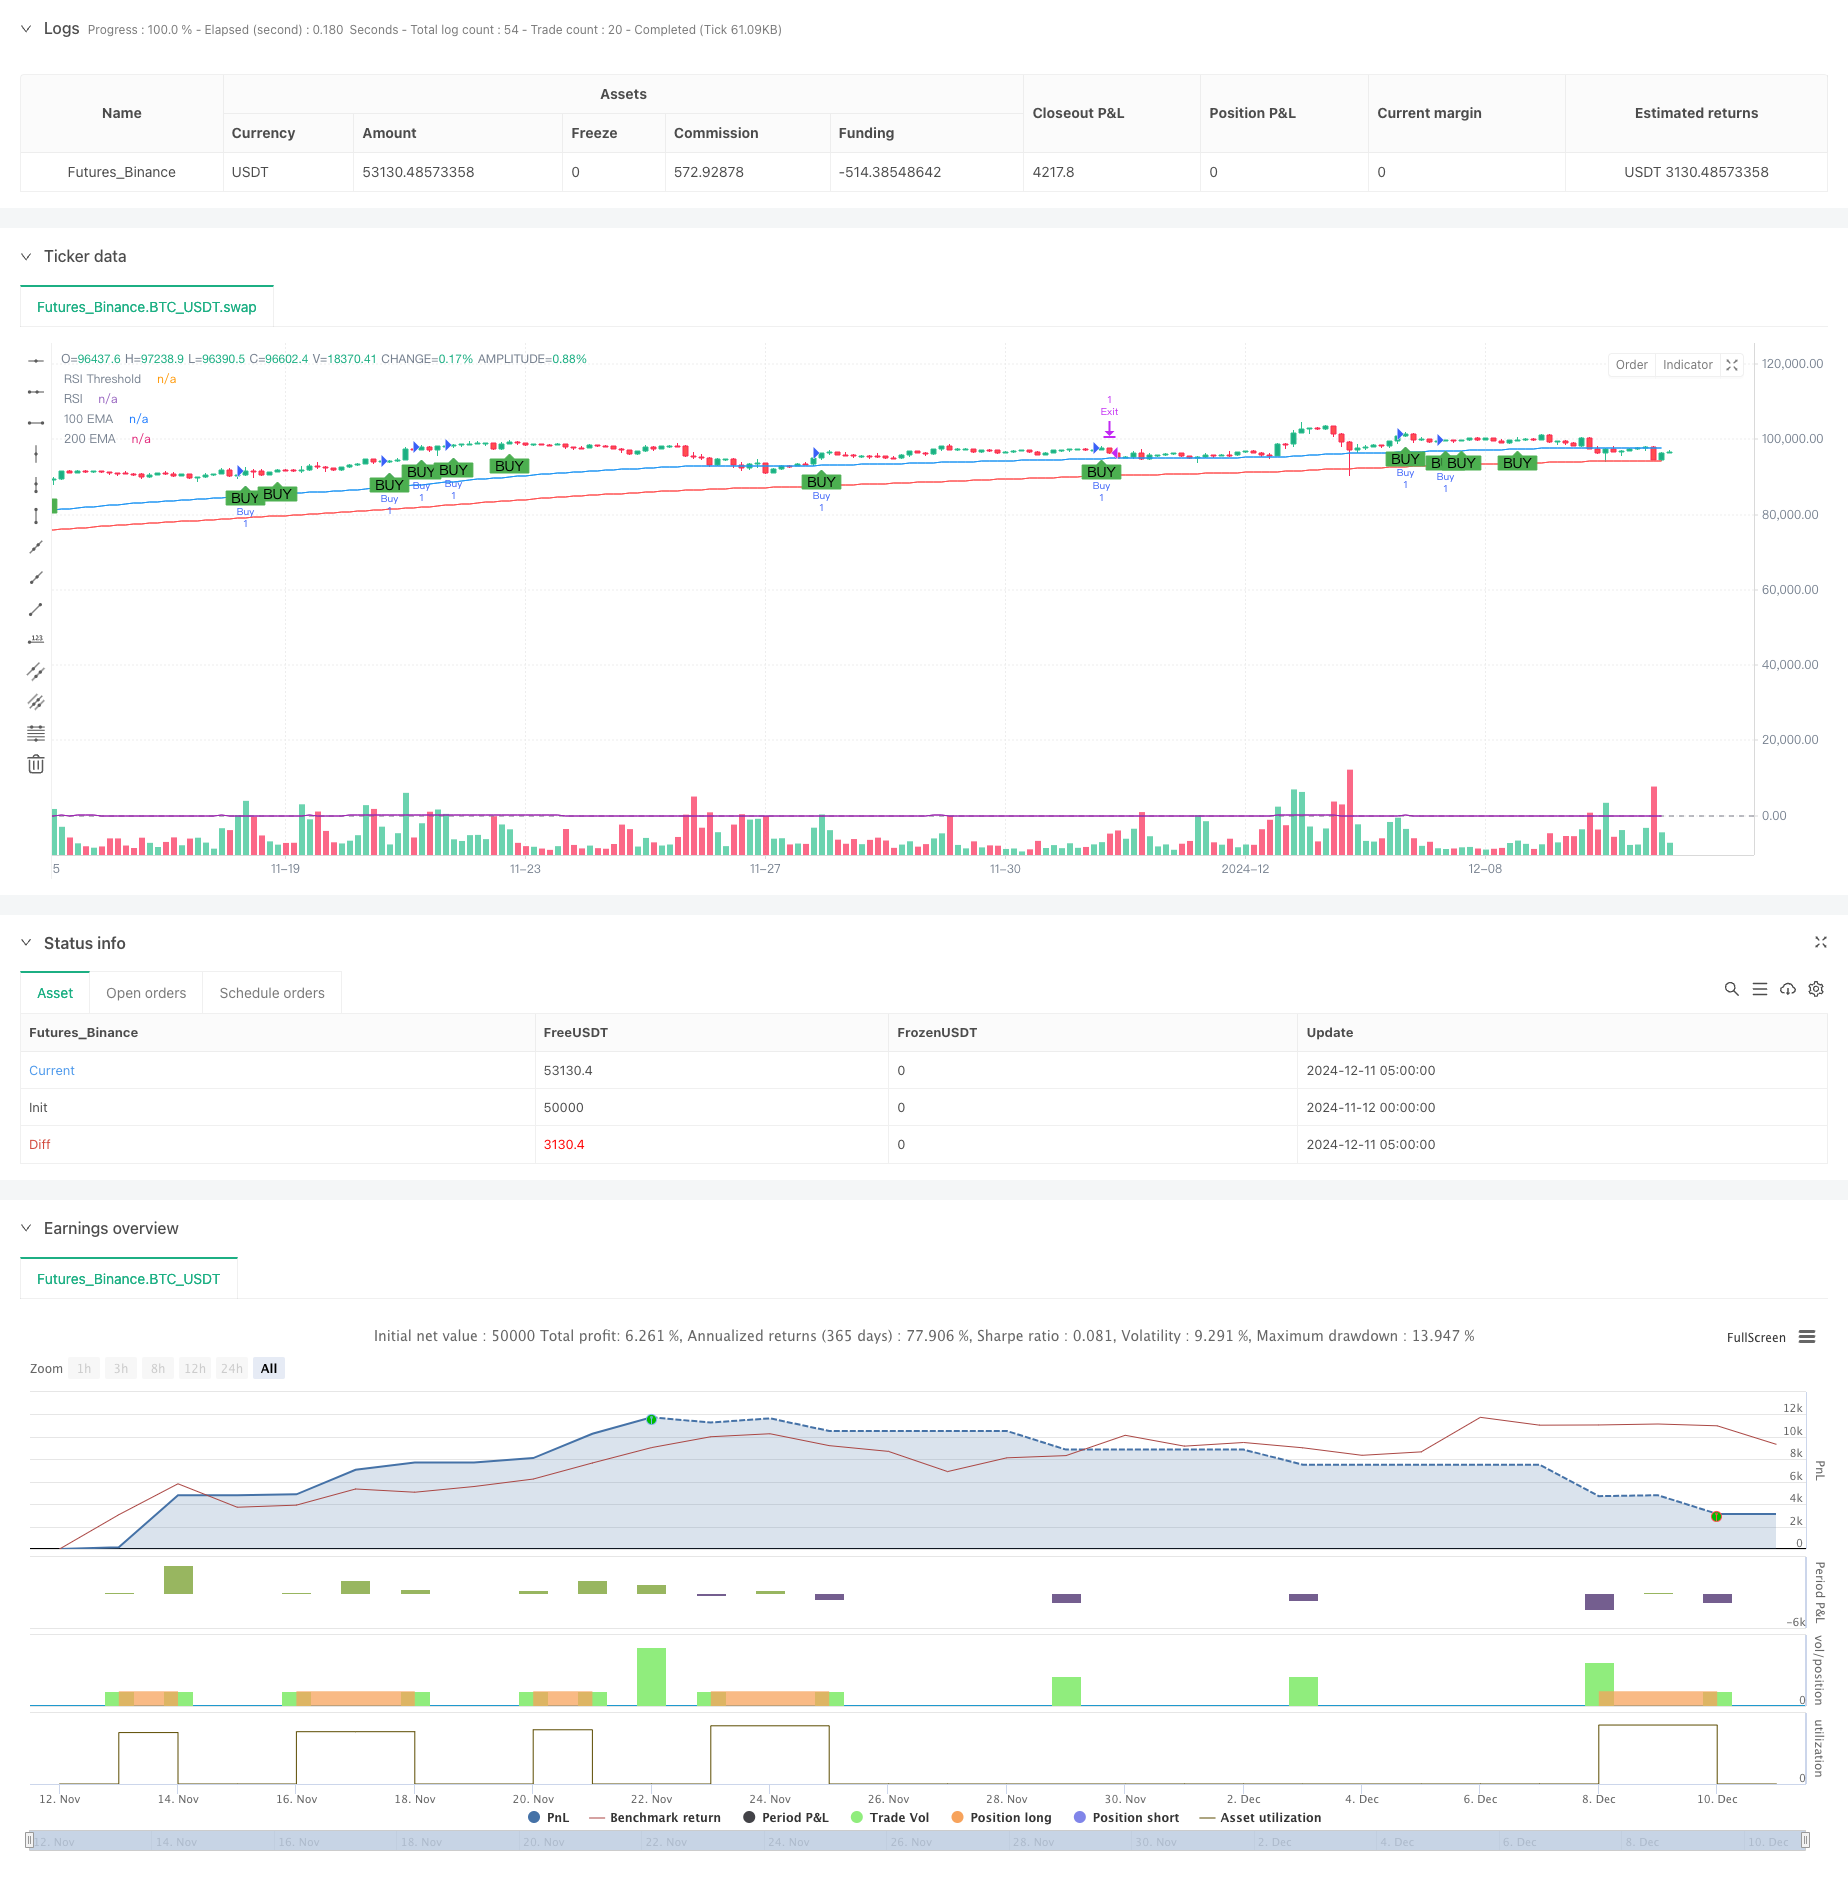
Overview
This strategy is a trend-following system based on technical analysis, combining moving averages, RSI momentum indicator, and ATR volatility indicator to validate trading opportunities through multiple signal confirmations. The strategy uses multi-period moving average crossovers to determine market trends, combines RSI momentum to confirm price strength, and finally uses ATR to dynamically set stop-loss and take-profit levels, forming a complete trading system.
Strategy Principles
The core logic of the strategy includes three key components:
- Trend Determination: Uses 100-period and 200-period Exponential Moving Average (EMA) crossovers to confirm market trend direction. When the short-term EMA is above the long-term EMA, it indicates an upward market trend.
- Entry Signals: Based on trend confirmation, the strategy looks for bullish engulfing patterns as specific entry points and uses the RSI indicator for signal filtering. When the RSI value is above 50, it indicates sufficient upward momentum in the market.
- Position Management: Uses 14-period ATR to measure market volatility and dynamically sets stop-loss and profit levels accordingly. Stop-loss is set at 1.1 times ATR, and profit target at 2.0 times ATR, ensuring a risk-reward ratio greater than 1.
Strategy Advantages
- Multiple Signal Validation: Combining trend, price patterns, and momentum indicators significantly reduces the impact of false signals.
- Dynamic Risk Management: ATR-based stop-loss and profit settings can adaptively adjust according to market volatility, avoiding limitations of fixed levels.
- Trend Following Characteristics: Using moving average systems to judge trends effectively avoids unnecessary trades in sideways or downward markets.
- Complete Trading Framework: Includes a complete strategy system covering entry, exit, and position management.
Strategy Risks
- Trend Delay: EMA as a lagging indicator may lead to delayed entry timing, potentially missing optimal entry points in rapidly volatile markets.
- Sideways Market Risk: Frequent moving average crossovers in sideways markets may lead to overtrading.
- False Breakout Risk: Bullish engulfing patterns may produce false breakouts, requiring strict risk control management.
- Stop-Loss Setting Risk: Too small ATR multipliers may lead to frequent stop-losses, while too large multipliers may bear excessive risk.
Strategy Optimization Directions
- Introduce Volume Indicators: Can improve signal reliability by adding volume confirmation.
- Optimize Moving Average Periods: Can adjust moving average periods according to different market characteristics to better adapt to market rhythm.
- Improve Stop-Loss Mechanism: Consider adding trailing stops to protect profits during trend continuation.
- Add Market Environment Filtering: Introduce volatility range judgment to reduce trading frequency in excessively volatile market environments.
- Optimize RSI Parameters: Can seek optimal RSI thresholds and calculation periods through historical data backtesting.
Summary
This strategy constructs a logically complete trend-following system by integrating multiple technical indicators. The strategy's advantages lie in multiple signal validation and dynamic risk management, but attention must also be paid to handling trend delays and false breakouts. Through adding volume confirmation and optimizing parameter settings, the strategy still has significant room for improvement. Overall, this strategy is suitable for operating in clearly trending markets and has good application value for tracking medium to long-term trends.
Source Pine Script
/*backtest
start: 2024-11-12 00:00:00
end: 2024-12-11 08:00:00
period: 3h
basePeriod: 3h
exchanges: [{"eid":"Futures_Binance","currency":"BTC_USDT"}]
*/

//@version=5
strategy("Bullish Engulfing with EMA Crossover and ATR-Based SL/TP with RSI Filter", overlay=true)

// Inputs for moving averages
short_ema_length = input.int(100, title="Short EMA Length")
long_ema_length = input.int(200, title="Long EMA Length")

// RSI Input
rsi_length = input.int(14, title="RSI Length")
rsi_threshold = input.float(50, title="RSI Threshold")

// Calculate the Exponential Moving Averages (EMAs)
short_ema = ta.ema(close, short_ema_length)
long_ema = ta.ema(close, long_ema_length)

// Plot EMAs on the chart
plot(short_ema, color=color.blue, title="100 EMA")
plot(long_ema, color=color.red, title="200 EMA")

// Calculate RSI
rsi_value = ta.rsi(close, rsi_length)

// Plot RSI on a separate panel
hline(rsi_threshold, "RSI Threshold", color=color.gray)
plot(rsi_value, color=color.purple, title="RSI")

// Bullish Engulfing Pattern
bullish_engulfing = close > open[1] and open < close[1] and close > open

// Define strategy entry condition with RSI filter
long_condition = bullish_engulfing and short_ema > long_ema and rsi_value > rsi_threshold

// Plot a buy signal when conditions are met
plotshape(long_condition, style=shape.labelup, location=location.belowbar, color=color.green, title="Buy Signal", text="BUY")

// ATR Calculation
atr_length = input.int(14, title="ATR Length")
atr_value = ta.atr(atr_length)

// Define Stop Loss and Take Profit as levels
stop_loss_level = 1.1 * atr_value
take_profit_level = 2.0 * atr_value

// Execute Strategy Entry
if (long_condition)
    strategy.entry("Buy", strategy.long)

// Adjust SL and TP levels using the entry price
if (strategy.position_size > 0)
    // Calculate SL and TP relative to the entry price
    stop_price = strategy.position_avg_price - stop_loss_level
    limit_price = strategy.position_avg_price + take_profit_level

    // Exit strategy with SL and TP
    strategy.exit("Exit", from_entry="Buy", stop=stop_price, limit=limit_price)
Published by ChaoZhang on the FMZ strategy square · last modified 2024-12-13. Collected in the Quant Trading Vault. Unvalidated research: re-test with your own data and costs before trusting it.
Build this with AgenKit
A spec is not a trading system. Paste this into your coding agent and AgenKit runs a specialist team — architecture, test-first build, risk gates, review — with paper trading on by default.
/agenkit build a production-grade trading bot with a backtest engine, risk controls and paper trading by default from strategies/Multi-Period-EMA-Crossover-with-RSI-Momentum-and-ATR-Volatility-Based-Trend-Following-Strategy.md- npx agenkit install engineering-kit in your project
- Paste the command into your agent and approve each phase
- Get tests, backtest, risk controls and a paper-trading switch
Understand it first
Before you run this, read the lesson behind the idea and how to backtest it honestly. Specs like this one are the survivors of an unknown number of trials; deflate their results accordingly.
Related specs
- Cross Period Momentum EMA Strategy with RSI and Dynamic ATR Stop LossPine Script · Momentum · 1d
- KST EMA Momentum Trend Following StrategyPine Script · Momentum · 1d
- Multi EMA Trend Momentum Trading Strategy with Risk Management SystemPine Script · Momentum · 1h
- Multi Indicator Trend Momentum Trading Strategy with Dynamic Risk Management SystemPine Script · Momentum · 1h
- Multi Technical Indicator Based Trend Following and Momentum StrategyPine Script · Momentum · 1d
- Multi Trend Momentum Crossover Strategy with Volatility Optimization SystemPine Script · Momentum · 1d